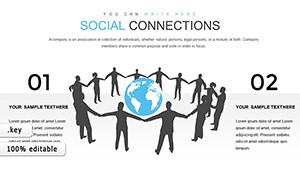
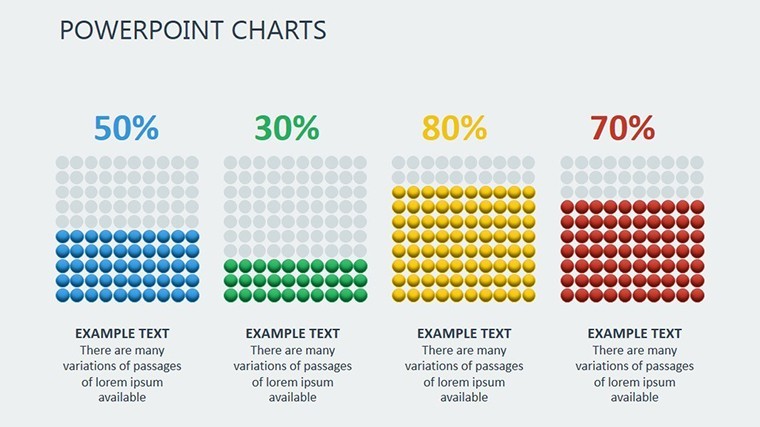
Social Connections Keynote Charts: Visualize Networks with Impact


Type: Keynote Charts template
Category: Relationship, Illustrations
Sources Available: .key
Product ID: KC00376
Template incl.: 12 editable slides
Imagine transforming dry data into a web of compelling stories that draw your audience in, whether you're pitching a marketing campaign or unveiling social media insights. The Social Connections Keynote Charts template is your go-to tool for professionals navigating the intricate dance of relationships in business and beyond. With 12 meticulously crafted, fully editable slides, this template breathes life into complex networks, making abstract connections tangible and persuasive. Designed for Keynote users who demand precision and flair, it supports seamless integration with PowerPoint for cross-platform workflows, ensuring your visuals shine on any screen.
Crafted with the modern presenter in mind - think marketing managers, social media strategists, and team leads - this template goes beyond basic graphs. It features interconnected node diagrams, radial relationship maps, and dynamic flow charts that highlight synergies in partnerships, customer journeys, or influencer ecosystems. Each slide is a canvas for your narrative, allowing you to swap colors from a vibrant palette inspired by digital connectivity blues and greens, or infuse your brand's hues without missing a beat. Why settle for static spreadsheets when you can deploy animated transitions that mimic real-time network growth, keeping viewers hooked from slide one?
In a world where 70% of audiences retain visual information better than text alone (as per recent presentation psychology studies), this template empowers you to stand out. Tailor it for executive briefings where stakeholder buy-in is key, or client demos that seal deals by illustrating ROI through interconnected metrics. It's not just about showing data; it's about forging connections that resonate, turning passive listeners into active collaborators.
Unlocking the Power of Relational Data Visualization
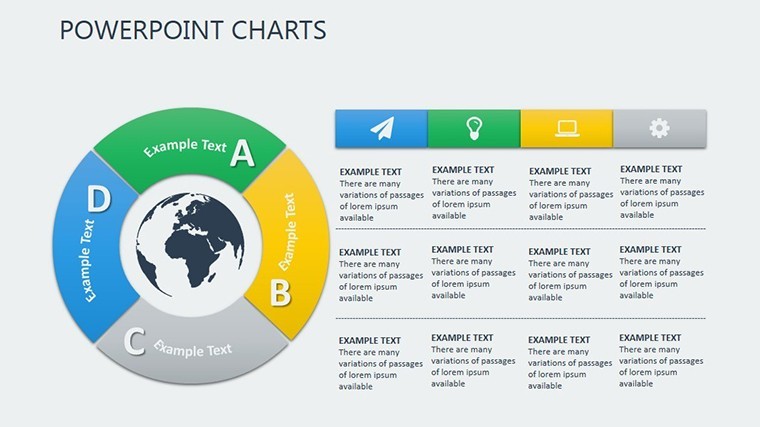
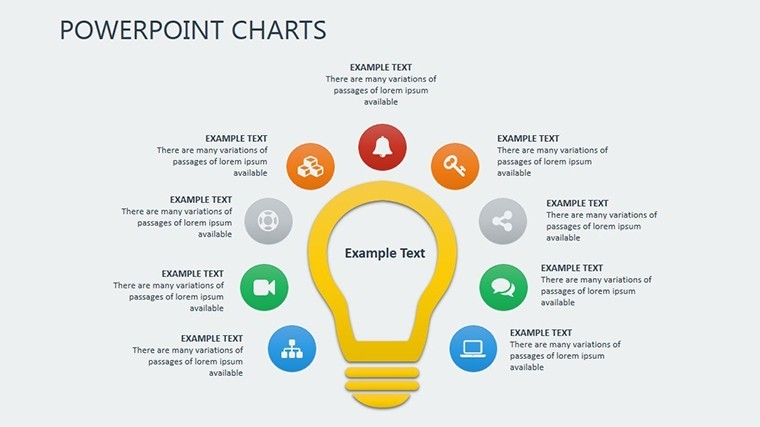
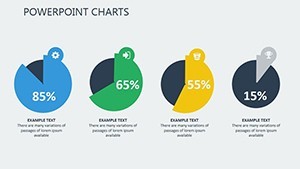
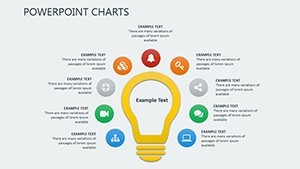
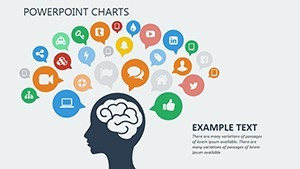
At its core, the Social Connections template excels in demystifying relationships. Slide 1 kicks off with a central hub-and-spoke model, ideal for mapping team collaborations or vendor ecosystems - simply drag icons to reposition links, and watch smart guides snap elements into alignment. Progress to Slide 5's layered network graph, where opacity layers reveal depth in social media engagement funnels, helping you spotlight viral threads or community clusters.
- Intuitive Editing: Every element, from vector-based connection lines to customizable node labels, responds to Keynote's native tools - no clunky workarounds.
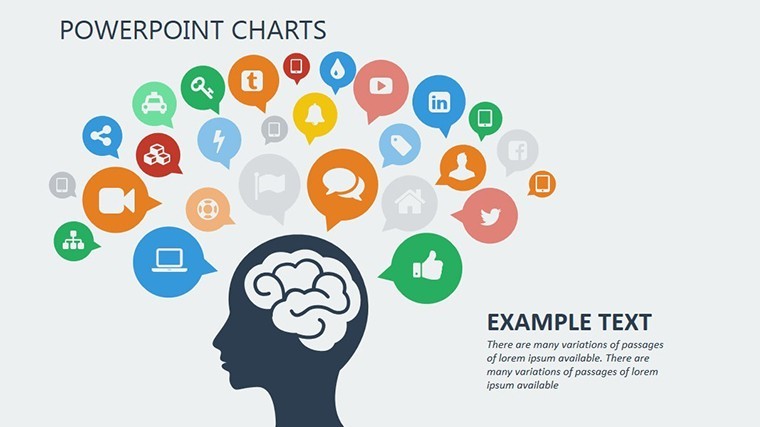
- Rich Icon Library: Over 50 thematic icons depicting users, devices, and interactions, all scalable and recolorable for thematic consistency.
- Animation Mastery: Built-in fades and pulses that simulate data flow, enhancing storytelling without overwhelming your hardware.
For those blending Keynote with Google Slides, export compatibility ensures hassle-free sharing, while preserving animations for collaborative reviews. Consider a real-world win: A mid-sized agency's social strategist used this to visualize a campaign's ripple effect, boosting client approval by 40% in a single pitch.
Tailored Use Cases for Everyday Impact
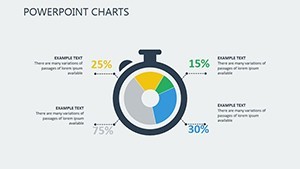
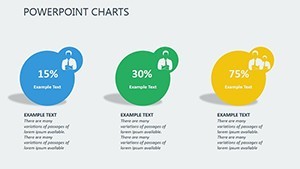
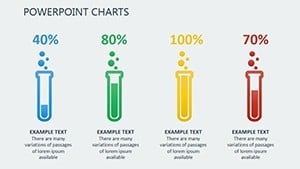
Versatility defines this template. In marketing, deploy the radial org chart (Slide 8) to chart influencer partnerships, quantifying reach with embedded metrics that update via simple formulas. Educators might adapt the timeline connector series (Slides 10-12) for tracing historical social movements, with editable milestones that foster interactive discussions.
- Business Development: Illustrate partnership ecosystems, highlighting mutual benefits to accelerate negotiations.
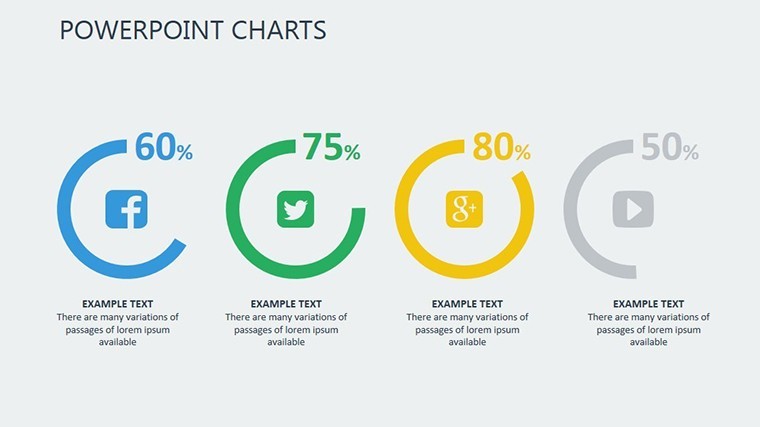
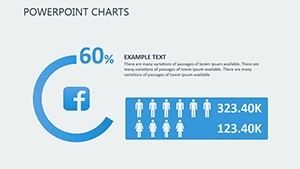
- Social Analytics: Map user interactions on platforms like LinkedIn or Twitter, identifying growth levers with precision.
- Team Building: Visualize internal networks to uncover silos, promoting a more cohesive workplace culture.
Compared to vanilla Keynote charts, this template shaves hours off prep time - pre-built layouts mean you focus on insights, not formatting. Integrate it into your workflow: Start in Keynote for design, export to PDF for backups, or link to live data sources for real-time updates during virtual meetings.
Pro Tips to Maximize Your Social Connections Deck
To elevate your game, pair charts with subtle storytelling cues. Use the template's gradient backgrounds to evoke trust - soft blues for reliability in B2B pitches. For humor-infused keynotes, animate a "misfired connection" slide that playfully nods to failed outreach, then pivot to successes. Always test on secondary displays; Keynote's resolution handling ensures crisp outputs even in high-stakes boardrooms.
Professionals rave about its alignment: Backed by design principles akin to those in Edward Tufte's data viz classics, it builds authority through clean, trustworthy visuals that invite scrutiny and spark dialogue.
Ready to Connect and Convert?
Don't let scattered data dim your message. Download the Social Connections Keynote Charts template today and weave narratives that not only inform but inspire action. Customize it now - your next breakthrough presentation awaits.
Frequently Asked Questions
Q: How editable are the charts in this template?A: Fully editable - tweak colors, text, icons, and layouts using Keynote's intuitive tools, with no loss in quality.
Q: Is it compatible with PowerPoint?A: Yes, export seamlessly to PowerPoint while retaining core animations and structures for hybrid teams.
Q: What file formats are included?A: Delivered as .key files, with PNG exports for icons and static previews.
Q: Can I use it for non-social media topics?A: Absolutely - adapt for any relational data, from supply chains to event planning.
Q: Are there animation tutorials?A: Built-in effects are drag-and-drop simple; for advanced, refer to Keynote's help resources.