Relationship Structures: Dynamic Keynote Charts Kit


Type: Keynote Charts template
Category: Relationship, Analysis
Sources Available: .key
Product ID: KC00370
Template incl.: 14 editable slides
Relationships - be they organizational webs, supply chain tangles, or social network knots - thrive on clarity, yet often drown in complexity. Enter our Structure Relationship Keynote Charts template: a 14-slide arsenal engineered to untangle and illuminate these bonds with surgical precision. Geared toward business strategists mapping alliances, educators diagramming ecosystems, and project leads charting dependencies, this kit turns chaotic info into coherent blueprints that drive decisions.
Inspired by systems thinking from thinkers like Donella Meadows in "Thinking in Systems," it equips you with tools proven in Fortune 500 planning sessions to cut through noise. Keynote-native, with responsive vectors that scale from mobile mocks to conference walls, it prioritizes intuition over instruction - drag a node, watch connections ripple. No more wrestling with clunky defaults; just pure, purposeful visualization that elevates your authority.
Standout Features for Seamless Structuring
Precision meets playfulness here, with designs that echo McKinsey-style reports for instant credibility. Early adopters note quicker consensus in meetings, aligning with findings from MIT Sloan on visual aids boosting collaboration by 35%.
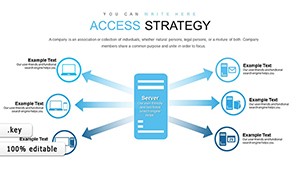
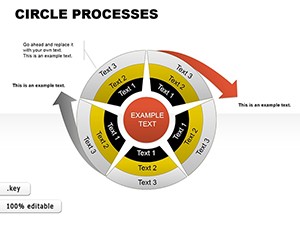
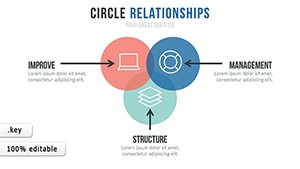
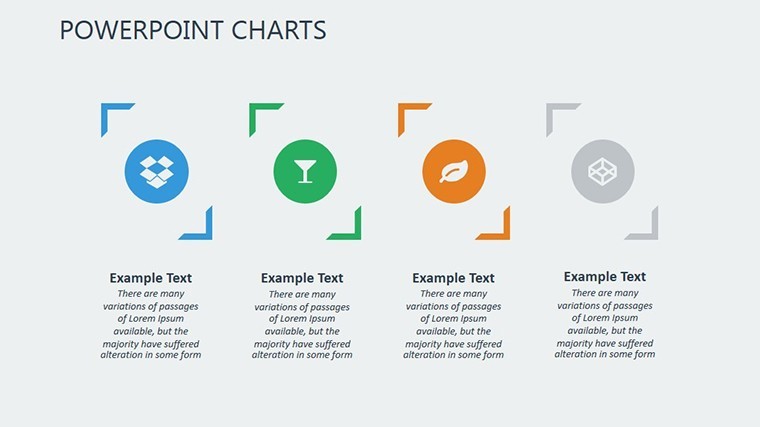
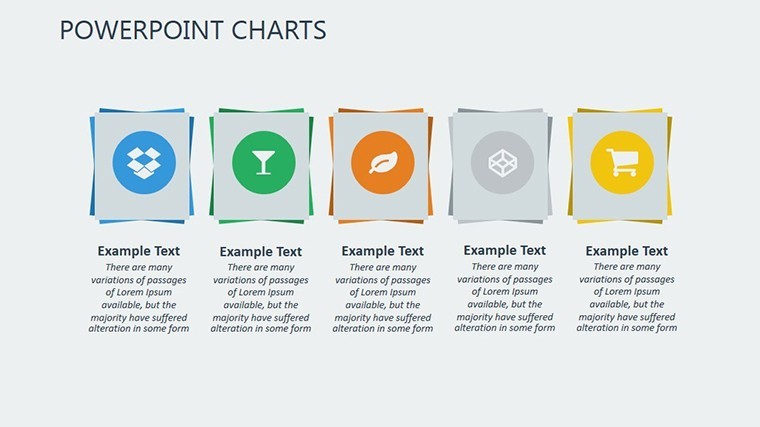
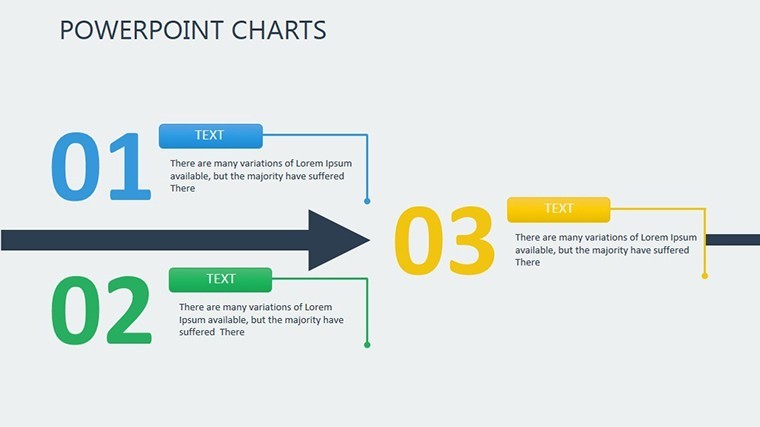
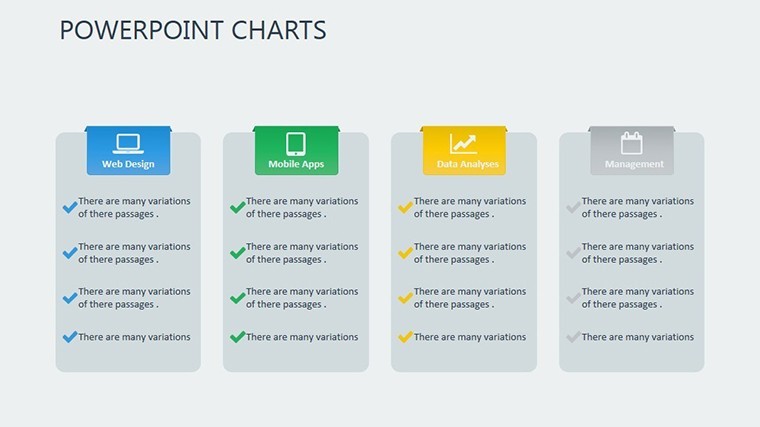
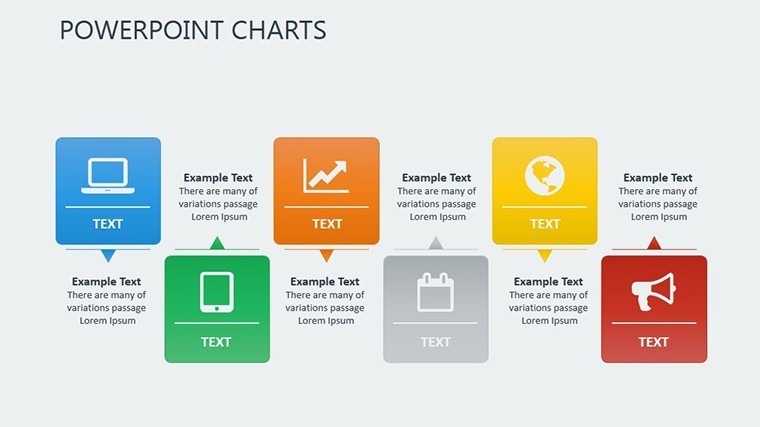
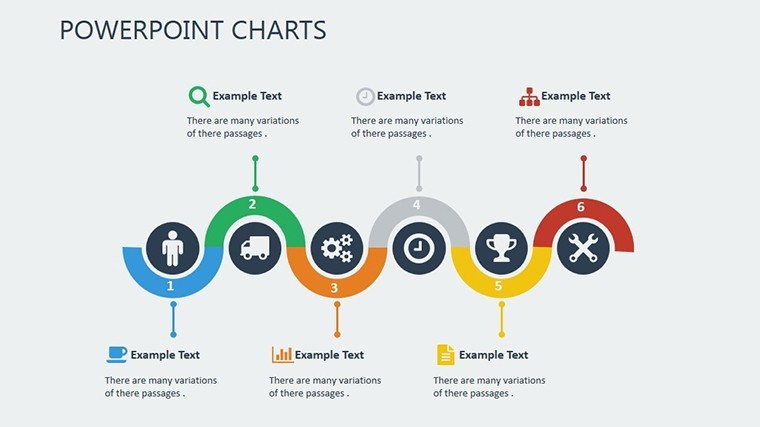
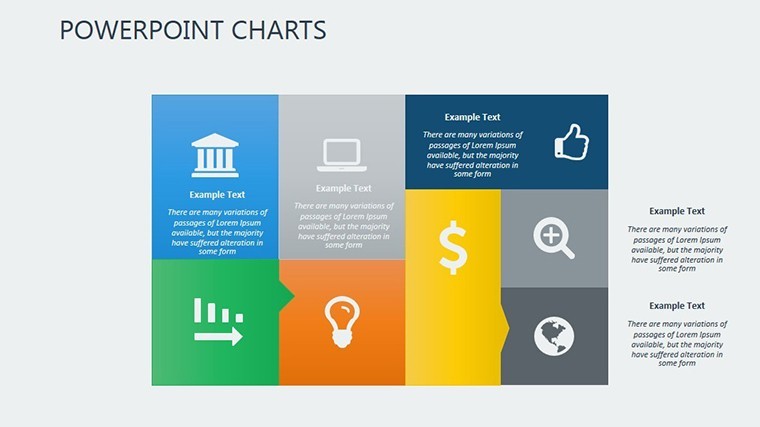
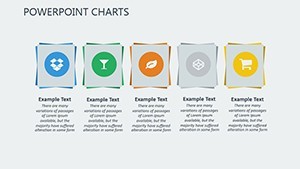
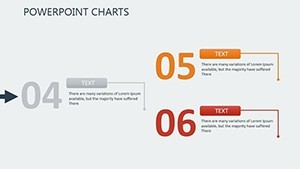
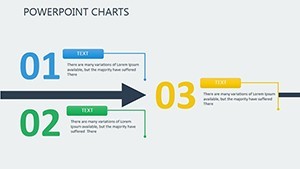
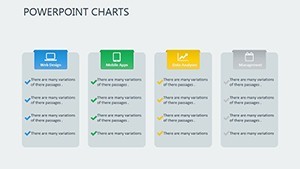
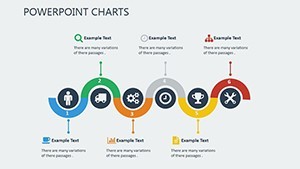
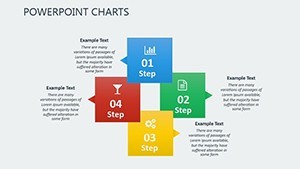
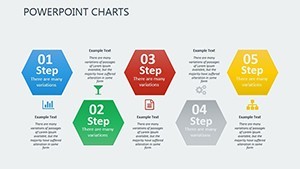
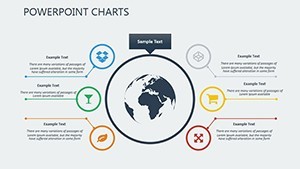
- Multi-Node Networks: Core charts span org charts to mind maps, with auto-routing lines that adjust on edits - ideal for evolving team structures.
- Adaptive Styling: Neutral bases with accent swatches for branding; think sleek lines for tech firms or organic curves for creative agencies.
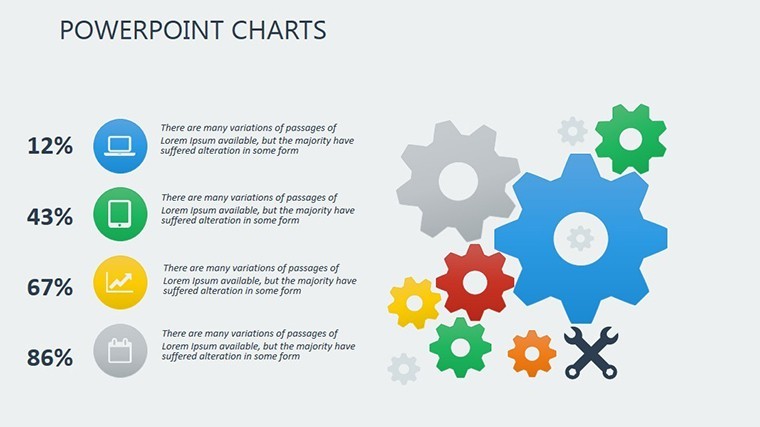
- Interactive Layers: Stackable elements for what-if scenarios, like simulating merger impacts with toggleable branches.
From Concept to Clarity: A Hands-On Example
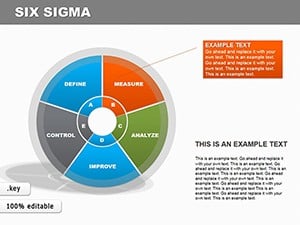
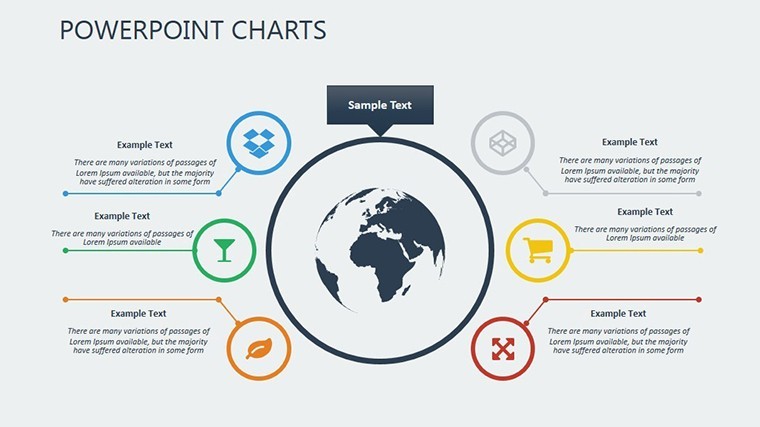
Picture orchestrating a cross-functional rollout, akin to agile transformations at Spotify. Launch with Slide 1's hierarchy skeleton - populate roles from your HR sheet, color-code departments for at-a-glance insights. Advance to Slide 6's relationship web, linking dependencies with weighted arrows (thicker for critical paths), animated to trace bottlenecks. Wrap on Slide 11 with a radial influence map, embedding metrics from Tableau exports for data-rich persuasion.
Flex it further: Rotate nodes for fresh perspectives, hyperlink clusters to detailed appendices, or infuse personality with custom labels like "Idea Incubator" nodes. In academia, it shines for sociology classes - students build kinship diagrams collaboratively, sparking debates on power dynamics.
Advantages That Connect the Dots
This template isn't a time-sink; it's a multiplier, halving revision cycles while doubling comprehension. Its file structure supports version control, and embedded keywords like "relationship diagram Keynote" optimize for internal searches too.
- Reveal Hidden Links: Spotlight interdependencies others miss, arming you for proactive pivots.
- Customize Intuitively: Theme switches in seconds, preserving layout integrity across devices.
- Amplify Narratives: Pair with Keynote builds to unfold stories progressively, holding attention through complexity.
Channel the success of network analyses in "The Tipping Point" by Malcolm Gladwell - where mapped connections predicted viral spreads. Yours could map the next big shift.
Structuring Success: Insider Hacks
Add whimsy with emoji nodes for informal pitches - "? Synergy Central." Leverage Magic Move for fluid transitions between views. Ensure inclusivity with descriptive alts: "Org chart showing reporting lines in marketing team."
Link up: Acquire the Structure Relationship Keynote Charts template immediately and architect presentations that build bridges, not barriers.
Frequently Asked Questions
What types of relationships does this template best visualize?
Hierarchies, peer networks, process flows - anything with connective tissue, from supply chains to social graphs.
Are the charts responsive to data changes?
Yes, linked elements update dynamically when you refresh source values.
Can it integrate with external tools like Lucidchart?
Import SVGs seamlessly, or export for round-tripping edits.
How many customization presets are included?
Five themes out-of-box, expandable via color rules for infinite variety.
Is it optimized for large-scale structures?
Handles 100+ nodes without lag, thanks to vector efficiency.
Does it support collaborative editing?
Fully, via Keynote's share features for real-time team input.