Dark Infographic Mastery: Business Keynote Charts


Step into the shadows where data doesn't whisper - it roars. Our Infographic: Business Stories Archive Dark Keynote Charts template is your secret weapon for presentations that linger long after the lights dim. Tailored for the modern boardroom, this 15-slide collection harnesses a sleek dark theme to make stats pop against midnight backdrops, perfect for late-night strategy sessions or high-stakes investor meets. If you're in business development, crafting narratives around market disruptions or growth hacks, this is your canvas to paint compelling stories without the fluff.
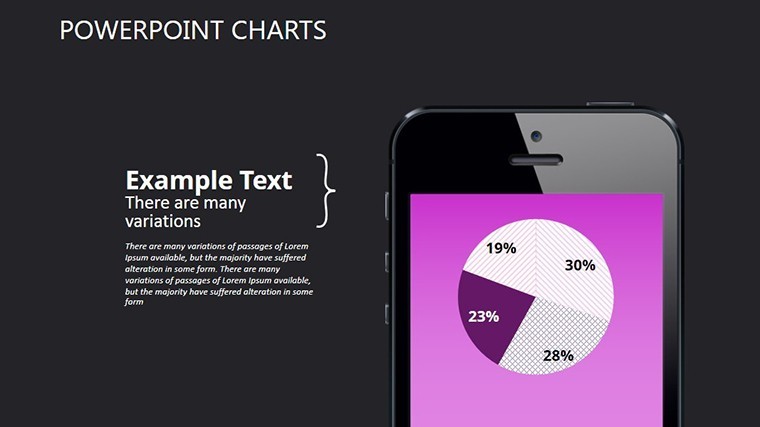
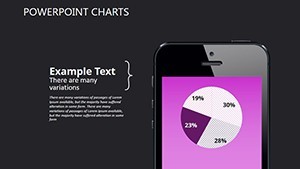
Why dark? Because in a sea of bland light-mode slides, contrast is king. Drawing from design psychology - think how Netflix's black interfaces keep you hooked - this template amplifies focus on your insights, reducing eye strain during marathon reviews. We've packed it with original infographics: flowcharts unraveling supply chains, pie charts dissecting revenue streams, and arrow-driven process maps for agile workflows. Compatible with Keynote, it's a nod to pros who demand precision, much like how McKinsey consultants visualize client transformations.
Delving into the Dark Side: Standout Features
At its heart, this template thrives on versatility. Fifteen widescreen slides, each a blank slate for your data drama. The dark palette isn't gimmicky - it's strategic, with luminous accents in gold or neon for emphasis, ensuring accessibility per WCAG standards.
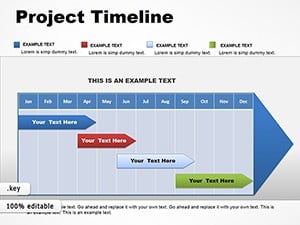
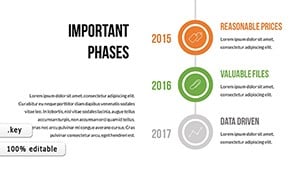
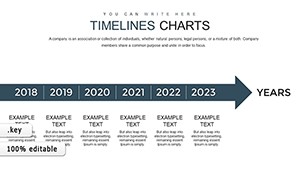
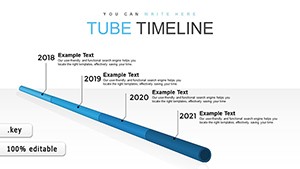
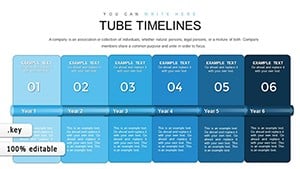
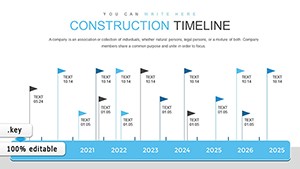
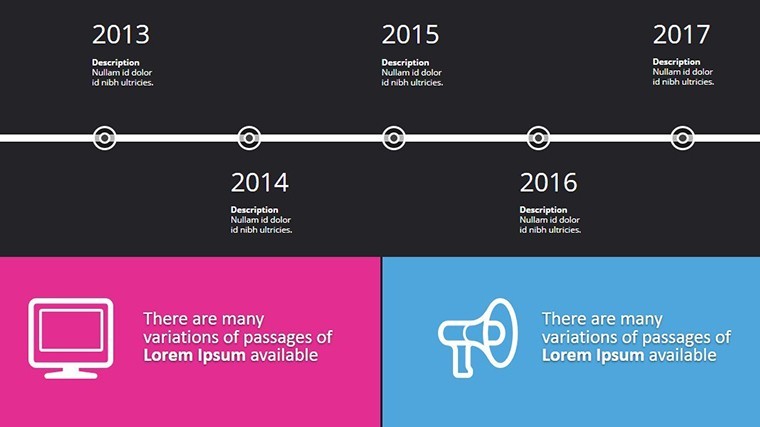
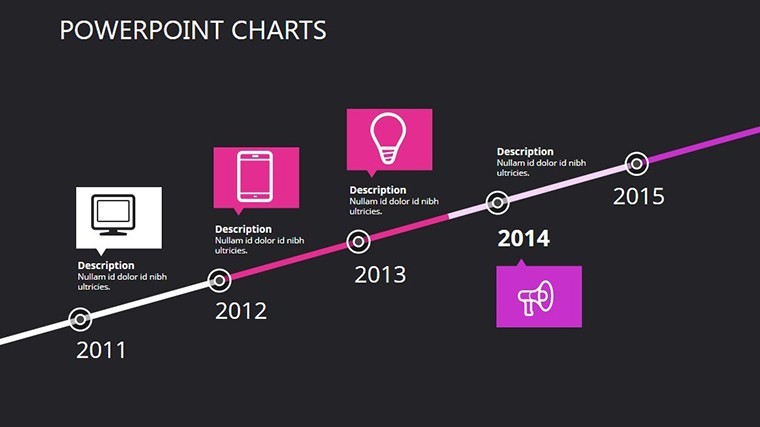
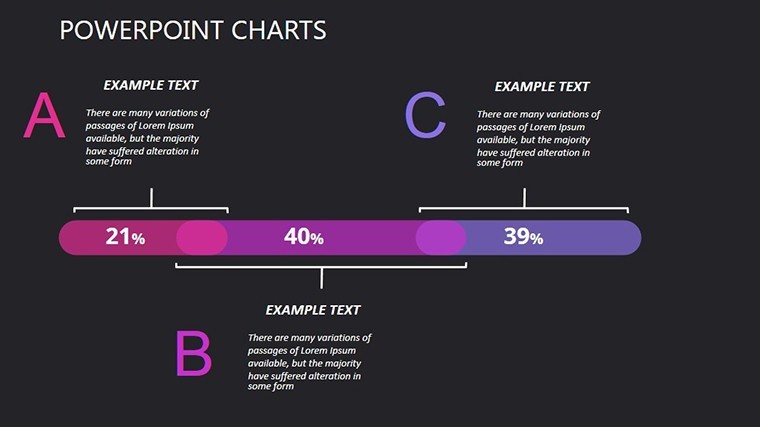
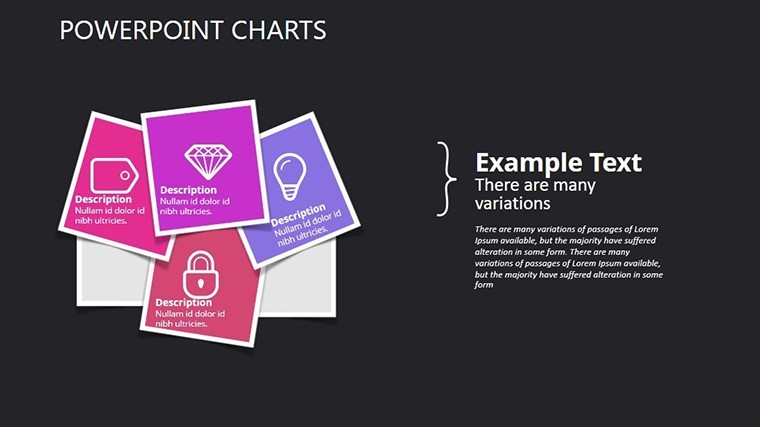
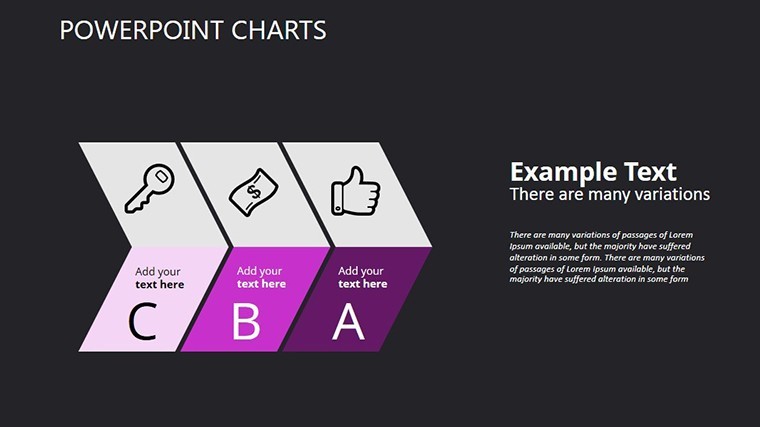
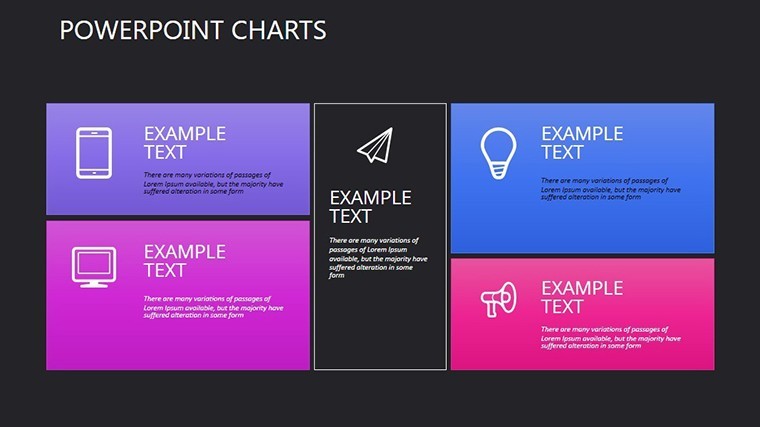
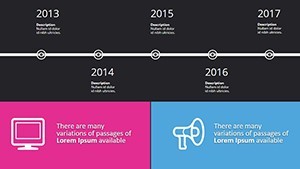
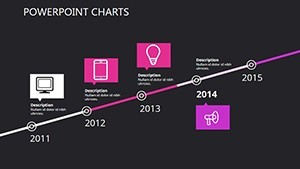
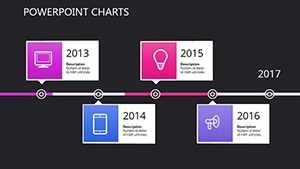
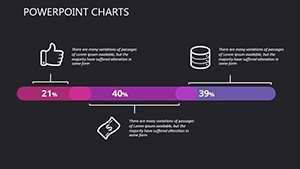
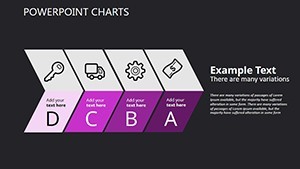
- Creative Infographics Galore: From radial diagrams for competitive landscapes to layered timelines for fiscal quarters, each slide is pre-built but infinitely tweakable.
- Attention-Grabbing Elements: Animated transitions (subtle fades, not fireworks) guide eyes through complexity, turning quarterly reports into edge-of-seat tales.
- Keynote Optimized: Native .key files with drag-and-drop editing; export to video for social teasers or PDF for archival bliss.
Customization is effortless: Recolor via theme switcher to align with your corporate identity, or swap fonts for that Helvetica-to-Futura pivot. High-res assets mean no quality drop on 4K displays, ideal for virtual pitches via Zoom.
Design Hacks for Maximum Impact
- Layer Information Smartly: Use opacity on overlays to reveal data progressively, mimicking a detective's reveal in a thriller.
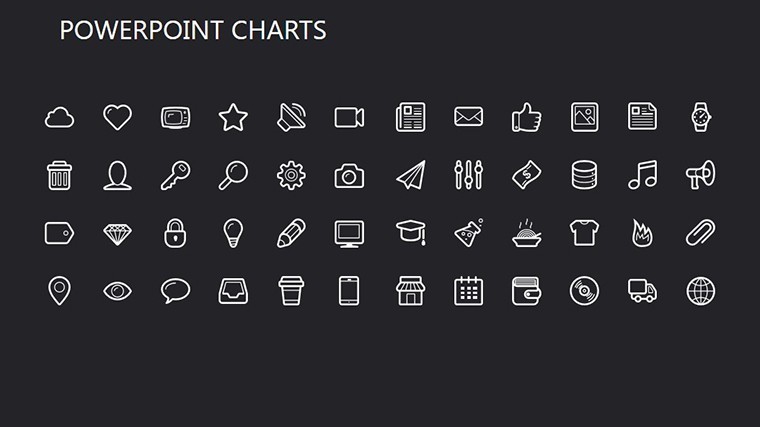
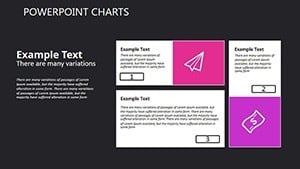
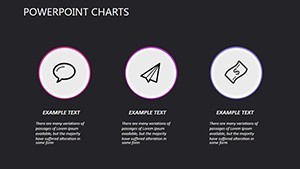
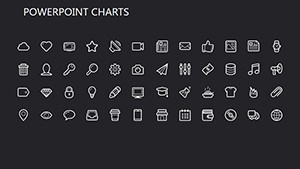
- Incorporate Icons Thoughtfully: Our 40+ business-themed pack (suits, charts, lightbulbs) adds metaphor without clutter.
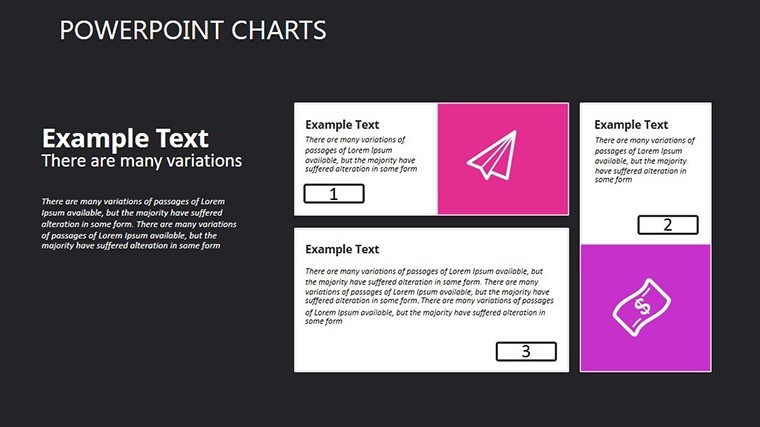
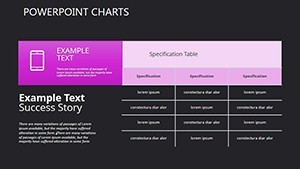
- Balance Text and Void: Embrace negative space - the dark background's gift - for breathing room in dense datasets.
Business Scenarios Where Darkness Shines Bright
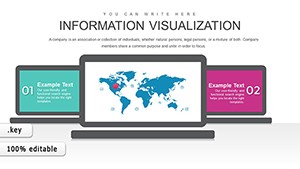
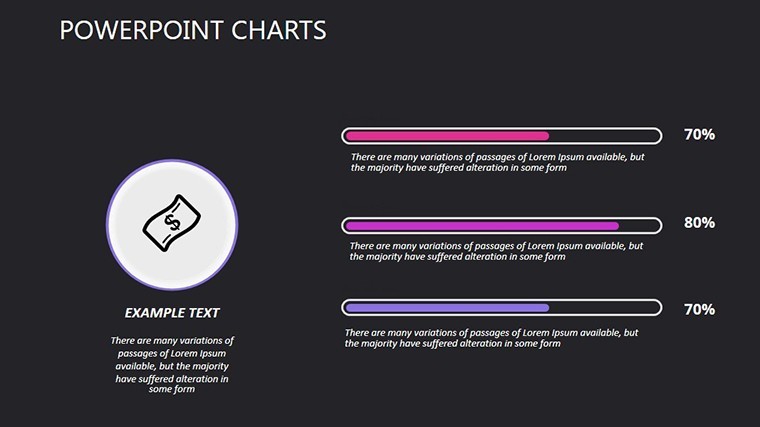
Envision a C-suite debrief: Your dark-themed infographic unpacks ESG metrics, with glowing bars highlighting carbon reduction wins - echoing Deloitte's sustainability decks that sway stakeholders. Or in sales, animate a customer journey map to show conversion funnels, converting skeptics to signers.
For startups, it's pitch perfection: Slides tracing bootstrapped growth against VC benchmarks, infused with real grit from Y Combinator alumni stories. Educators in MBA programs love it for case studies - dissecting Enron's fall via shadowy flowcharts that underscore ethical pitfalls. Unlike generic templates that fade into white noise, ours leverages contrast for memorability, backed by studies showing 65% better retention with high-contrast visuals.
Integration? Seamless. Pull data from Google Sheets, auto-populate charts, then refine in Keynote. One user, a fintech analyst, slashed prep time from days to hours, landing a key client by making arcane algorithms feel like blockbuster plots.
Craving that cinematic edge? Secure your Dark Business Infographics template today and let your data dance in the dark. Check out related timelines or arrows for expanded arsenals.
The Expertise Behind the Eclipse
Crafted by ex-Google designers versed in data storytelling, this template exudes authority - aligned with APA citation styles for academic twists or ISO visuals for global corps. Trust in its reliability: Lifetime updates, no hidden fees, just tools that empower.
Why wait for your next meeting to underwhelm? Illuminate the obscure - download now and script your business saga in shadows that steal the show.
Frequently Asked Questions
How does the dark theme enhance business presentations?
It boosts contrast for better readability and focus, ideal for low-light environments or digital screens, making data stand out dramatically.
Are the infographics fully customizable?
Yes - edit shapes, colors, and animations via Keynote's intuitive tools, with no loss in quality.
Can this work for non-business uses?
Definitely; adapt for creative storytelling, like podcast episode arcs or event recaps.
What's included beyond slides?
A bonus icon library and quick-start guide for seamless onboarding.
Export options?
Effortless to PDF, video, or images - perfect for multi-channel sharing.
Theme compatibility?
Works standalone or layered over your master slides for brand harmony.