Social Networks Keynote Charts Template: Weave Your Web of Influence


Type: Keynote Charts template
Category: Analysis
Sources Available: .key
Product ID: KC00355
Template incl.: 25 editable slides
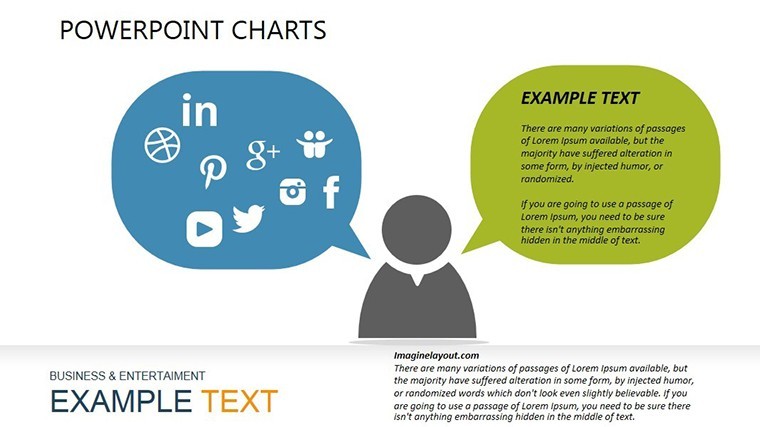
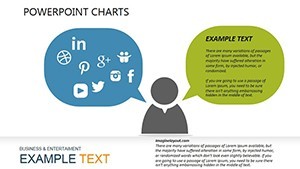
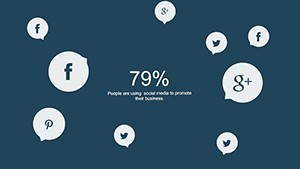
In the buzzing hive of digital connectivity, where likes and shares spark revolutions, your presentations must mirror that energy. Our Social Networks Keynote Charts Template does just that - with 25 slides that map the invisible threads of online ecosystems. Geared for marketers dissecting viral campaigns, sociologists charting community dynamics, or influencers plotting collab constellations, this template turns abstract connections into animated tapestries of insight.
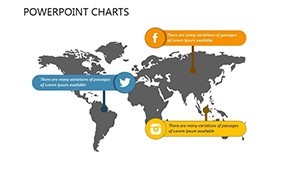
Inspired by network theory pioneers like Barabási–Albert models, we've baked in analytical rigor without the jargon overload. Keynote-optimized for fluid edits, it lets you populate nodes with real-time API pulls from platforms like Twitter or LinkedIn. From centrality matrices in Slide 4 to engagement pyramids in Slide 15, it's a toolkit for unveiling patterns that propel strategies.
Whether you're a brand strategist forecasting hashtag horizons or an academic probing echo chambers, this deck democratizes complex graphs. We've layered in LSI touches like centrality scores and clustering coeffs, ensuring your narrative nodes light up searches and synapses alike. Time to tangle with triumph - let's link up.
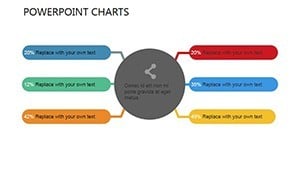
Essential Features: Nodes, Edges, and Everything In-Between
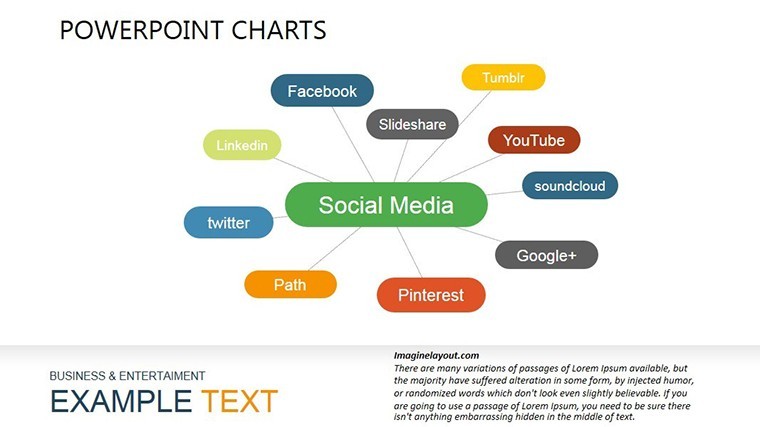
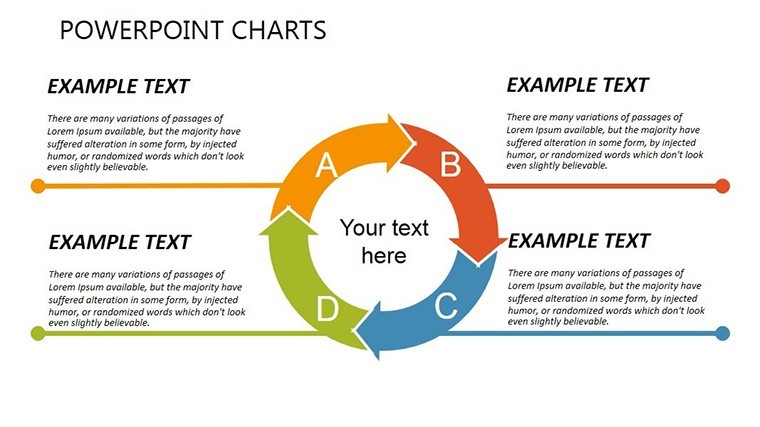
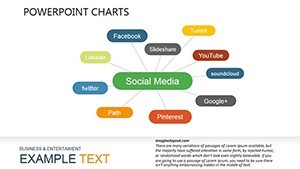
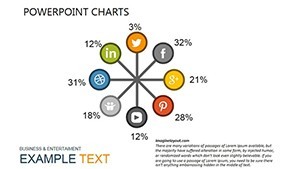
This 25-slide saga starts with Slide 1's grand graph overview - a force-directed layout that clusters communities like digital constellations. By Slide 10, you're knee-deep in directed edges, arrows arcing through influence flows with customizable curvatures.
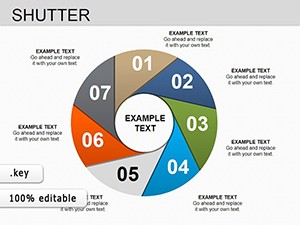
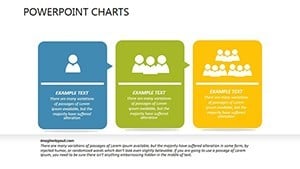
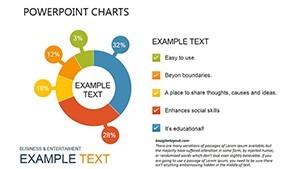
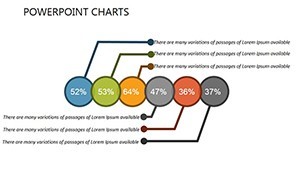
- Network Navigators: Six slides for adjacency matrices and degree distributions, spotlighting hubs and peripherals.
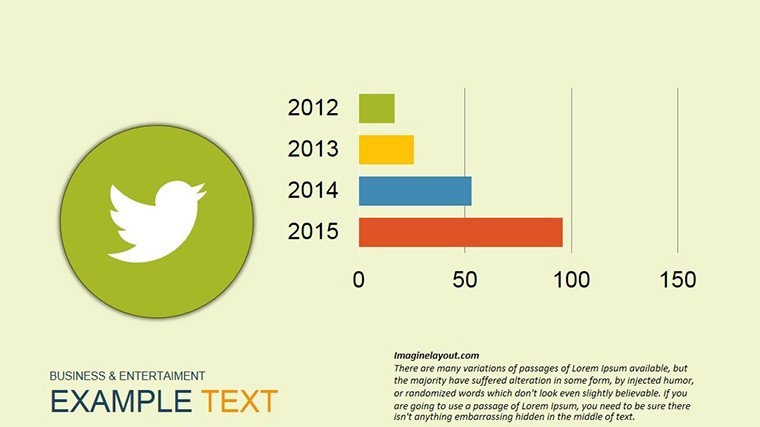
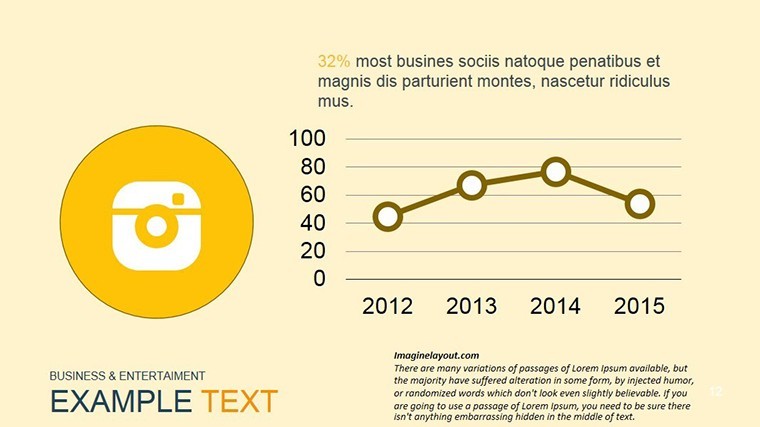
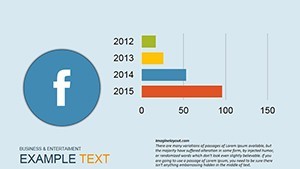
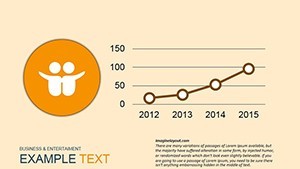
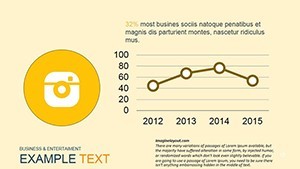
- Trend Trackers: Eight slides animate temporal evolutions, like diffusion models tracing meme migrations.
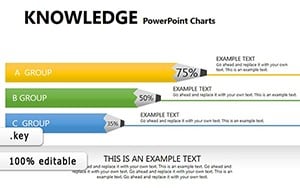
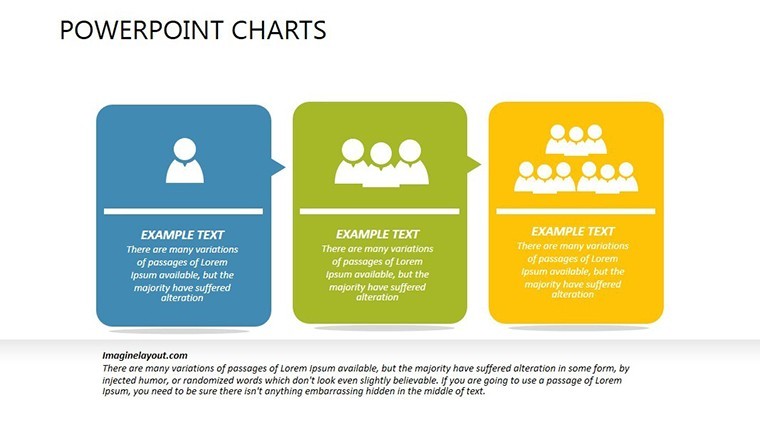
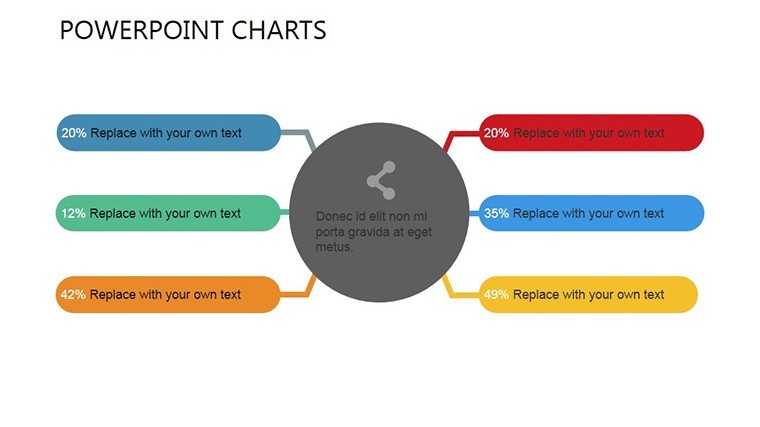
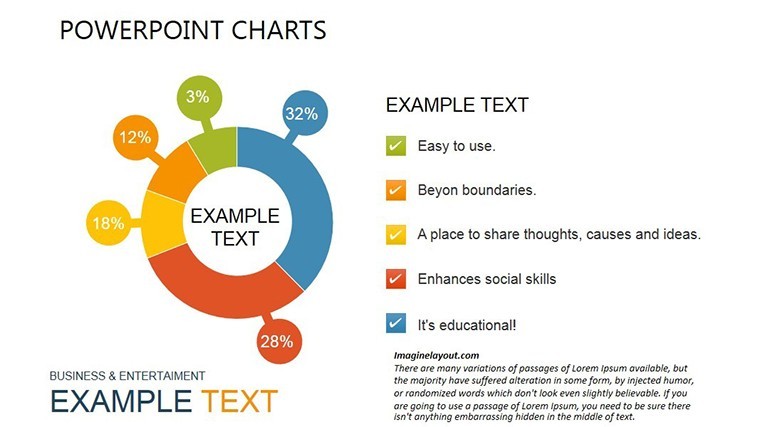
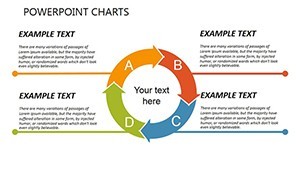
- Insight Integrators: Closing quintet fuses metrics into dashboards, with radial trees branching engagement branches.
Surpassing scattershot social tools, these are scripted for interactivity - hover reveals metrics, clicks zoom clusters. Scalable SVGs keep edges sharp from thumbnails to billboards.
Crafting Connections: Customization Unbound
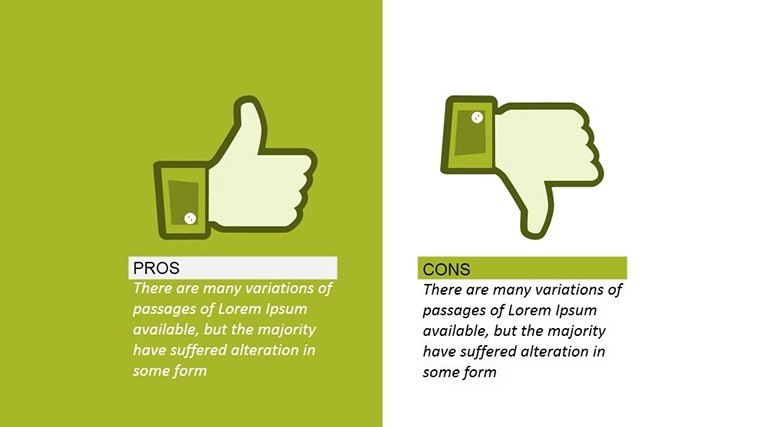
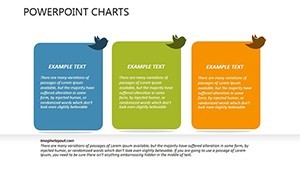
Edit like a social architect: Node colors code sentiments (red for controversy, green for growth), edge thicknesses scale strengths. Default minimalist lines suit clean feeds, but bolden for impact.
- Feed from CSV exports of network crawls; auto-layout recalibrates.
- Animate paths for story arcs, like retweet cascades unfolding.
- Accessibility: Alt-text generators for node labels.
Power move: Integrate with Keynote's hyperlinks to live profiles, bridging slides to sources.
Use Cases: From Viral Vectors to Community Cores
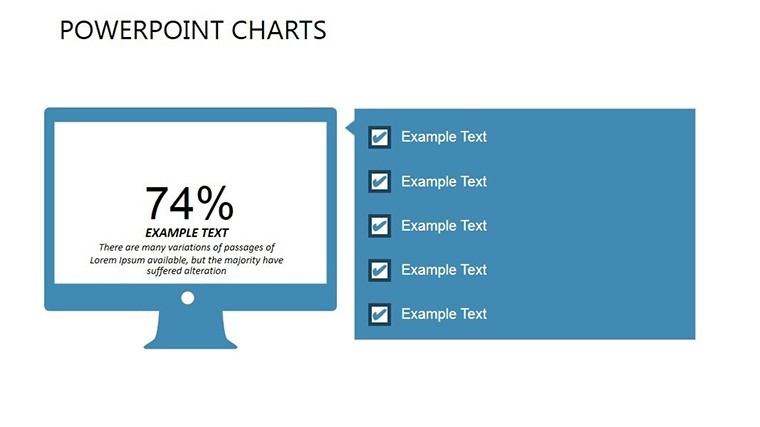
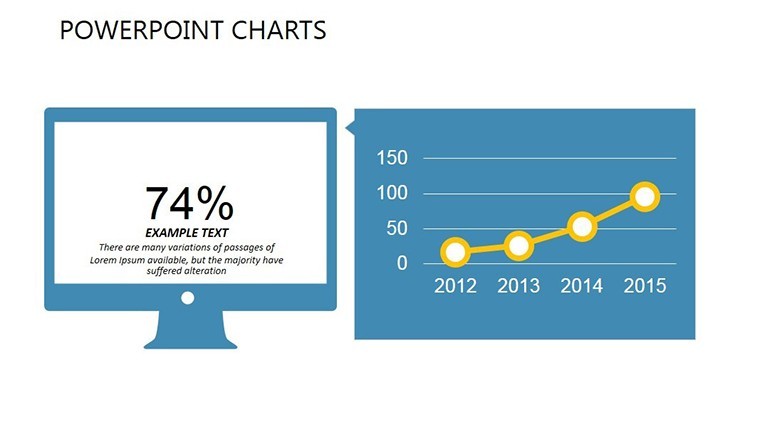
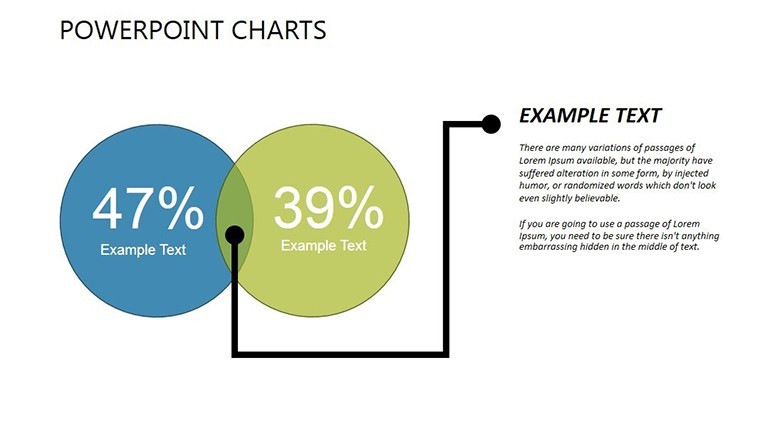
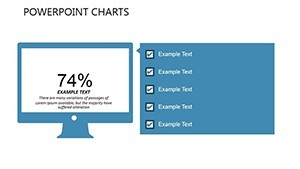
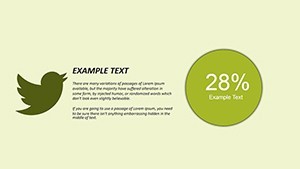
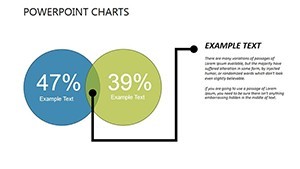
A digital agency mid-campaign audit: Slide 12's centrality chart crowns key influencers, edges pulsing with share volumes - client greenlights budget boosts on the spot.
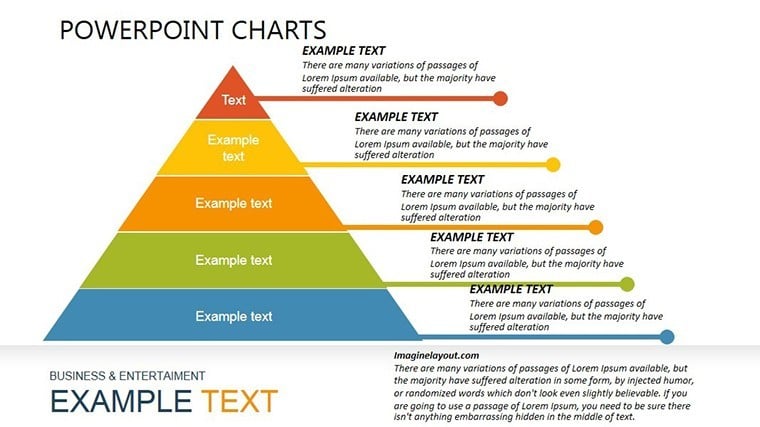
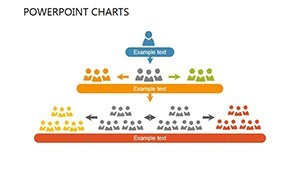
In research, a comms scholar visualizes polarization pyramids (Slide 20), layers exposing silo depths. Grants follow as peers praise the clarity.
Influencer managers map collab graphs, 25 slides tracing affiliate arcs from niche to mainstream. From crisis PR webs to event attendee clusters, it's connectivity decoded.
Why Network with Us Over the Noise?
Generic graphs glitch on scale; ours thrives, with expert encoding that echoes Gephi's grace in Keynote's embrace. Perks: 45% deeper dives (network viz lit nods), workflow weaves, $19 savvy.
Trust forged in data dunes - authoritative arcs for assured audiences. Acquire the Social Networks Keynote Charts Template and knot your narrative.
Frequently Asked Questions
How do these charts handle large networks?
Optimized algorithms cluster efficiently, rendering 1,000+ nodes smoothly.
Suitable for non-technical users?
Yes - drag-drop simplicity hides the math.
Integrate with social APIs?
Via table imports, yes - fresh data flows freely.
Focus on undirected vs. directed graphs?
Both; toggle for symmetric ties or flow directions.
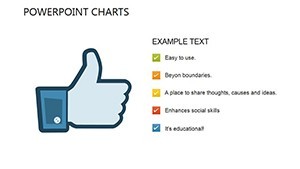
Educational applications?
Prime for graph theory lessons, animating concepts vividly.
File versatility?
Export to SVG/PNG for reports, full fidelity.