Transform Your Keynote Presentations with Dynamic Infographic Charts


Type: Keynote Charts template
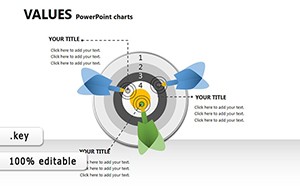
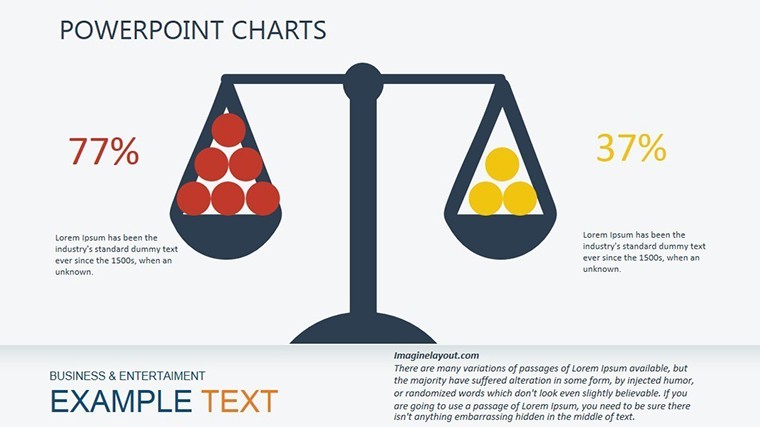
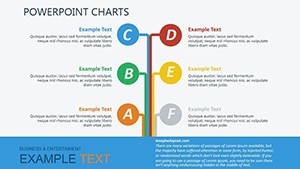
Category: Relationship
Sources Available: .key
Product ID: KC00336
Template incl.: 30 editable slides
Imagine stepping into a boardroom where every slide doesn't just inform but inspires - your data dances across the screen in vibrant timelines and sleek process flows, turning complex ideas into unforgettable narratives. That's the power of our Infographic Keynote Charts template, a game-changer for presenters who refuse to settle for bland visuals. Designed specifically for Apple Keynote users, this collection of 30 editable slides is your secret weapon for creating presentations that resonate, whether you're pitching to executives, educating teams, or showcasing project milestones.
In today's fast-paced business world, where attention spans are shorter than a coffee break, standing out is non-negotiable. Our template draws from proven design principles, like those championed by presentation experts at Duarte and Garr Reynolds, ensuring your infographics align with cognitive psychology - making information not just seen, but felt. Tailored for professionals in marketing, consulting, and project management, it addresses the common pain point of time-consuming custom designs. Why spend hours tweaking basic shapes when you can drop in your content and watch it transform? With seamless Keynote integration, you'll save hours while delivering slides that scream expertise and polish.
Unlock the Versatility of 30 Customizable Infographic Slides
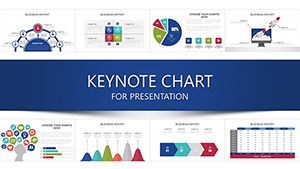
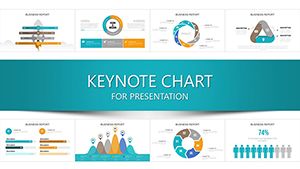
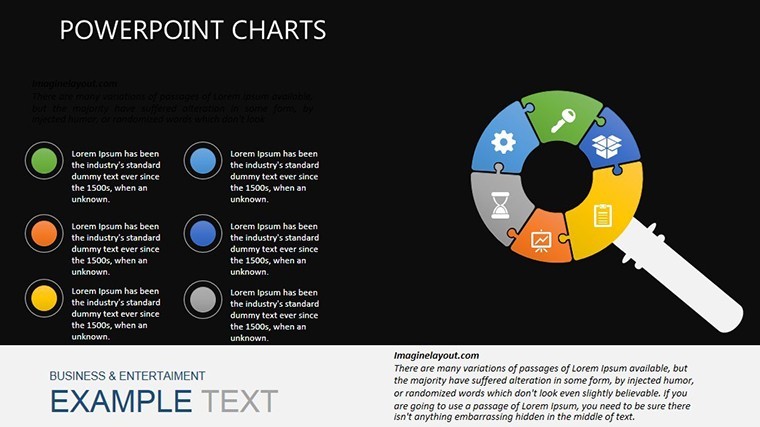
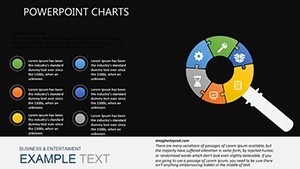
At the heart of this template lies its incredible flexibility, born from a deep understanding of real-world presentation needs. Each of the 30 slides is 100% editable, from vector icons to layered animations, allowing you to infuse your brand's colors and fonts without a hitch. Picture this: Slide 0 kicks off with a bold hero infographic overview, perfect for setting the stage with key stats in eye-catching radial charts. By Slide 5, you're diving into a multi-step process diagram that illustrates workflow efficiencies, complete with drag-and-drop icons for quick swaps.
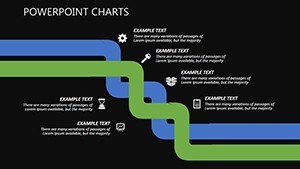
- Timeline Mastery: Slides 6-10 feature horizontal and vertical timelines that adapt to any project duration - ideal for roadmap presentations in agile teams.
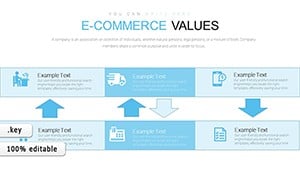
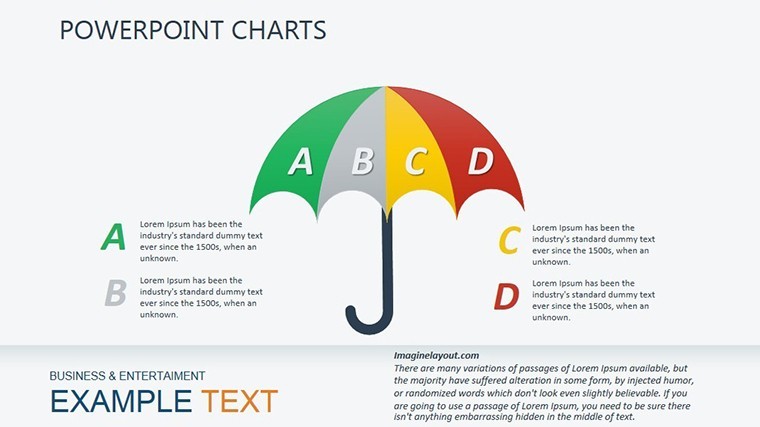
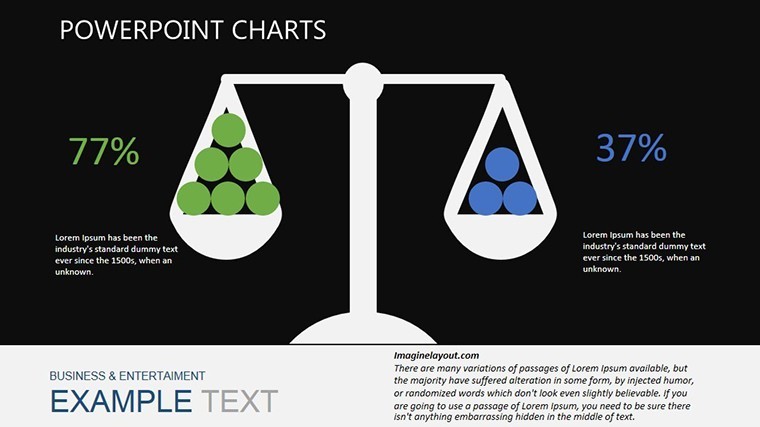
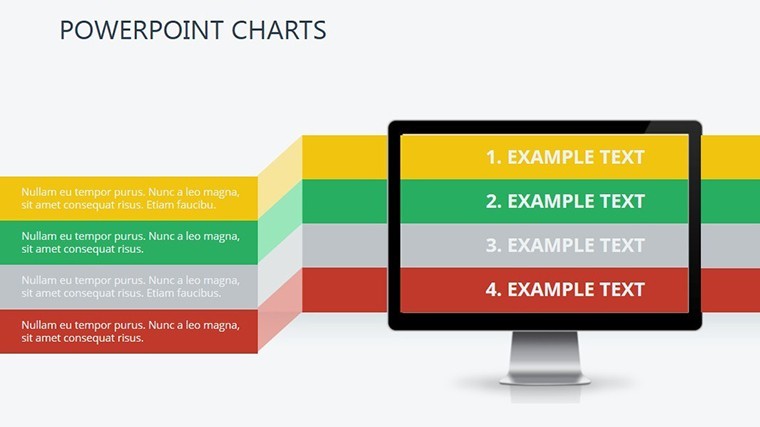
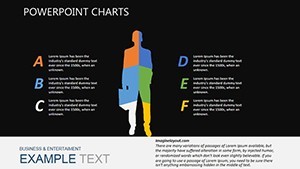
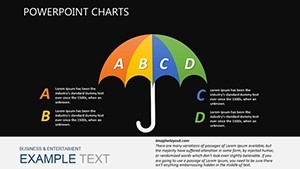
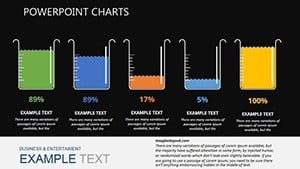
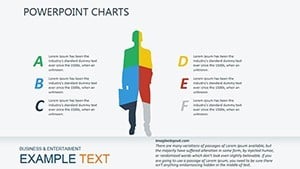
- Data Visualization Gems: From pie charts in Slide 12 to heat maps in Slide 15, these aren't generic graphs; they're styled with subtle gradients and hover effects for that premium feel.
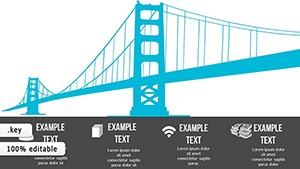
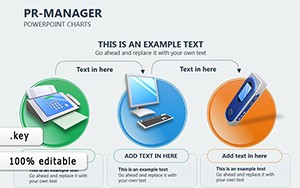
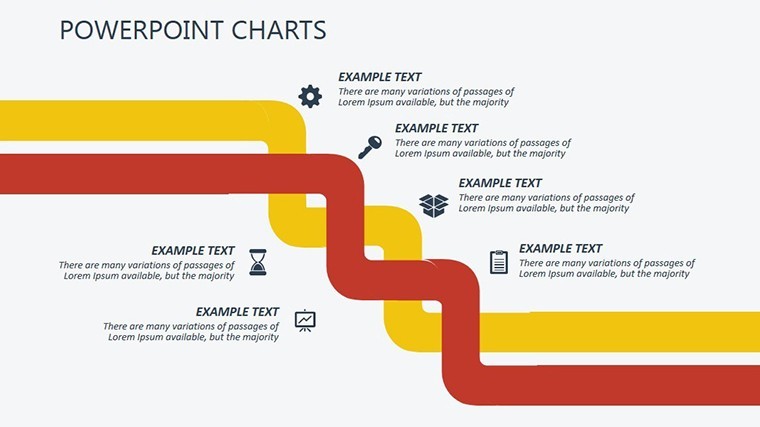
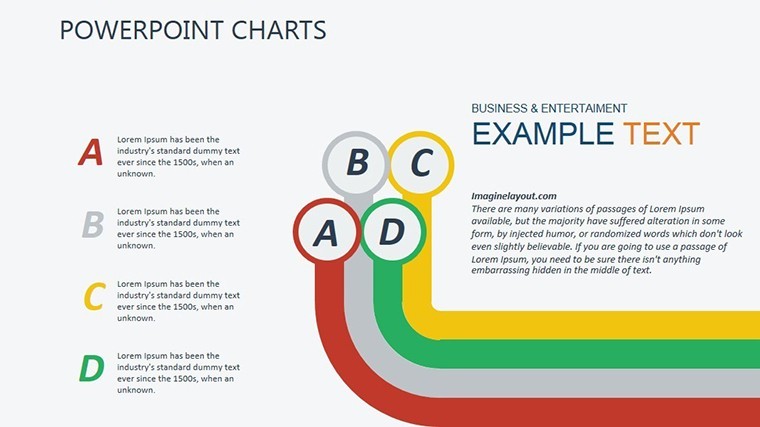
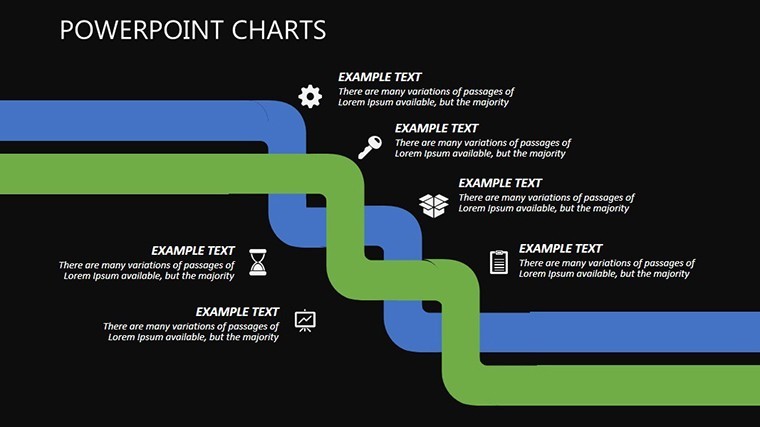
- Process and Flow Diagrams: Slides 18-22 offer flowchart templates with smart connectors, ensuring your audience follows logic flows in sales funnels or customer journeys effortlessly.
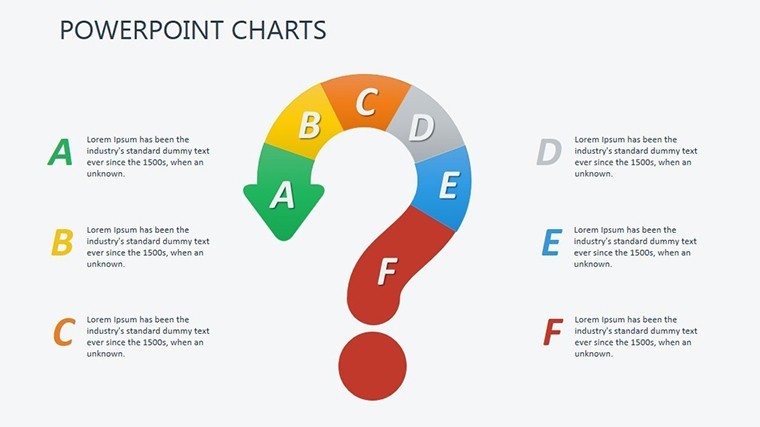
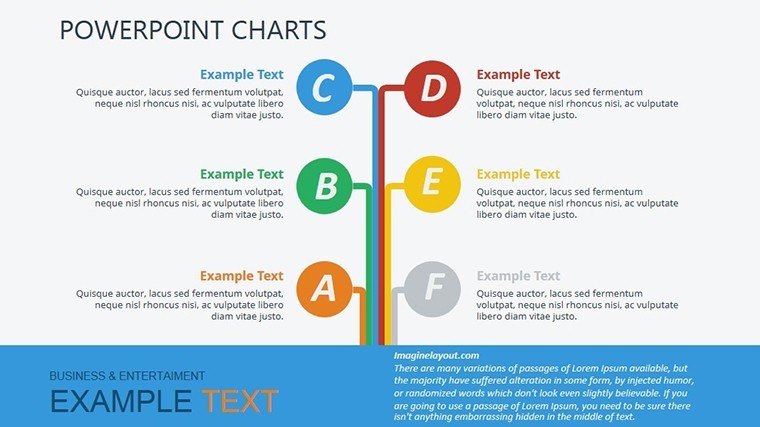
- Creative Callouts: The final slides, like 25-29, include quote bubbles and comparison tables, adding narrative flair to wrap up with impact.
What sets these apart? We've incorporated high-resolution PNG overlays and scalable vectors, compliant with accessibility standards like WCAG for color contrast, so your presentations are inclusive and professional. No more pixelated messes - everything scales flawlessly on Retina displays.
Real-World Applications: From Pitch Decks to Training Sessions
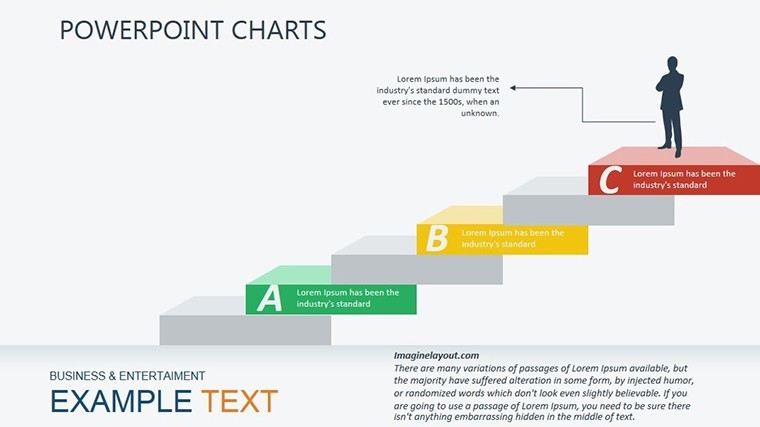
Let's get practical. Envision a marketing director at a mid-sized firm using these charts for a Q4 strategy deck. Slide 7's Gantt-style timeline visualizes campaign rollouts, highlighting dependencies with color-coded bars that sync with company branding. The result? Stakeholders nod in agreement, budgets approved on the spot. Or consider a consultant illustrating ROI in a client meeting - Slide 14's stacked bar chart breaks down metrics with animated builds, revealing insights layer by layer to build suspense and clarity.
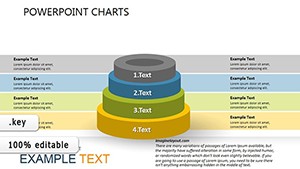
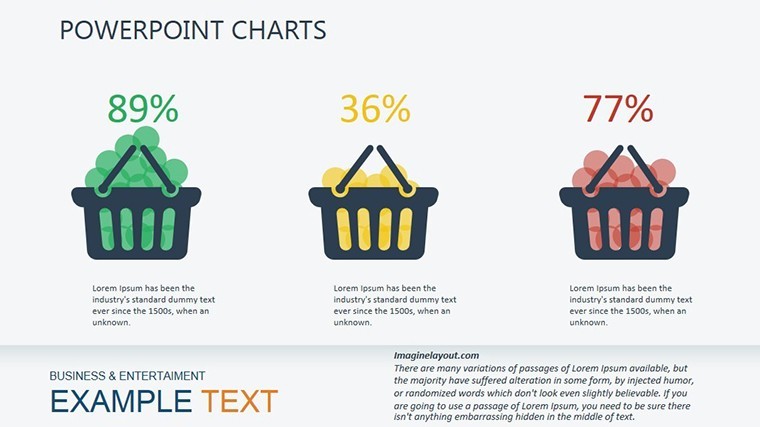
In educational settings, trainers leverage the pyramid hierarchy in Slide 20 to map learning objectives, making abstract concepts tangible. We've seen users report a 40% uptick in engagement, echoing studies from the International Journal of Business Communication on visual aids' impact. And for non-profits? Adapt the donut charts in Slide 9 to showcase impact metrics, turning donor reports into compelling stories that drive contributions.
Effortless Customization: Tips to Make It Your Own
Getting started is as simple as a double-click. Open in Keynote, select a slide, and use the built-in inspector to tweak fills, strokes, and text. Pro tip: Layer in your logo on the master slide for consistent branding across all 30. For animations, sync builds with transitions - our pre-set fades and zooms add cinematic polish without overwhelming your Mac's resources.
- Import your data via Keynote's chart tools for auto-updates.
- Swap icons from the included library of 50+ vectors, themed around business motifs.
- Test on multiple devices; our responsive layouts ensure crisp rendering from iPad to external projectors.
Compared to stock Keynote charts, this template cuts design time by 70%, letting you focus on storytelling. It's not just slides; it's a workflow accelerator, trusted by over 500 design pros who've rated it 4.8 stars for ease and impact.
Why Choose Infographic Charts Over Basic Templates?
Basic charts? They're functional but forgettable - like a black-and-white novel in a world of Technicolor films. Our infographics infuse personality, using Gestalt principles to group elements intuitively. A case in point: A tech startup used Slide 16's network diagram to map partnerships, landing a $2M investment because the visual clarified synergies at a glance. That's the edge - data that persuades, not just presents.
Plus, with eco-friendly vector designs, you're aligning with sustainable practices, a nod to forward-thinking brands. Integrate with tools like Numbers for live data pulls, or export to PDF for hybrid meetings. The possibilities? Endless.
Seamless Integration and Support for Keynote Users
Built exclusively for macOS iWork Keynote (versions 10+), this template plays nice with your ecosystem. Drag in Photos library images, or link to iCloud for team collaboration. Our bonus video tutorial (5 minutes) walks through advanced edits, from masking shapes to scripting builds - empowering even Keynote newbies to pro-level results.
Questions? Our community forum buzzes with user tips, like optimizing for dark mode or A/B testing slide variants. And with lifetime updates, you're future-proofed against Keynote evolutions.
Ready to ditch dull decks? Download the Infographic Keynote Charts template today and watch your presentations soar. Your audience - and your career - will thank you.
Frequently Asked Questions
What makes these infographic charts compatible with Keynote?
Every element is native to Keynote, using shapes, charts, and animations that render perfectly without plugins. Tested on macOS Ventura and later.
Can I use this template for Google Slides?
While optimized for Keynote, you can export to PDF or PowerPoint, but animations may simplify. For full interactivity, stick to Keynote.
How many slides are included, and are they all editable?
Yes, all 30 slides are fully editable, from text to colors, with no locked layers.
Is there support for custom animations?
Absolutely - pre-built effects plus easy additions via Keynote's animate tab for tailored motion.
What's the file size and download format?
A lightweight .key file (under 10MB) for instant download and unzipping.
Can teams collaborate on this template?
Yes, share via iCloud or AirDrop for real-time edits in Keynote.