Human Needs Charts Template: Craft Relatable Keynote Stories


Type: Keynote Charts template
Category: Matrix
Sources Available: .key
Product ID: KC00321
Template incl.: 18 editable slides
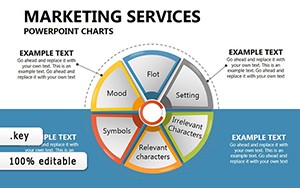
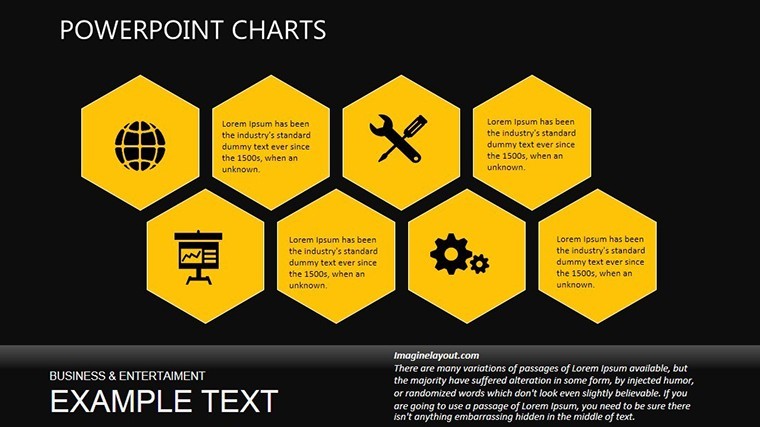
Human motivations drive decisions, and our Human Needs Charts Template for Keynote captures this essence across 18 editable slides. From basic necessities to self-actualization, it visualizes hierarchies like Maslow's with bar graphs, pie charts, and lines, making abstract ideas accessible. Ideal for HR pros, marketers, and educators, it turns data into empathetic narratives - think fundraising pitches highlighting community impacts or strategy meetings mapping employee fulfillment. With a balanced palette and modern design, it ensures your presentations resonate, fostering connections and driving action.
Core Features Enhancing Your Storytelling
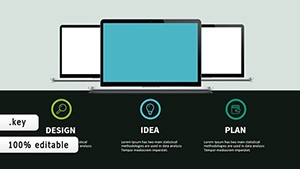
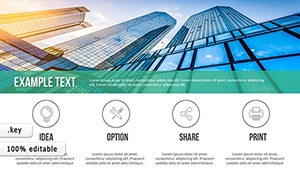
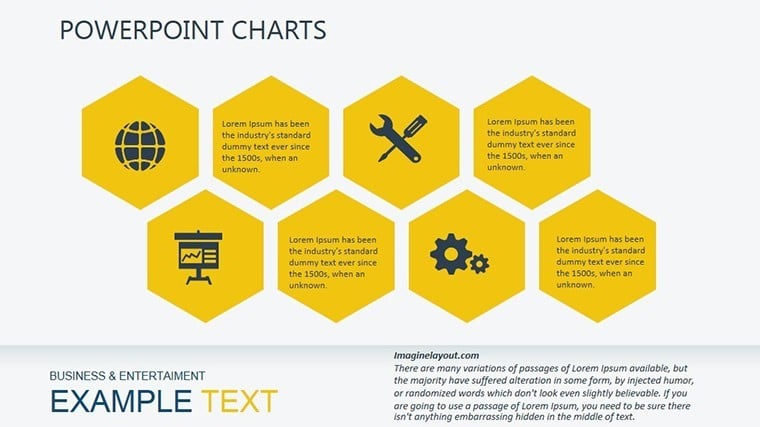
The template's adaptability shines: Tailor charts for industries, from corporate to academia, with drag-and-drop ease. Diverse visuals include pies for need distributions, bars for comparisons, and lines for progressions, all with subtle animations for engagement. The harmonious colors - soft pastels for calm, accents for emphasis - keep focus on content. User-friendly for novices, it integrates photos, videos, or audio, like embedding motivational clips. Keynote compatibility guarantees seamless use on Macs or iPads.
Comprehensive Slide Overview
Unpack the 18 slides: Essentials start with pyramid charts for need hierarchies, customizable for cultural variations. Mid-slides offer matrices for cross-analysis, like needs vs. satisfaction levels. Advanced ones feature dashboards combining multiple graphs, e.g., line trends over time with pie insets. In a non-profit context, use bars to show program effects on basic needs; in business, pies for market segmentation by desires.
- Hierarchy Visuals: Layered charts for foundational to aspirational needs.
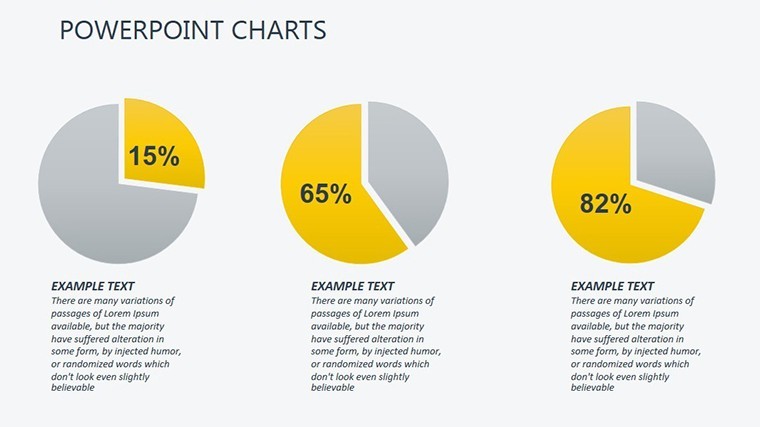
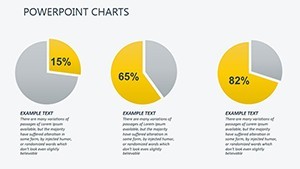
- Data Breakdowns: Pies and bars for quantitative insights.
- Trend Trackers: Lines for evolutionary views on human behavior.
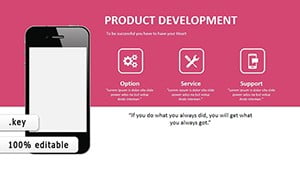
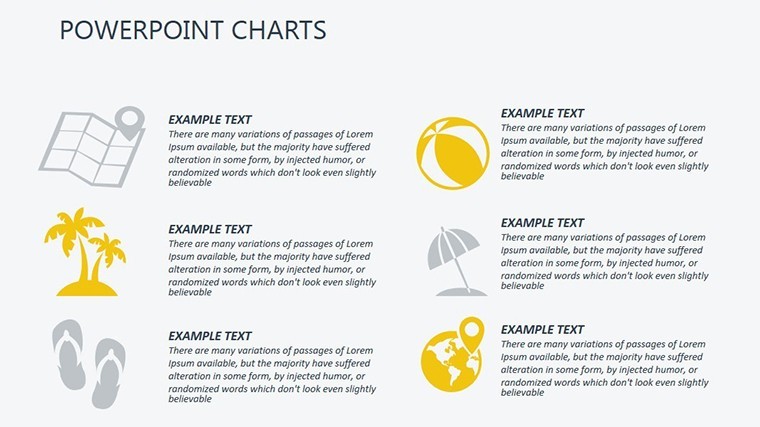
- Story Elements: Narrative frames with icons for emotional appeal.
Rooted in psychological frameworks from Abraham Maslow and modern adaptations, it aligns with APA guidelines for accurate representation.
Diverse Use Cases for Impactful Delivery
Implement effectively: In HR, visualize employee engagement surveys with matrices, informing retention strategies. Academics use for psychology lectures, animating needs progression to aid learning. Fundraisers employ pies to depict impact, swaying donors emotionally. Corporate strategists map consumer needs in marketing plans, boosting campaign relevance. Versatile for remote setups, with slides sharing via iCloud for collaborative edits.
Easy Customization Steps
- Import into Keynote.
- Input data, such as survey results.
- Refine visuals: Adjust scales or colors.
- Animate: Fade-ins for need reveals.
- Enrich: Add real-life images.
- Present: Export for various formats.
This intuitive process empowers quick, professional results.
Edges Over Default Tools
Surpasses basics with thematic cohesion and storytelling aids, reducing overload. Animations are refined for psychological pacing. With 39 ratings, it's trusted; draws from UX principles like those from Don Norman for intuitive design.
Integrate with matrix expansions, backed by our psychology-informed support.
Tips for Human-Centered Visuals
Optimize: Use empathetic colors - warm for belonging needs. Simplify labels for clarity. Ensure inclusivity with diverse icons. Build narratives: Sequence charts as journeys. Refine via audience tests.
Ignite understanding - acquire this template and humanize your data.
Frequently Asked Questions
How versatile are the charts for different needs models?
Highly adaptable - modify for Maslow, ERG, or custom frameworks.
Beginner-friendly?
Yes, drag-and-drop with guides included.
Commercial licensing?
Full rights post-purchase for any use.
Multimedia integration?
Seamless addition of videos or images.
Future-proof updates?
Free notifications for enhancements.