 Click to zoom
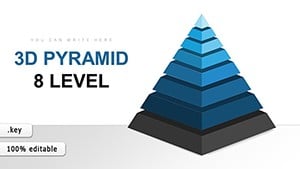
Pyramids and Figures Keynote Charts: Master Infographic Design
| Format | .pptx |
| Slides | 24 unique layouts |
| Aspect ratio | 16:9 |
| Compatibility | PowerPoint |
| Animated | No |
| Language | English |
| License | Commercial |
| File size | — |
| Version | v1.0 |
| Last updated | July 2023 |
What's inside
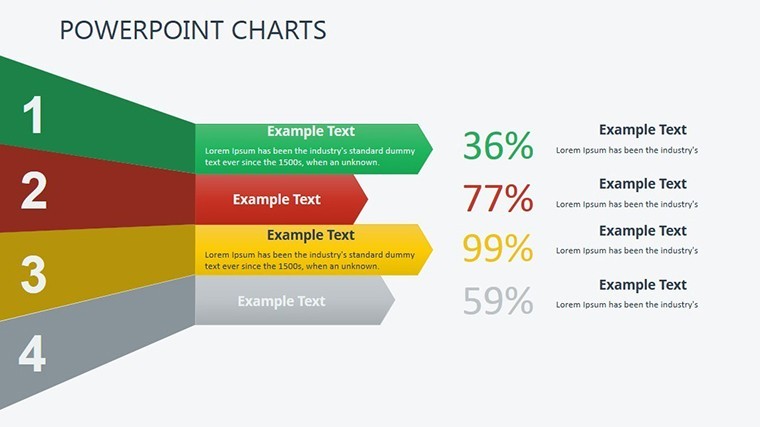
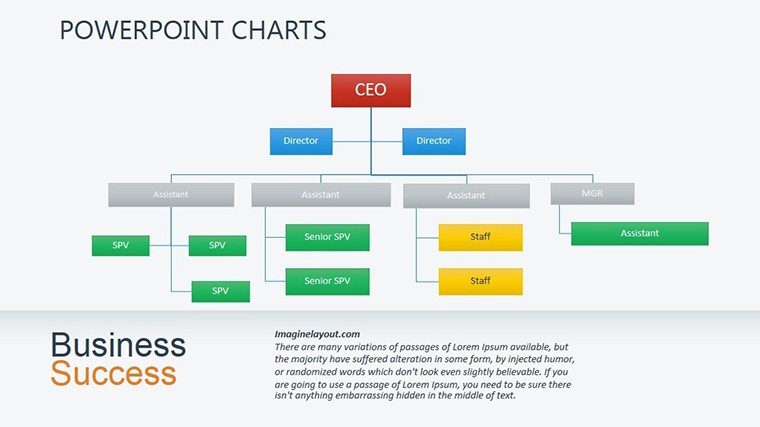
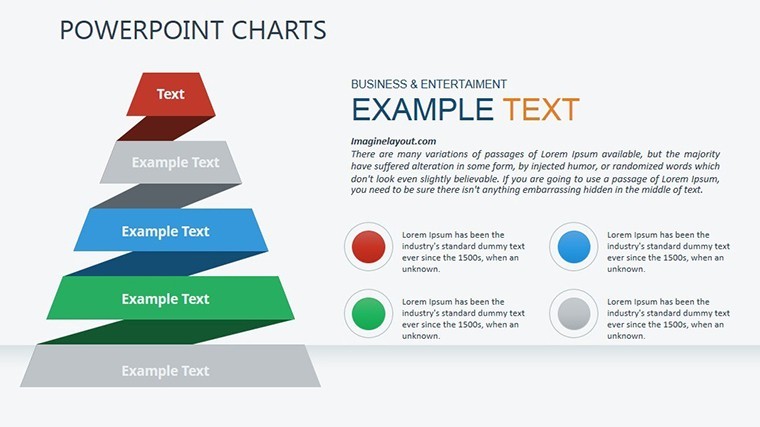
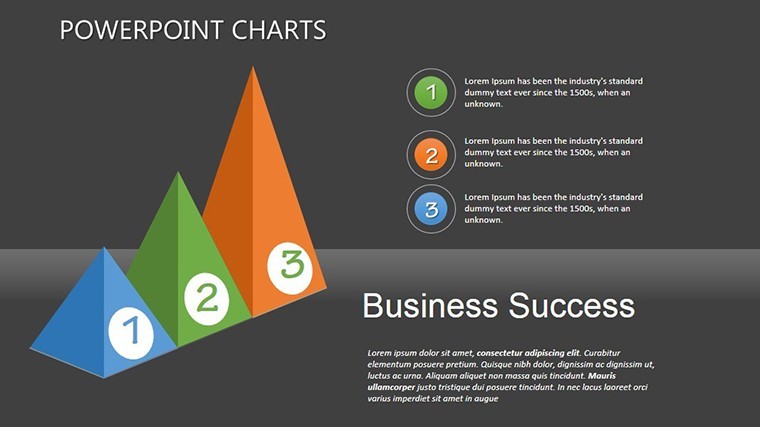
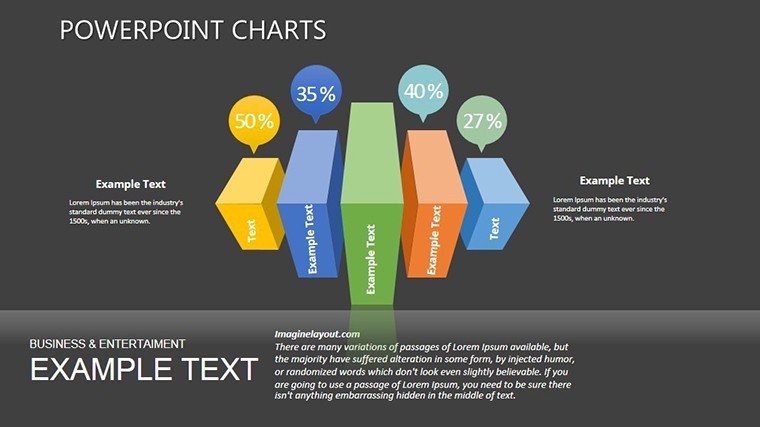
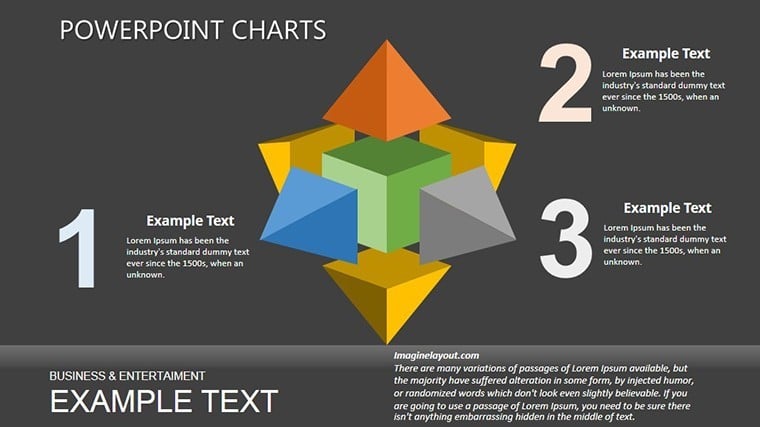
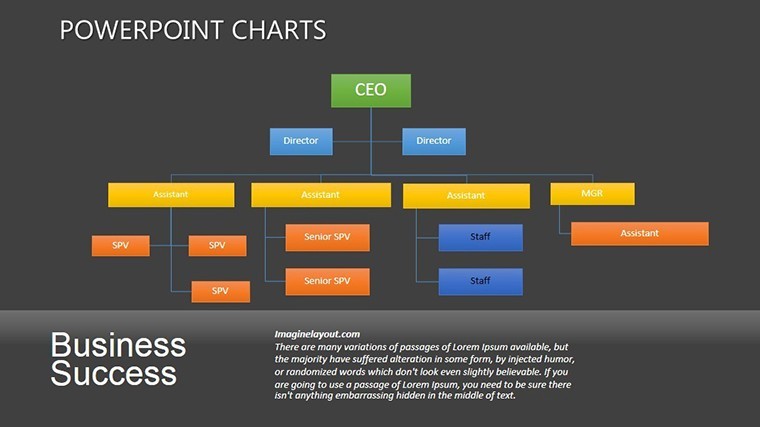
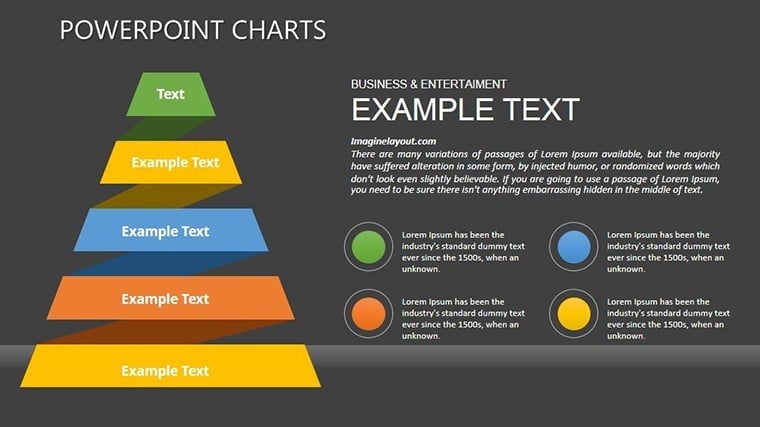
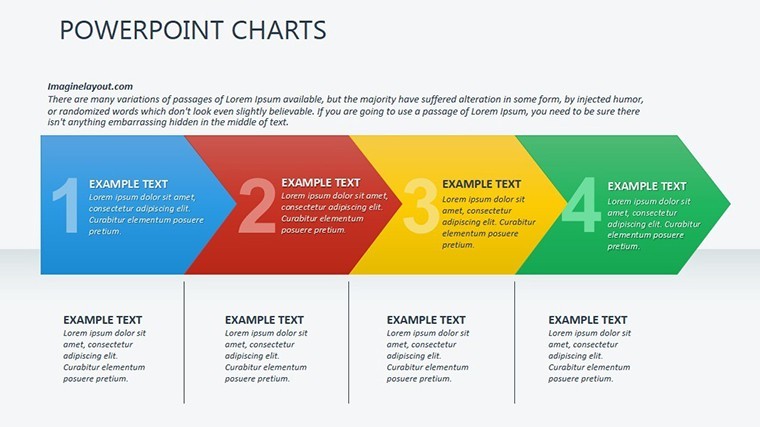
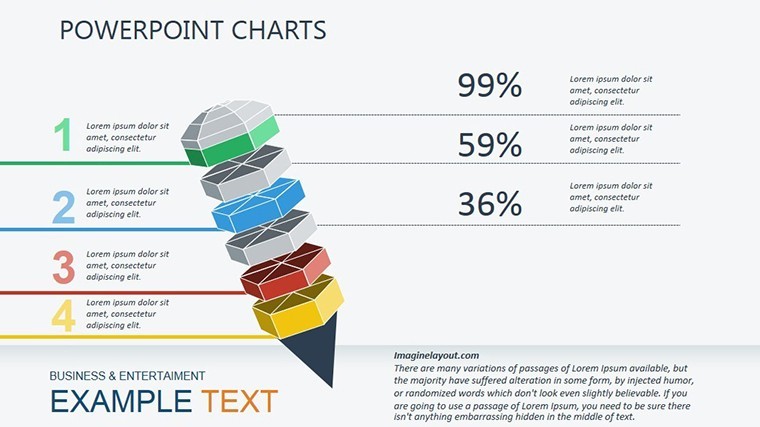
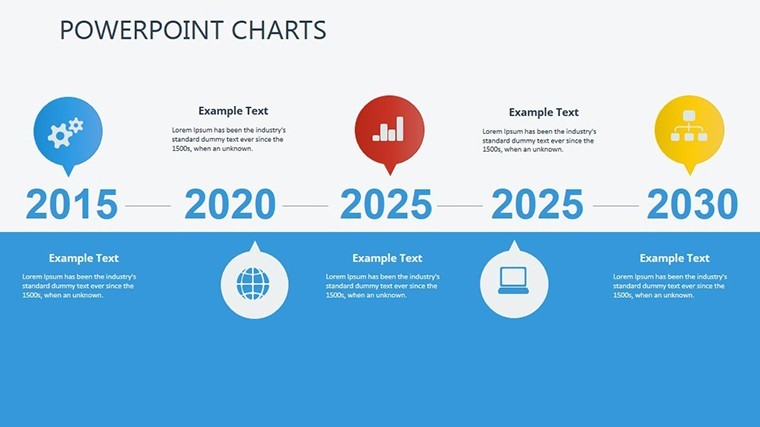
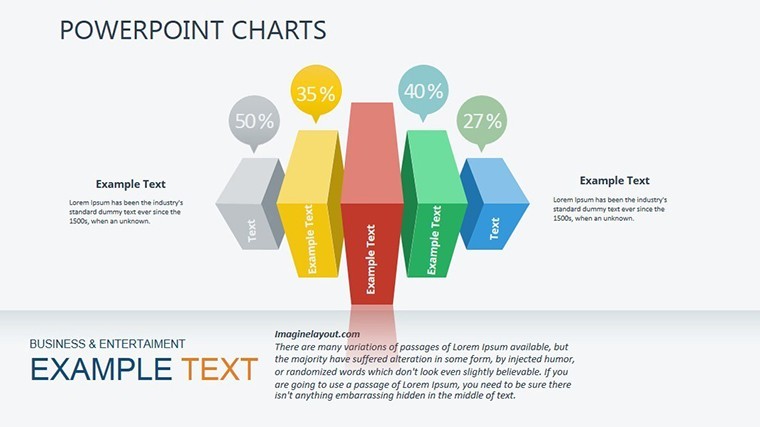
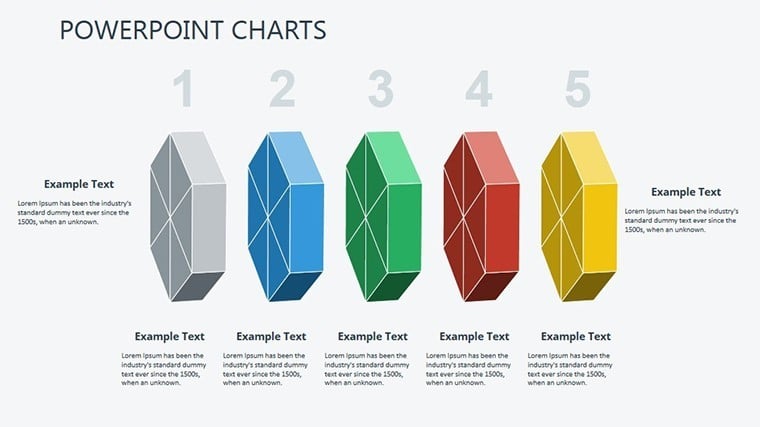
Hierarchical data demands visual hierarchy, and our Pyramids and Figures Keynote Charts Template delivers just that with 24 editable infographic slides. Perfect for illustrating organizational structures, process stages, or priority levels, this template transforms mundane data into pyramid-powered stories. Aimed at project managers, consultants, and educators, it simplifies complex concepts, like Maslow's needs or sales funnels, into digestible visuals. Visualize climbing the corporate ladder in a board meeting or breaking down ecosystem layers in a biology class - this tool amplifies your message, fostering better engagement and recall.
Standout Features for Dynamic Presentations
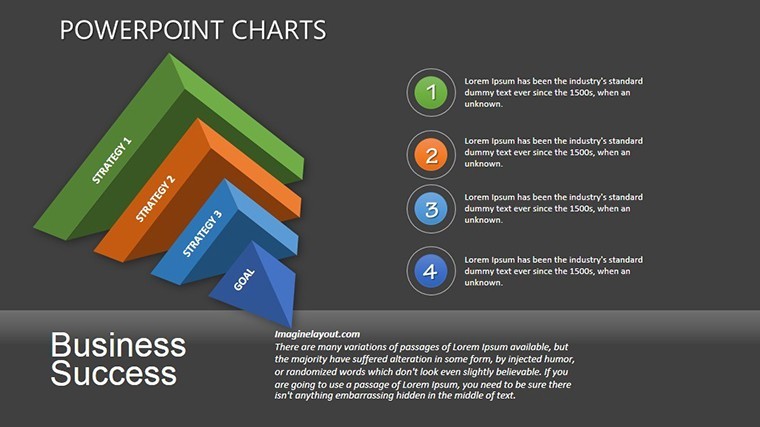
Crafted by design pros, the template offers extensive customization: Alter colors to evoke urgency in red pyramids or calm in blues. Fonts and sizes adjust fluidly, while 3D figures add depth for standout effects. With 24 slides, it includes animations like layer-by-layer builds, ideal for revealing insights progressively. Vector scalability maintains sharpness, and integration with media - photos of team hierarchies or videos of process demos - enriches content. Keynote-exclusive, it's optimized for Apple's ecosystem, ensuring smooth performance.
Slide-by-Slide Insights and Customizations
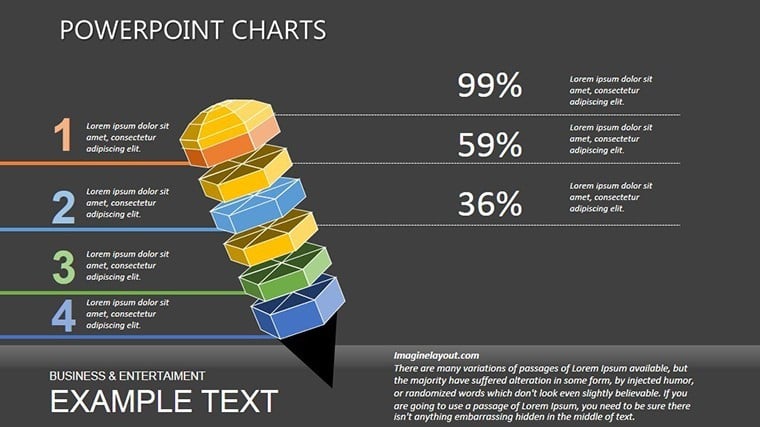
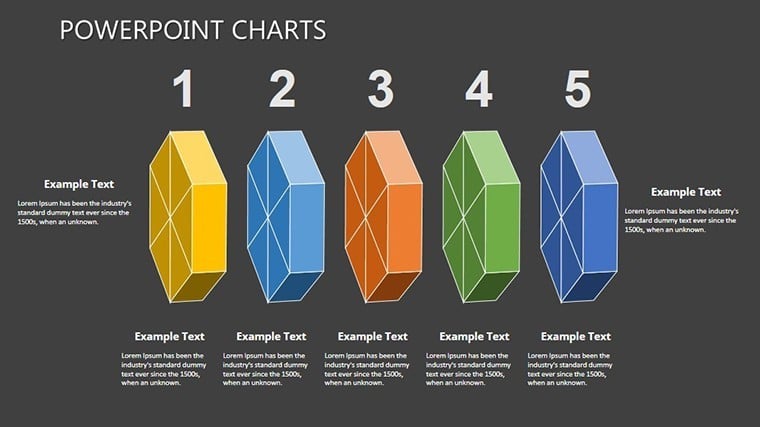
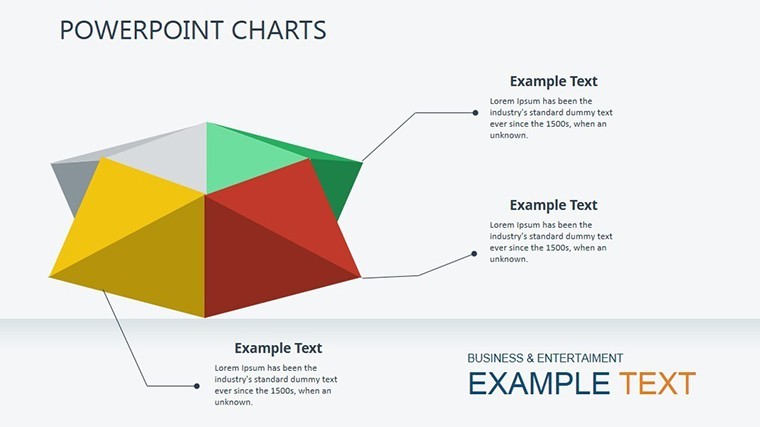
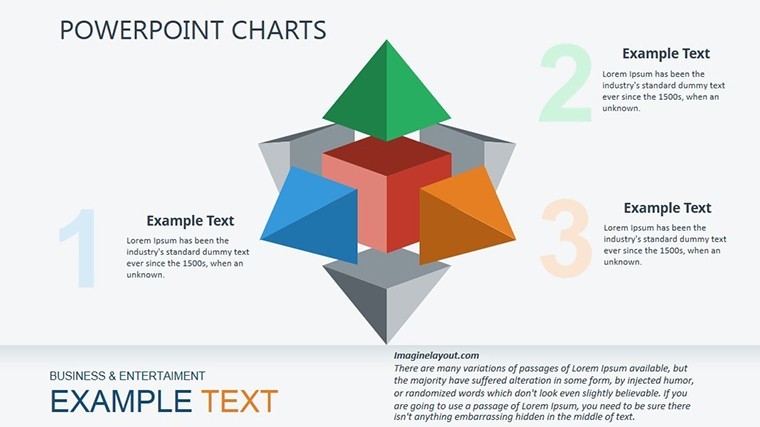
Explore the collection: Starter slides feature basic pyramids for foundational concepts, evolving to multi-level figures with embedded data labels. Use segmented pyramids for market share breakdowns, animating segments to pop. Figure-based slides include human silhouettes for demographic stats or geometric shapes for abstract ideas. For instance, in a strategy session, customize a pyramid to show SWOT layers, with tooltips for details. Advanced options like inverted pyramids challenge norms, perfect for disruptive innovation talks.
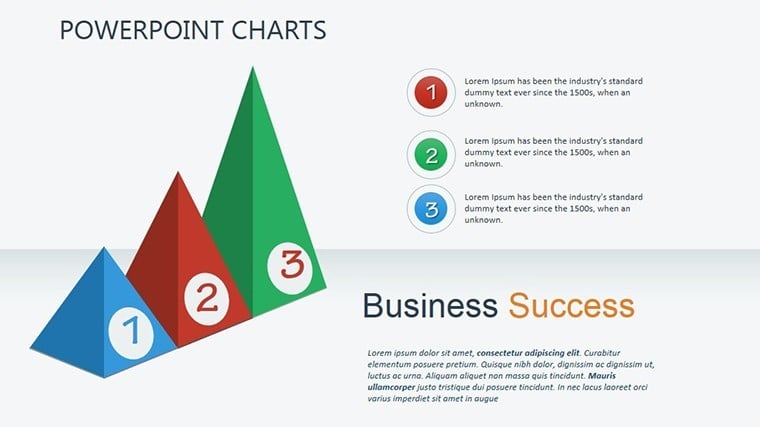
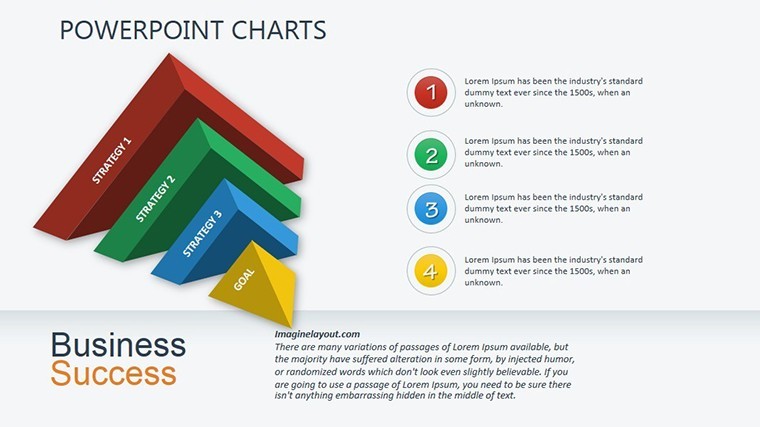
- Hierarchy Pyramids: Multi-tiered for org charts, editable for team expansions.
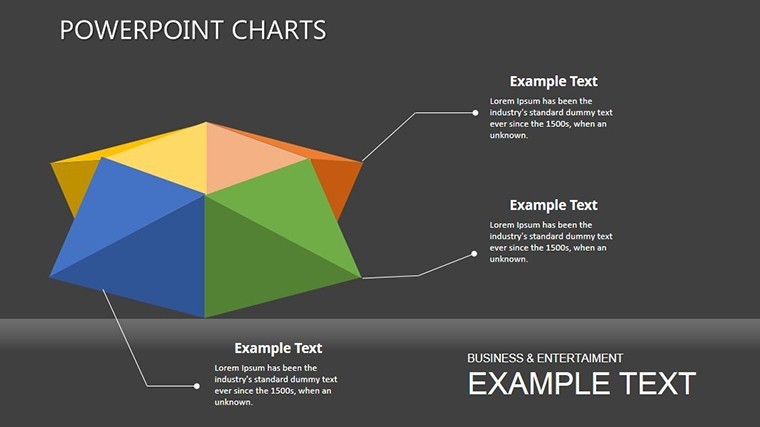
- Figure Infographics: Stylized icons for population data, with color gradients.
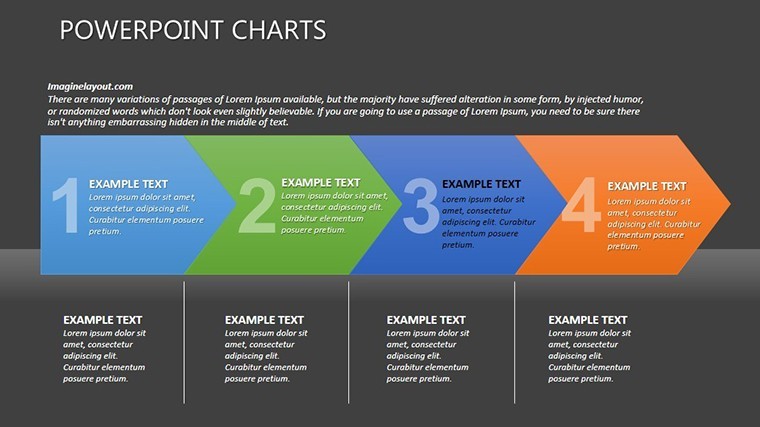
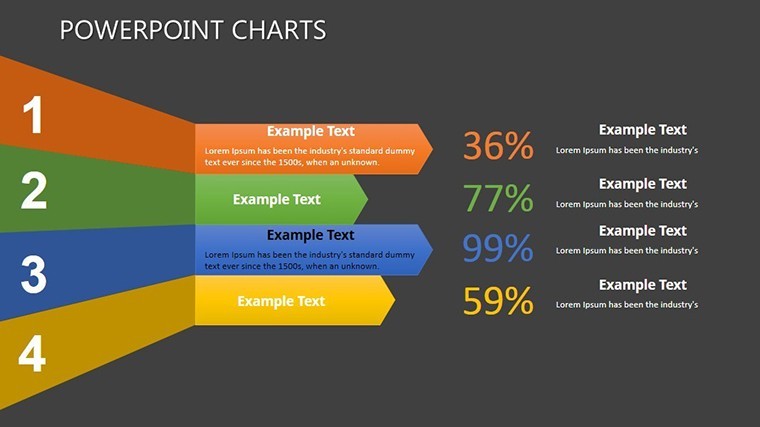
- Process Figures: Step pyramids for workflows, with arrow animations.
- Comparative Designs: Side pyramids for before-after scenarios.
Inspired by infographic gurus like David McCandless, these adhere to principles of visual simplicity, reducing cognitive load per Gestalt theory.
Versatile Applications in Professional Settings
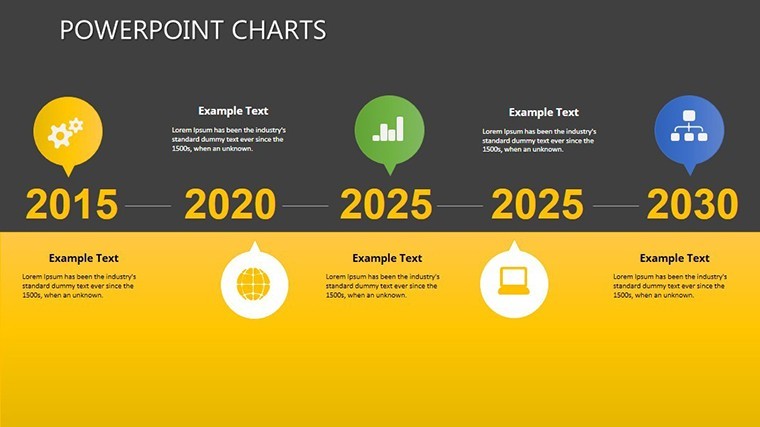
Harness for impact: A consultant uses pyramid slides to outline client strategies, leading to clearer action plans. Educators employ figures for historical timelines, like ancient civilizations' social structures, captivating students. In sales, funnel pyramids track leads to conversions, with data-linked updates for real-time pitches. Consultants adapt for workshops, inserting client logos for personalization. It's great for virtual conferences, with slides exporting flawlessly to shared drives.
Streamlined Customization Workflow
- Load the template in Keynote.
- Select and populate data fields with your metrics.
- Tweak visuals: Resize tiers or swap figures.
- Apply animations: Build from base up for emphasis.
- Add enhancements: Overlay images or links.
- Finalize and present: Test on projectors for fidelity.
This approach cuts design time, letting you focus on content delivery.
Superior to Built-In Keynote Options
Go beyond basics with themed 3D effects and pre-set palettes, unlike generic shapes. Animations offer more variety, like rotate reveals for figures. High ratings (4 stars from 1150 users) attest to its polish. Grounded in UX research from Nielsen Norman Group, it prioritizes user-friendly hierarchies.
Pair with pyramid extensions for expanded libraries, supported by our design experts.
Pro Design Tips for Infographics
Enhance: Balance symmetry in pyramids for aesthetic appeal. Use negative space wisely. Ensure color accessibility via tools like Contrast Checker. Narrate visually: Let figures tell stories without text overload. Iterate with A/B testing on audience groups.
Transform your infographics - secure this template and ascend to presentation excellence.
Frequently Asked Questions
How customizable are the pyramid levels?
Fully adjustable - add/remove tiers, change shapes, and update text effortlessly.
Does it support 3D rotations?
Yes, with built-in Keynote 3D tools for dynamic views.
Suitable for non-business uses?
Yes, great for education, non-profits, and personal projects.
Can I merge with other templates?
Easily, copy-paste slides between Keynote files.
What about high-res exports?
Supports PDF and image exports in full quality.
Good for
- Project roadmaps and sprint plans
- Product launch timelines
- Quarterly or annual review decks
- Company history and milestone summaries
Licence
reviews
Used this template for a team report presentation.
The line chart slides looked clean once I added my numbers.
Some pages felt repetitive after a while.
I appreciated the balanced spacing between elements.
FAQ
Will it work in Google Slides?
Are fonts embedded?
Can I use this for client work?
What's the refund policy?
Do you update the template after purchase?
Similar templates
See all Keynote Charts →


All 24 slides