Current Assets Charts Keynote Template: Optimize Financial Liquidity


Type: Keynote Charts template
Category: Cycle
Sources Available: .key
Product ID: KC00306
Template incl.: 25 editable slides
Financial health hinges on understanding how quickly assets can turn into cash, and our Current Assets Charts Keynote Template equips you to visualize this critical metric with precision. Featuring 25 editable slides, this tool is indispensable for accountants, CFOs, and business owners aiming to evaluate liquidity, repay short-term debts, and manage working capital effectively. By depicting current assets like cash, inventory, and receivables through intuitive charts, it simplifies complex assessments, allowing you to spot trends and make informed decisions. Vector elements ensure flawless scaling, while the cycle-focused designs highlight circulation dynamics. Drawing from standards like those in the Financial Accounting Standards Board (FASB), this template bridges theory and practice, helping you present data that drives strategic actions without the tedium of custom builds.
Unpacking Financial Visualization Mastery
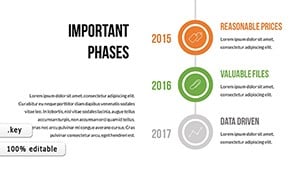
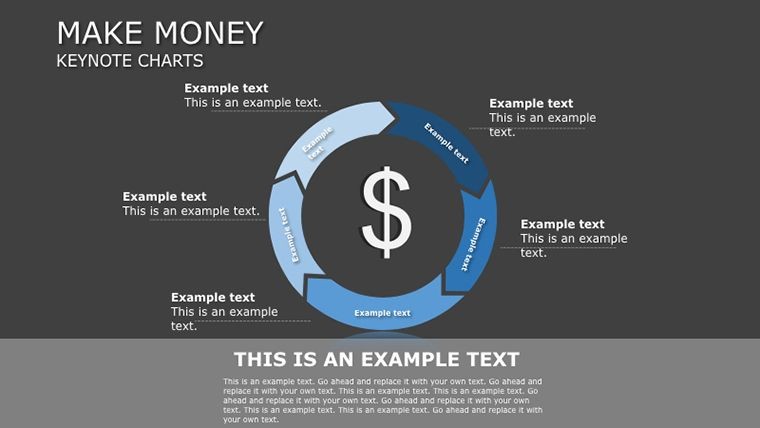
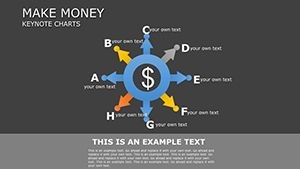
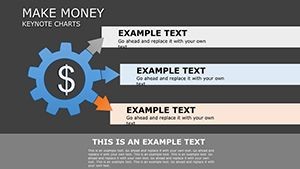
The template's slides are engineered for depth, with cycle diagrams on slide 6 illustrating asset conversions - from raw materials to cash inflows. Use rectangles for asset categories and arrows for transformation paths, customizing with your firm's data to reflect real-time liquidity ratios. This mirrors ratio analysis techniques from CFA Institute resources, where quick ratios (current assets minus inventory over liabilities) are pivotal.
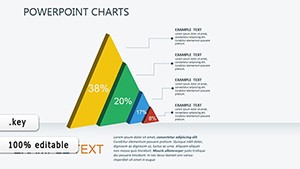
Expand to bar graphs on slide 11 for comparative liquidity across quarters, color-coding to flag thresholds - yellow for caution, red for urgent. A manufacturing enterprise, for example, leveraged similar charts to optimize inventory turnover, boosting cash flow by 22% as per Deloitte's working capital studies.
Core Features for Financial Precision
- Vector Flexibility: Stretch or alter symbols without quality degradation.
- 25 Slides Variety: Includes cycles, bars, pies for comprehensive asset views.
- Easy Edits: Modify directly in Keynote for swift updates.
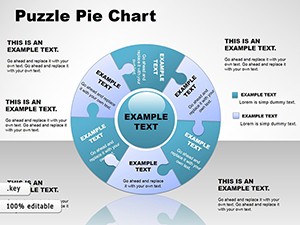
- Cycle Emphasis: Perfect for showing working capital loops.
- Illustration Library: Built-in shapes enhance visual storytelling.
Outperforms standard tools by offering pre-structured financial flows, minimizing setup time.
Applications and Step-by-Step Financial Use
For liquidity reviews, start with slide 1's overview pie: Allocate segments to asset types, then advance to slide 9's line chart for trend tracking. Input from balance sheets, adjust for projections. In startups, use to pitch investors on cash management, citing benchmarks from PitchBook.
Workflow: 1) Compile financials; 2) Populate templates; 3) Analyze visuals; 4) Annotate insights; 5) Present. For enterprises, cycle slides map capital circulation, aiding in debt strategies per Moody's ratings insights.
Seamless Workflow Enhancement
Integrate with Excel imports, add links to reports. Cite FASB for credibility.
Boost Your Financial Narratives
This template turns numbers into strategies, with users praising its clarity in audits. Download and fortify your finances.
Frequently Asked Questions
Can elements be resized?
Yes, vectors maintain quality.
Compatible software?
Apple Keynote only.
Suitable for beginners?
Yes, intuitive interface.
Slide count?
25 editable slides.
Commercial use?
Yes, for financial reports.