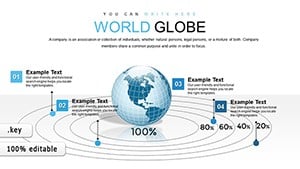
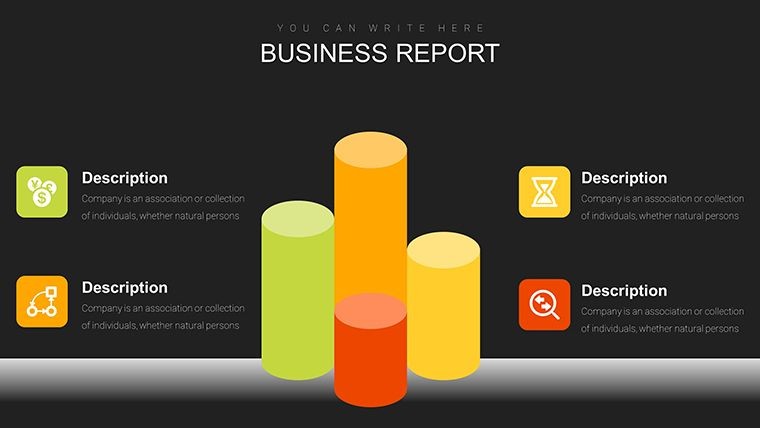
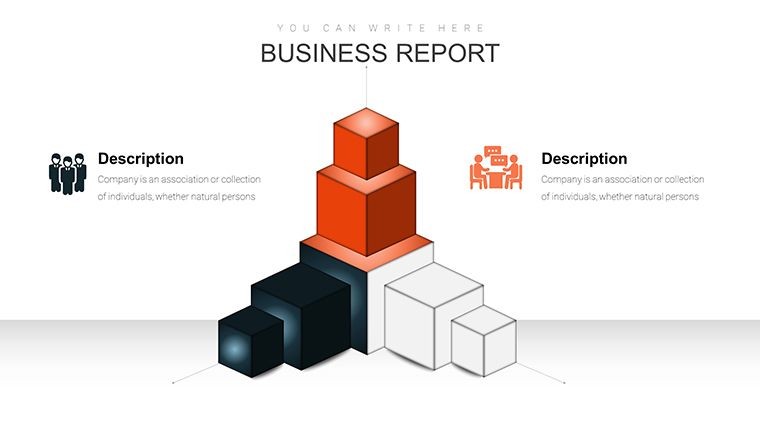
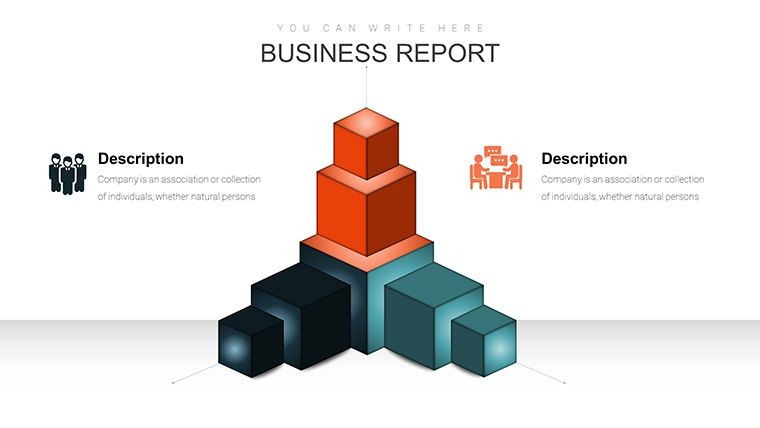
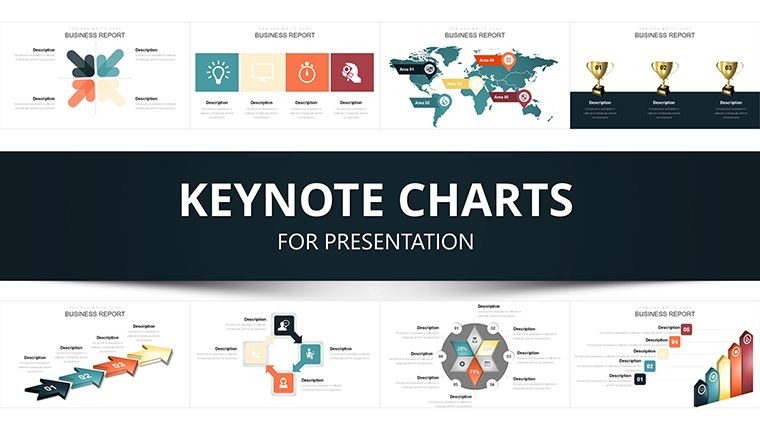
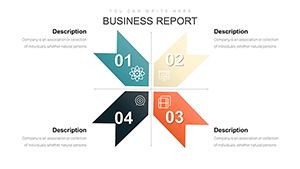
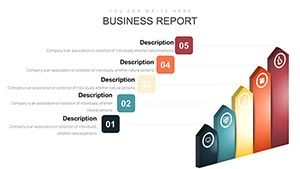
World Development Trends Keynote: Chart Market Momentum


Type: Keynote Charts template
Category: Arrows
Sources Available: .key
Product ID: KC00297
Template incl.: 49 editable slides
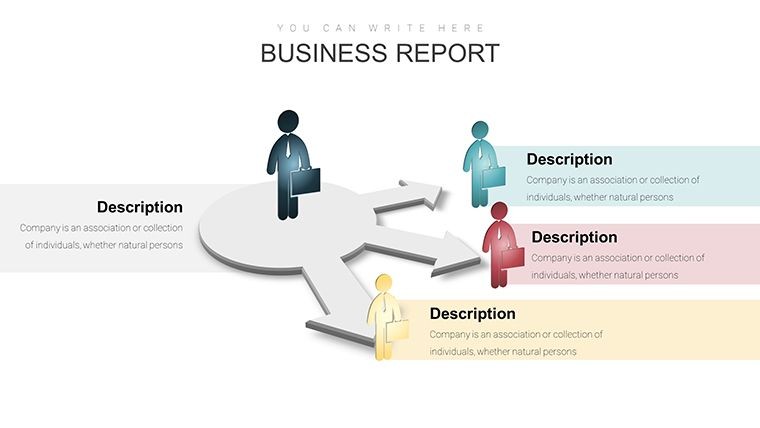
In the ever-shifting landscape of global business, where market share isn't just a metric - it's a mandate for survival - our World Development Trends Keynote Chart template equips you to narrate growth stories with unerring accuracy. This powerhouse of 49 editable slides, centered on arrow-driven visualizations, is for forward-thinking executives, analysts, and marketers who need to convey efficiency gains and trend trajectories without the fog of vague graphs. From plotting quarterly conquests to forecasting international expansions, these charts make data dance, revealing paths to cost leadership and competitive edges.
Inspired by economic models from the World Bank and McKinsey reports, the template emphasizes directional clarity: arrows that point not just to numbers, but to narratives - like how capturing 5% more share slashes production costs below breakeven. Slide after slide, you'll find layouts that transform raw stats into strategic arrows, with customizable lengths symbolizing growth velocity and curvatures indicating market twists. It's Keynote at its finest - smooth animations that propel arrows forward, mimicking real-world momentum and keeping your audience leaning in.
Unlike basic line charts that flatten trends, this template's arrow focus adds dynamism, with vector precision ensuring scalability for everything from intimate strategy huddles to massive investor decks. Collaborate effortlessly across teams, pulling in live data from spreadsheets, and watch as elements auto-align for that polished, pro look every time.
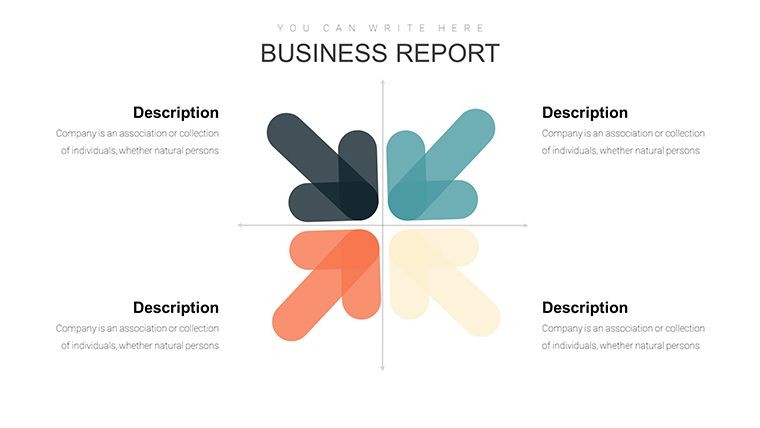
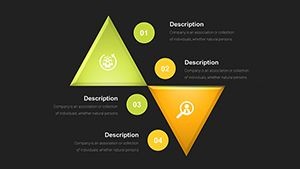
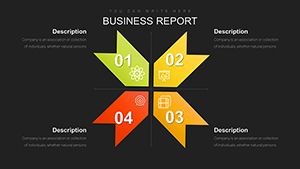
Standout Features: Arrows That Aim True
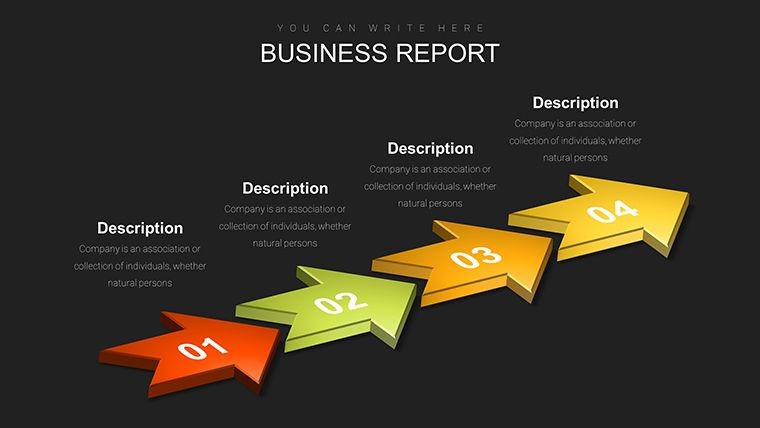
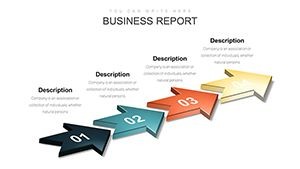
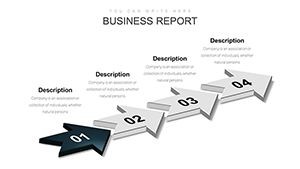
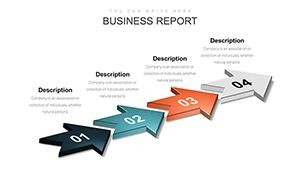
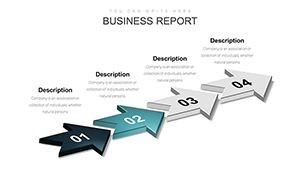
Engineered for impact, these features turn static data into kinetic insights. Arrow charts dominate, from straight-line progress bars to curved trajectory maps, all with editable shafts, heads, and fills for nuanced emphasis.
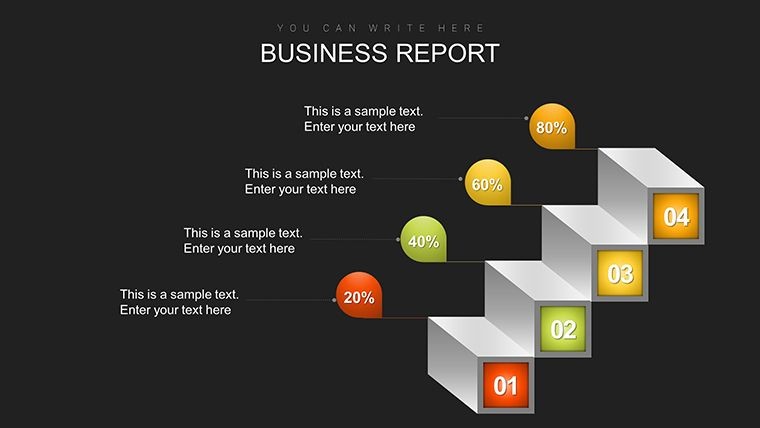
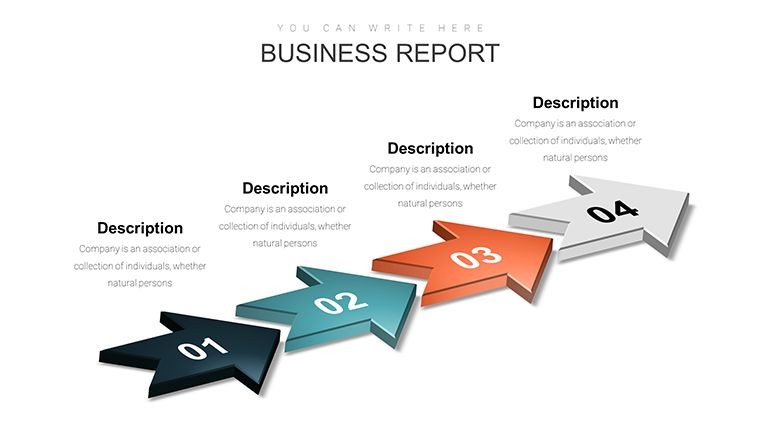
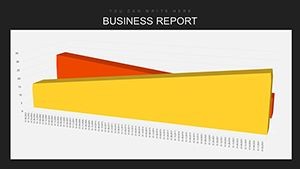
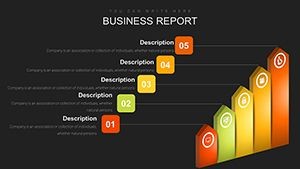
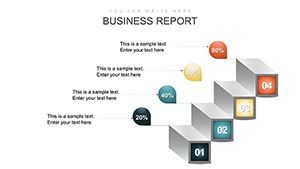
- Dynamic Scaling: Resize arrows proportionally to data inputs, visualizing share surges or dips at a glance.
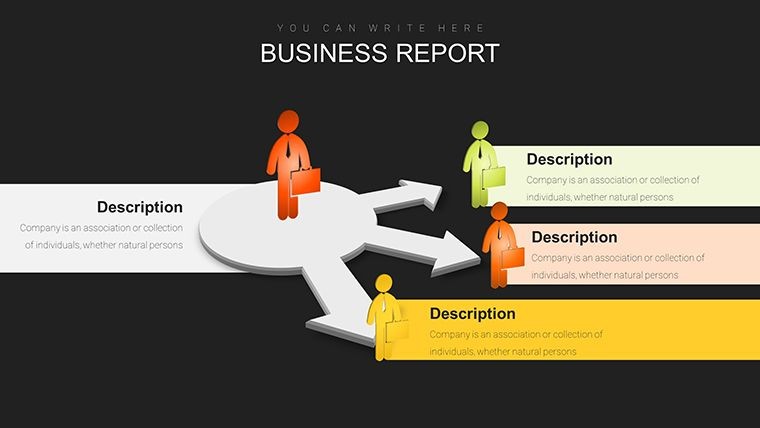
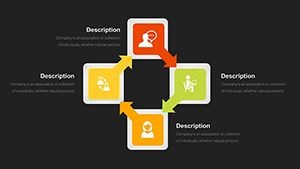
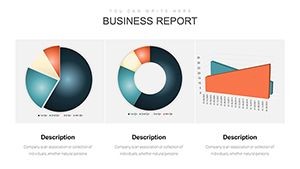
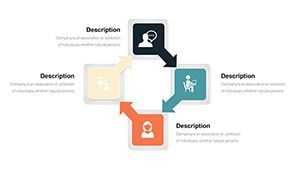
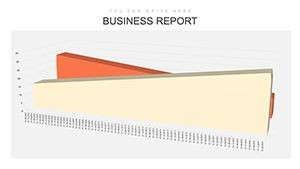
- Trend Layering: Stack multiple arrows for comparative analysis, like regional vs. global developments.
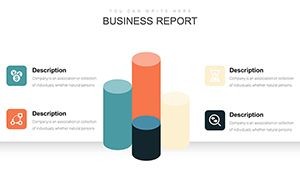
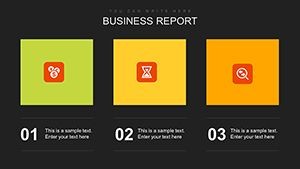
- Integrated Metrics: Built-in labels and scales that update in real-time, synced to your datasets.
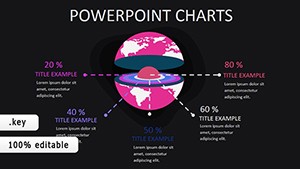
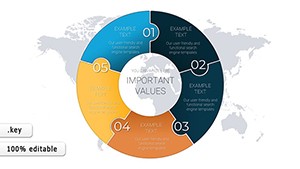
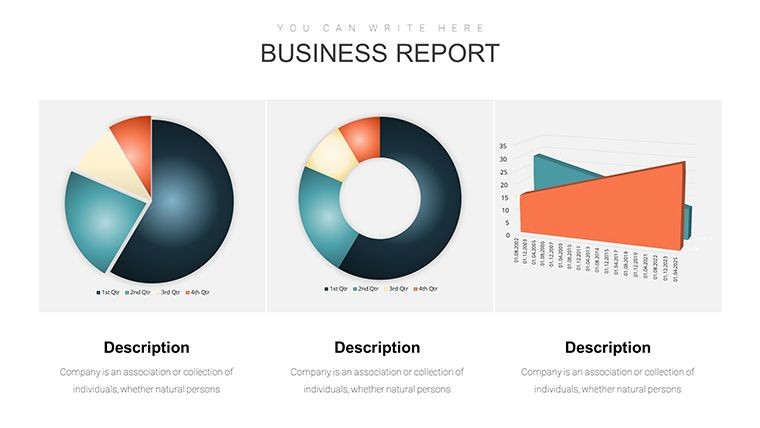
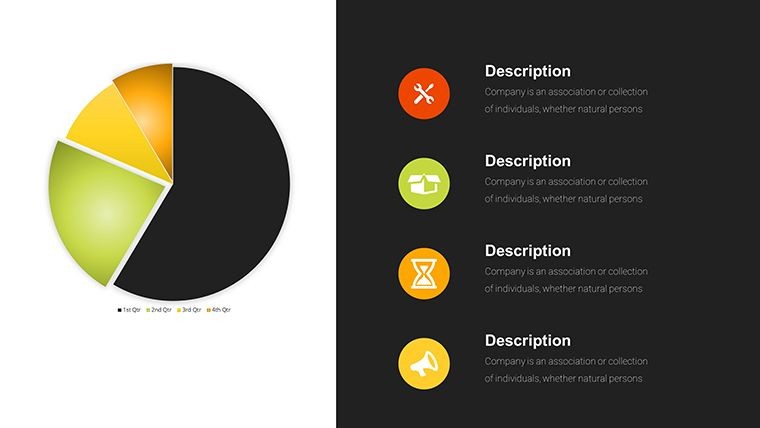
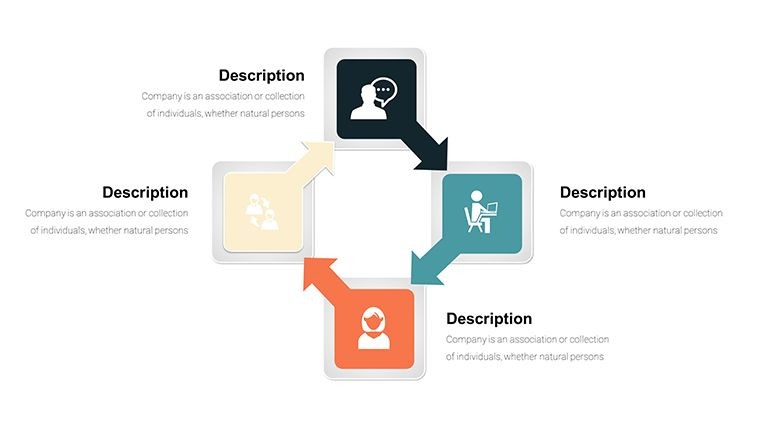
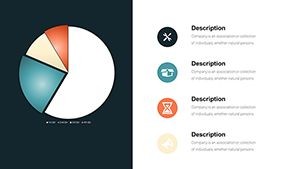
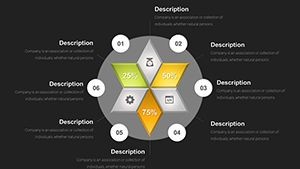
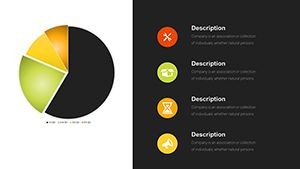
Advanced slides incorporate hybrid elements - arrows piercing pie segments for share breakdowns or timelines with directional flows for development phases. All are optimized for Keynote's magic move, enabling fluid transitions between slides that feel like a seamless story arc.
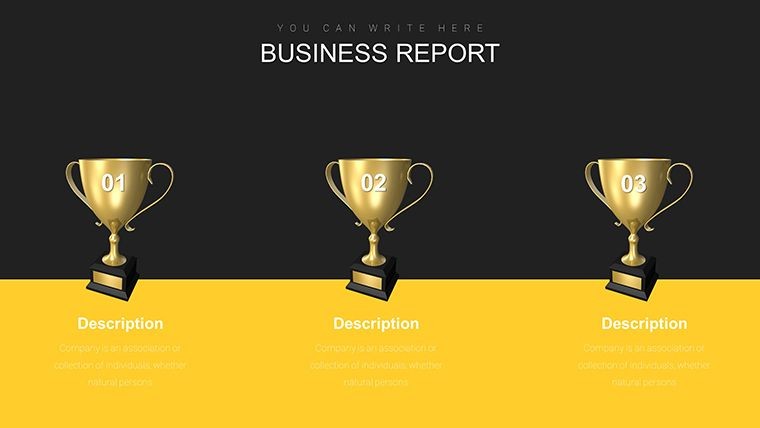
Use Cases That Drive Results: Trends in Motion
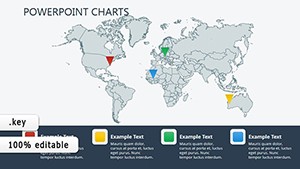
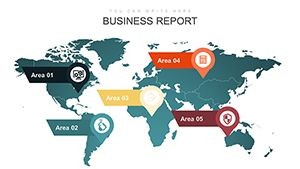
Picture a global firm using these charts in an earnings call: arrows chart market penetration, visually linking share gains to cost reductions, clinching investor buy-in. Or, in a marketing war room, overlay trends on competitor maps to spotlight untapped territories, accelerating campaign pivots.
Your step-by-step playbook:
- Data Dive: Import share figures from analytics tools - Keynote handles CSV effortlessly.
- Arrow Assembly: Select a base slide, stretch arrows to match metrics, and color-code for positivity/urgency.
- Animate Advances: Set sequential reveals to build from baseline to projected trends.
- Distill Insights: Export as interactive PDFs for stakeholder follow-ups.
Outpacing generic templates, this one's arrow-centric design aligns with visualization principles from Stephen Few, making complex developments intuitively graspable. A user testimonial? It streamlined a startup's pitch deck, highlighting efficiency arcs that secured seed funding.
Slide Sampler: Navigating the 49
Slides 1-12: Linear arrow progress for share tracking.Slides 13-24: Curved variants for volatile trends.Slides 25-36: Comparative stacks for multi-market views.Slides 37-49: Forecast hybrids with predictive arrows.
Insider Tip: Use Keynote's path tool to morph arrows between slides, creating cinematic trend evolutions.
Seize the Trends - Your Charts Await
Don't let data trends pass you by - harness them with arrows that point to prosperity. Acquire this template today and chart your course to market mastery.
Frequently Asked Questions
How do the arrow charts handle large datasets?
Effortlessly - auto-scale and label for clarity, even with extensive metrics.
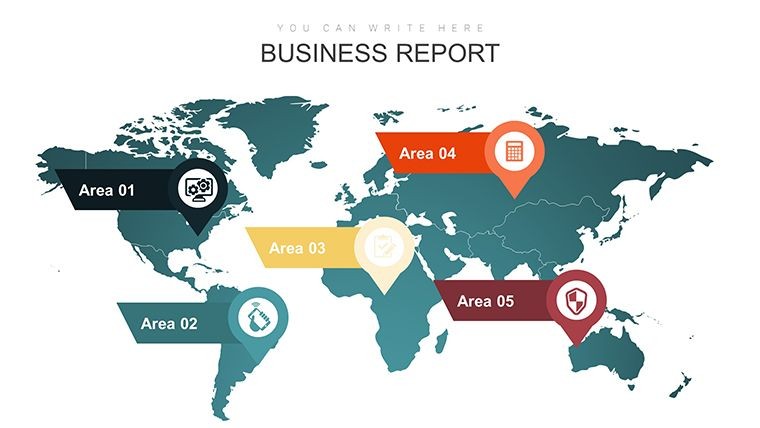
Is it suited for international trend analysis?
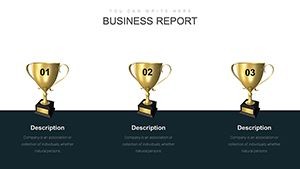
Perfectly, with geo-themed icons for global context.
Can arrows be animated for emphasis?
Yes, with Keynote-native effects for growth simulations.
File delivery and Keynote versions?
.key format, works with recent macOS Keynote installs.
Examples for cost-efficiency visuals?
Included placeholders show share-to-cost linkages.