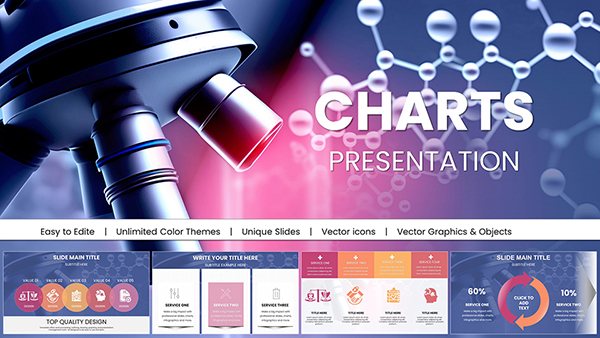
Overlapping Strategy Development Keynote Charts


Type: Keynote Charts template
Category: Business Models, Flow
Sources Available: .key
Product ID: KC00259
Template incl.: 17 editable slides
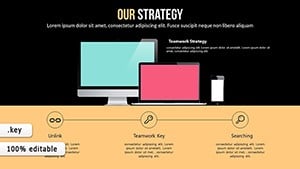
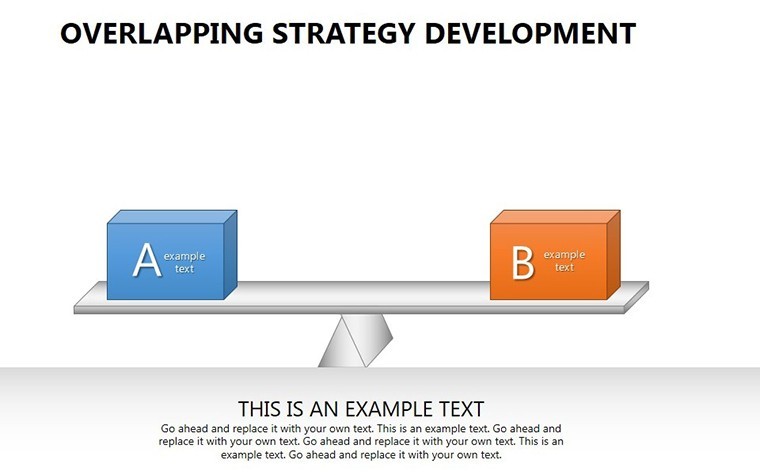
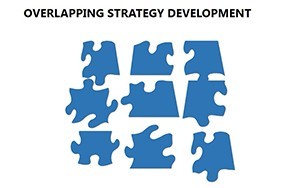
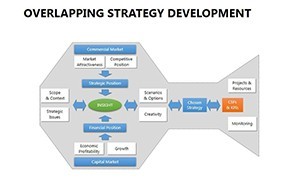
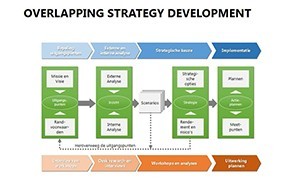
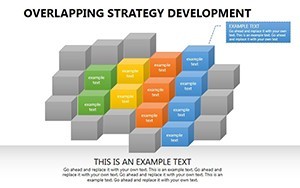
In today's competitive landscape, crafting a strategy isn't just about listing goals - it's about illustrating connections that drive success. Our Overlapping Strategy Development Keynote charts template does exactly that, with 17 editable slides designed to visualize intricate relationships like market segmentation and competitive edges. Ideal for corporate professionals, consultants, and educators, this template turns abstract strategies into tangible, engaging visuals. Imagine overlaying growth prospects with key milestones to show how they intersect, creating a narrative that resonates and inspires action.
Rooted in research-backed design principles, such as those from cognitive psychology on visual learning, it ensures your message sticks. The user-friendly interface means even novices can produce pro-level results, saving hours while boosting impact.
Essential Features for Strategic Visualization
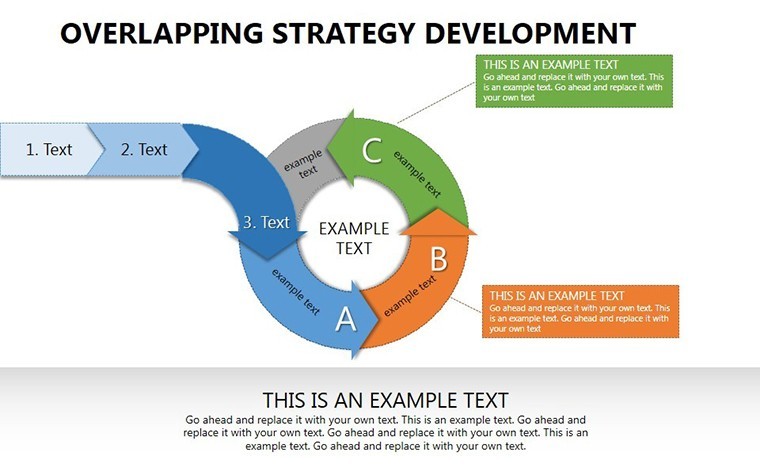
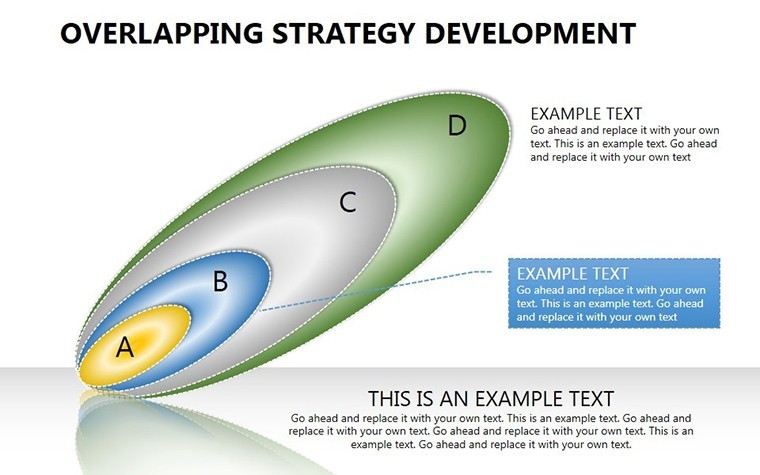
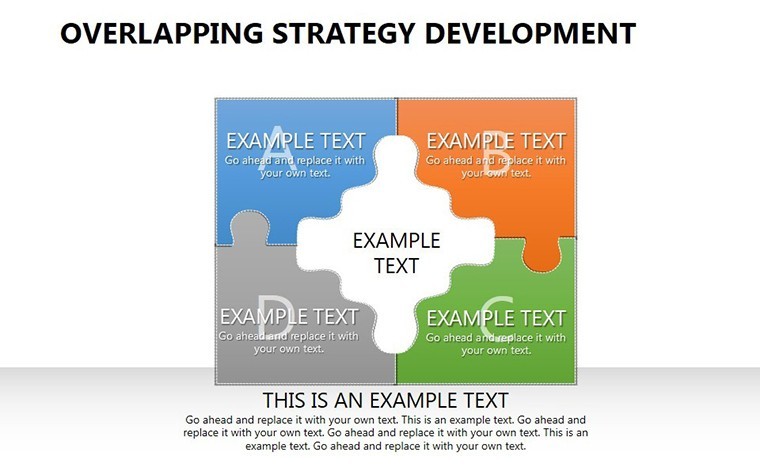
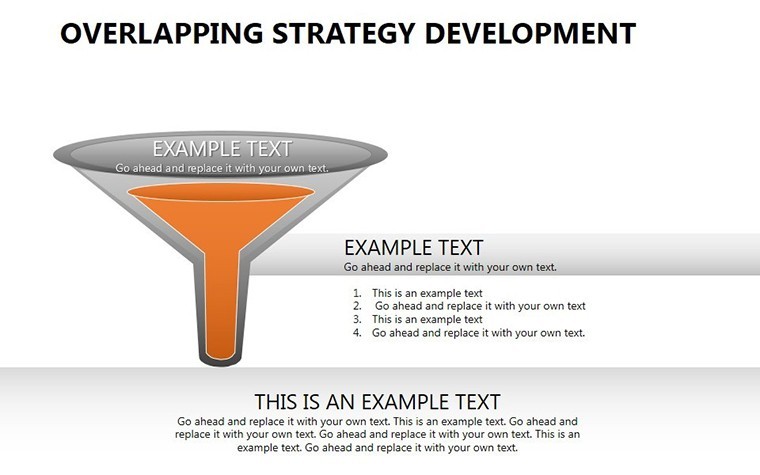
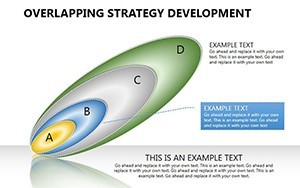
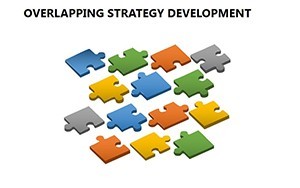
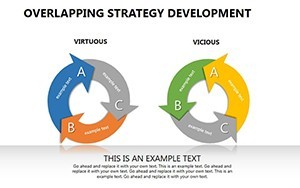
This template's strength is its adaptability, allowing full customization to fit your brand's voice. Overlapping diagrams highlight synergies, perfect for showing how strategies interlink without clutter.
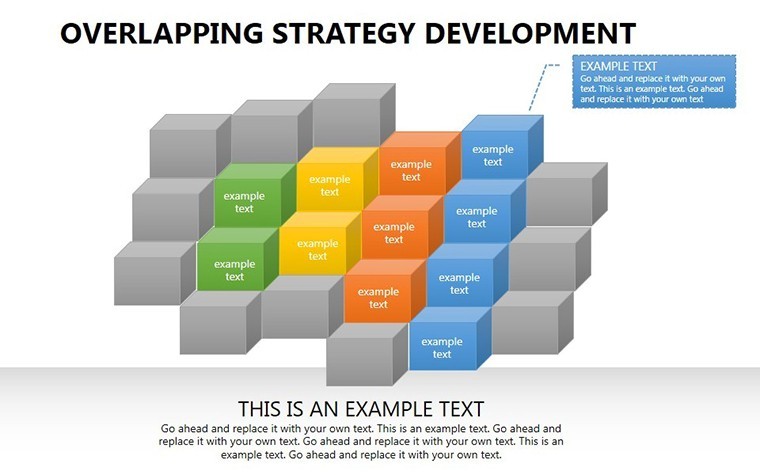
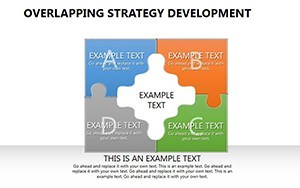
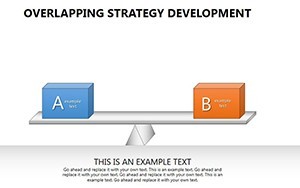
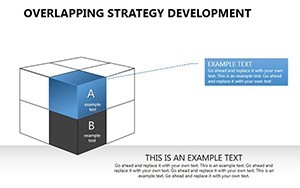
- Customizable Overlaps: Adjust shapes, colors, and texts to represent intersections like SWOT overlaps.
- Research-Based Layouts: Draws from studies on audience comprehension, using minimalism for clarity.
- Seamless Keynote Integration: Drag-and-drop into existing decks, with preserved quality on export.
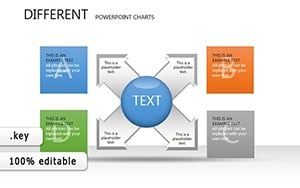
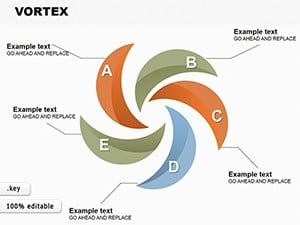
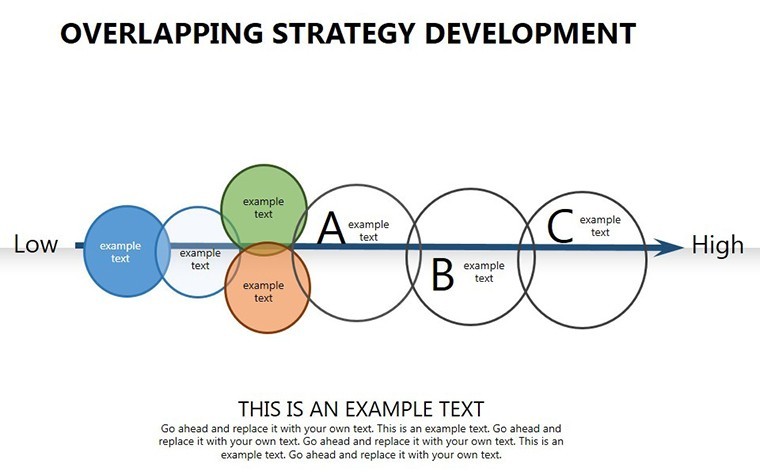
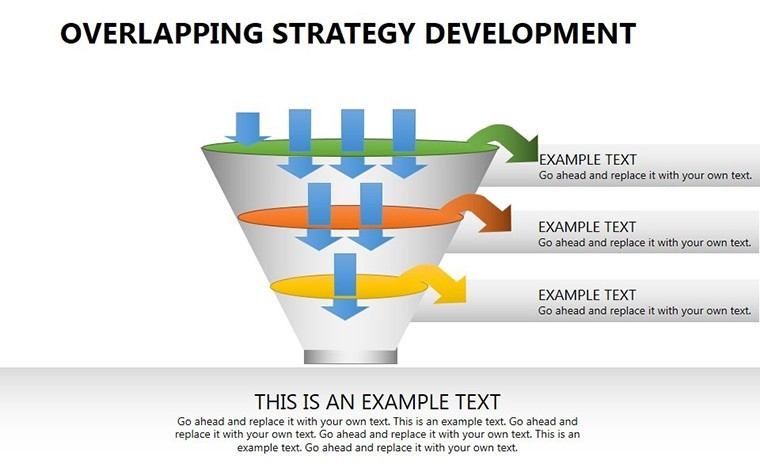
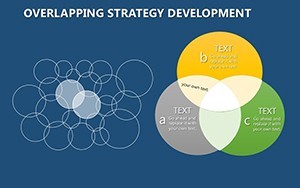
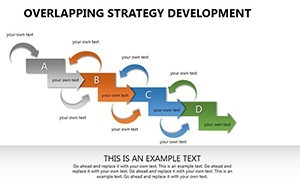
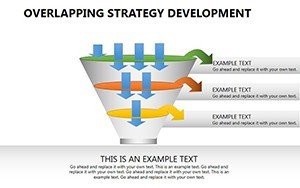
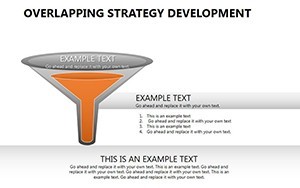
- Versatile Diagrams: From Venn-like structures to layered timelines, cover diverse strategy aspects.
These features tackle common issues like audience disengagement, transforming dense info into digestible insights.
Practical Applications Across Industries
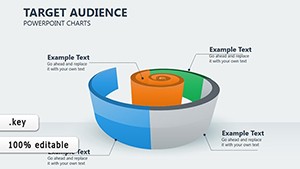
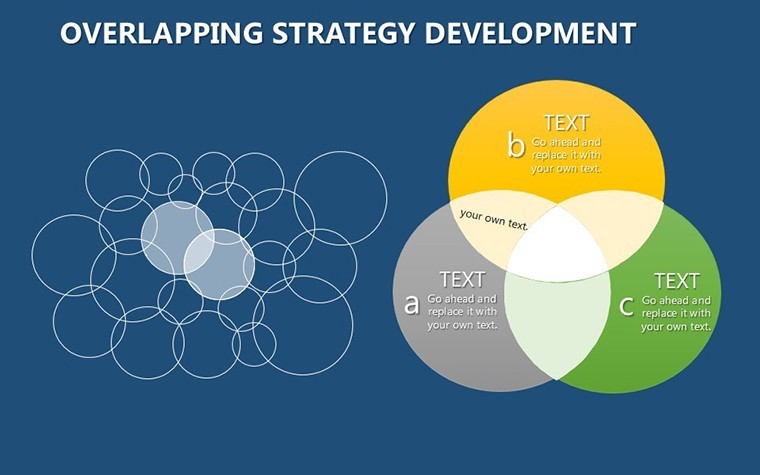
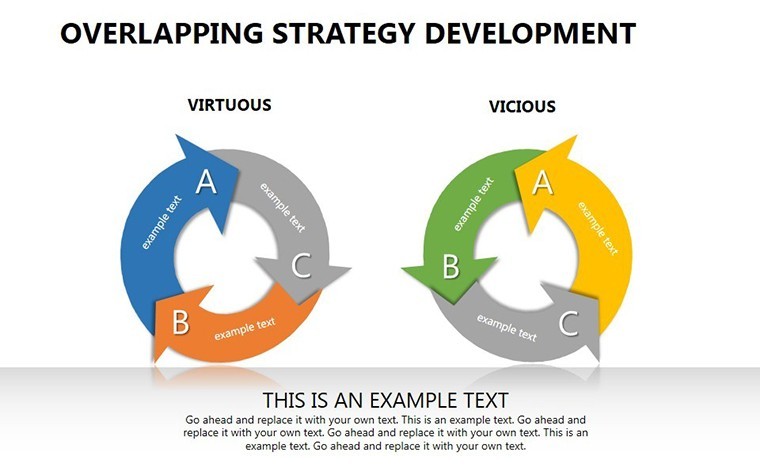
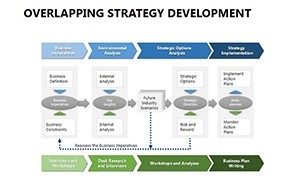
For consultants advising on market entry, use slide #8's overlapping circles to map competitor overlaps with opportunities, as in real cases from Bain & Company reports. Educators can teach strategic planning by customizing for case studies, like Amazon's ecosystem overlaps.
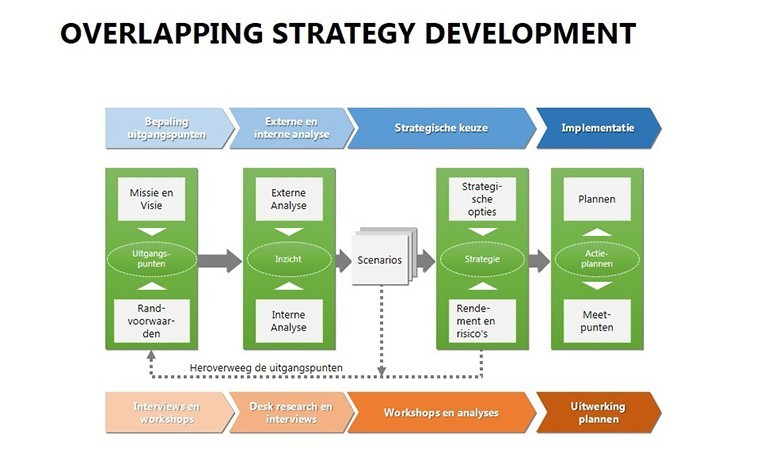
Step-by-step: Identify core strategies, select overlapping visuals, populate with data, refine for coherence, and present. This method has propelled presentations at conferences like Davos, where visual strategies clarified global trends.
Guide to Building Your Strategy Deck
- Map Your Elements: List strategies like segmentation and analysis.
- Select Diagrams: Choose overlaps that best show interconnections.
- Customize Aesthetics: Align with brand guidelines for professionalism.
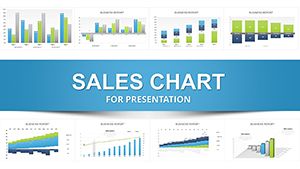
- Incorporate Data: Add metrics to substantiate claims.
- Rehearse Delivery: Ensure overlaps reveal insights dynamically.
In scholarly settings, it aids in publishing strategies, visualizing theoretical models with empirical overlaps.
Why This Template Stands Out
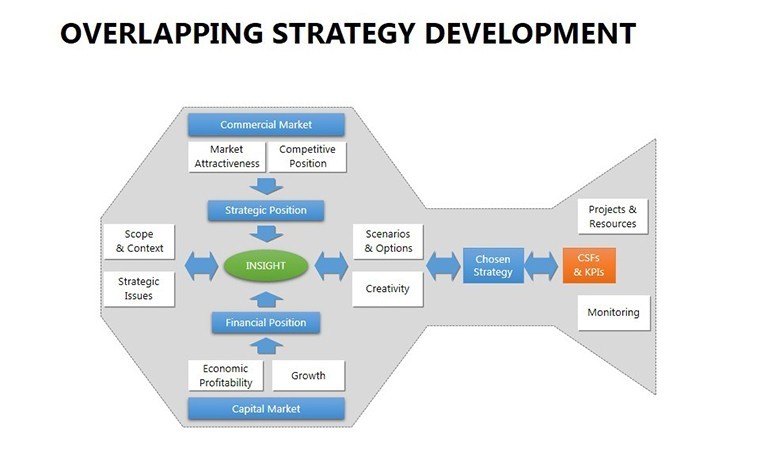
Authoritativeness stems from its alignment with expert frameworks, like Porter's Five Forces visualized through overlaps. Trust is earned via editable precision, avoiding generic pitfalls. Users in competitive fields report heightened persuasion, per feedback from Gartner analyses.
Integrate with tools like MindMeister for brainstorming, then import to Keynote for refinement. For consultants, it's invaluable in client pitches, demonstrating interconnected value propositions.
Tips for Mastering Overlapping Strategies
Experiment with color gradients to denote intensity in overlaps, adding depth. In team collaborations, version control ensures cohesive edits. A subtle nod: Overlaps aren't just visual - they mirror real business synergies, like mergers where strategies blend seamlessly.
Ultimately, this template empowers you to narrate strategies that overlap into success. Don't settle for linear - embrace the interconnected.
FAQ
What makes the overlapping designs unique?
They visually emphasize connections between strategies, improving comprehension over flat charts.
Can I use this for non-business strategies?
Yes, adapt for educational or personal planning, like overlapping life goals.
How many customization options are there?
Unlimited - change colors, fonts, sizes, and add elements freely in Keynote.
Is it suitable for beginners?
Absolutely, with an intuitive interface that requires no advanced skills.
Does it include animation support?
While not specified, Keynote's native animations can be applied to overlaps for dynamic reveals.
How does it aid in competitive analysis?
By overlaying competitor data with your strategies, highlighting gaps and opportunities.