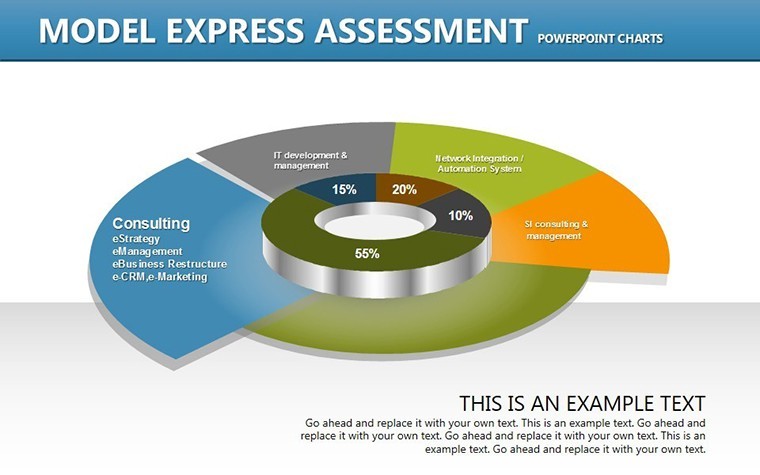
Editable Model Assessment Keynote Charts Template


Type: Keynote Charts template
Category: Business Models
Sources Available: .key
Product ID: KC00258
Template incl.: 14 editable slides
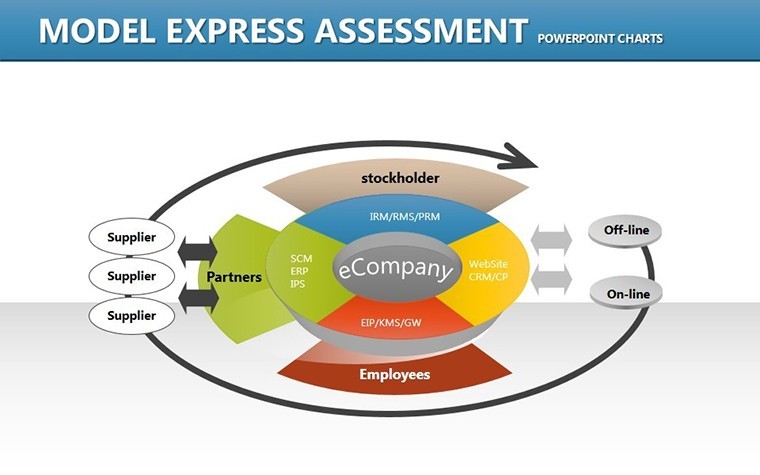
Picture this: You're standing in front of a boardroom, ready to unveil a new business model that could redefine your company's direction. But how do you make complex assessments come alive? Enter our Model Assessment Keynote charts template, a game-changer for anyone needing to present ideas, products, or expertise with flair. With 14 editable slides packed with creative designs and animations, this template turns mundane data into dynamic stories. Tailored for teachers, mentors, entrepreneurs, and professionals, it simplifies the process of evaluating models - be it financial frameworks or strategic plans - ensuring your message hits home every time.
The beauty lies in its modern, professional aesthetic that doesn't require design expertise. Vector-based charts scale perfectly, and built-in animations add that wow factor, making your presentation unforgettable. Drawing from business best practices, like those in Harvard Business Review case studies, this template helps you assess and communicate value accurately, fostering trust and engagement.
Exploring the Core Features
At the heart of this template are its versatile features, designed to enhance every aspect of your presentation. The widescreen format ensures compatibility with modern displays, while each object's special animation draws attention to key elements - like highlighting risks in a business model assessment.
- Vector-Based Customization: Stretch, resize, or recolor charts without quality loss, perfect for branding alignment.
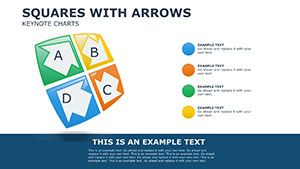
- Animation Effects: Subtle transitions that reveal data progressively, keeping audiences hooked.
- Media Integration: Seamlessly add photos, videos, or music to enrich your model explanations.
- Easy Editing: Intuitive interface allows quick changes, even for non-tech-savvy users.
These elements address real challenges, such as time constraints in fast-paced business environments. Instead of starting from scratch, leverage pre-built slides to focus on content, not creation.
Use Cases in Professional Settings
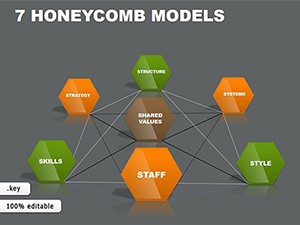
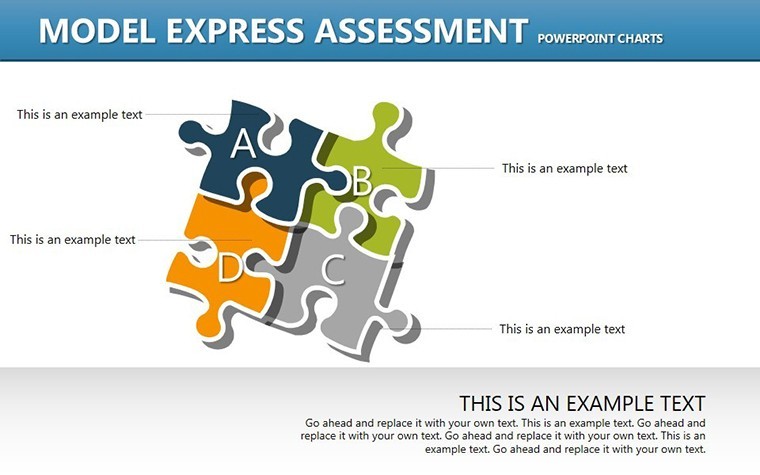
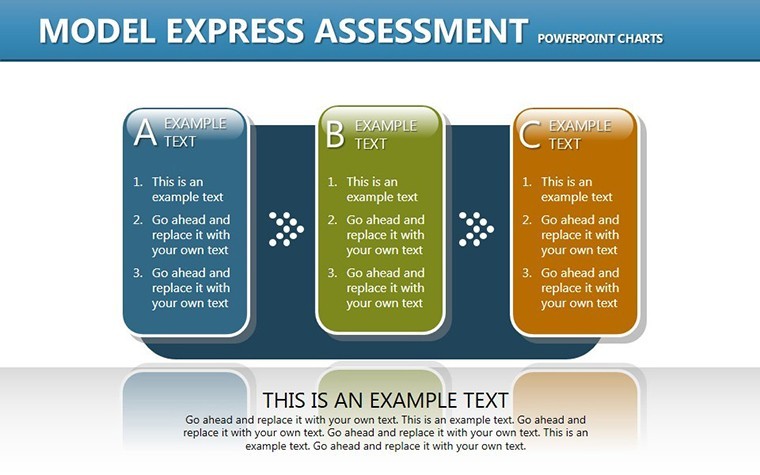
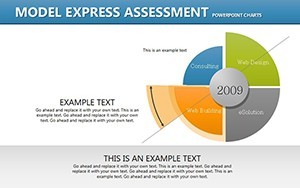
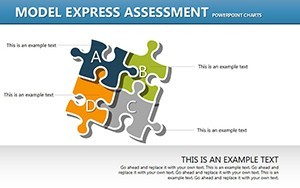
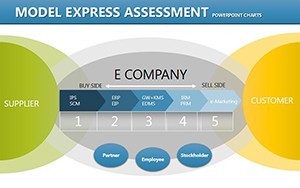
For entrepreneurs pitching to investors, slide #3's assessment matrix can break down value propositions, showcasing strengths and weaknesses with clarity. Educators might use it to teach business models, incorporating real examples like Airbnb's disruptive strategy, as analyzed in industry reports from McKinsey.
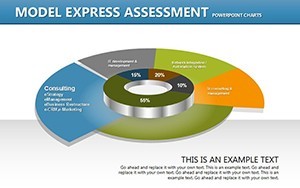
In corporate training, mentors can customize charts to evaluate team performance models, using bar graphs to compare metrics. A step-by-step application: First, input your data; second, select animations; third, rehearse for flow. This approach has helped firms like Deloitte in client consultations, where visual assessments led to better decision-making.
Customizing for Maximum Impact
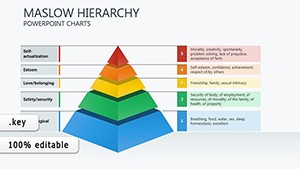
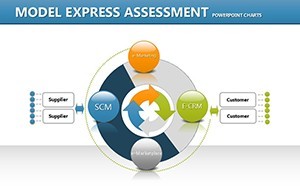
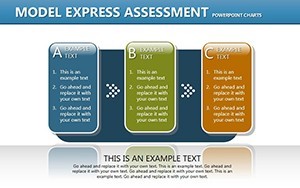
- Define Your Model: Choose a slide that matches your assessment type, such as SWOT or PESTLE integrations.
- Input Data: Populate with specifics, like revenue projections or market shares.
- Enhance Visually: Apply colors and fonts that resonate with your audience's expectations.
- Add Interactivity: Include hyperlinks to supporting documents for deeper dives.
- Test and Iterate: Preview animations to ensure smooth delivery.
This methodology not only saves time but also elevates your professional image, as seen in successful TED Talks where visual aids amplified messages.
Benefits for Diverse Users
Trustworthiness comes from proven utility - users report enhanced engagement when using animated assessments, per UX studies from Nielsen. For non-experts, the template demystifies complex evaluations, making it accessible yet authoritative. Integrate it into workflows by combining with tools like Excel for data import, ensuring accuracy in model representations.
In educational contexts, it supports experiential learning, allowing students to assess case studies interactively. Entrepreneurs benefit from quick iterations, testing business ideas visually before launch. Overall, it's a tool that builds confidence, backed by design principles from experts like Don Norman.
Advanced Tips and Integrations
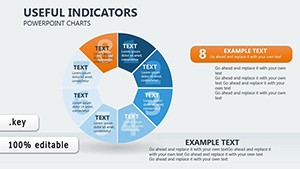
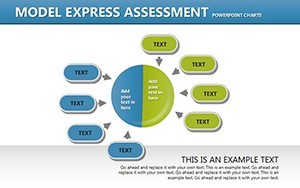
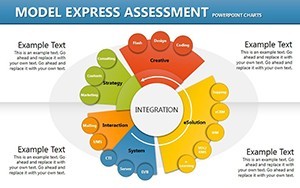
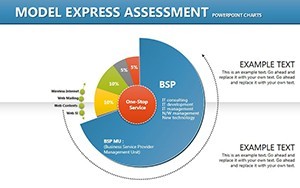
To take it further, layer multiple charts for comprehensive views, such as combining pie charts with timelines for historical model evolutions. In team settings, collaborative editing fosters innovation, as evidenced by agile methodologies in tech firms like Google.
A light touch of humor: Don't let your models assess you - use this template to stay ahead! Seriously, though, it's about turning assessments into assets, with LSI elements like "business valuation charts" woven in naturally.
End your journey with a strong close: This template isn't just slides; it's your partner in persuasive communication. Ready to assess and impress?
FAQ
How do the animations work in this template?
Each object has pre-set animations that activate on click or automatically, enhancing flow without extra setup.
Can I use this for non-business presentations?
Absolutely - adapt for educational or personal projects, assessing anything from lesson plans to personal goals.
What file format is provided?
.key format for Keynote, with options to export for compatibility.
Are the charts suitable for large datasets?
Yes, vector designs handle complexity, though for massive data, pair with external tools.
How does it help in model evaluation?
It provides visual frameworks to compare and contrast models, highlighting key metrics effectively.