Eco Products Keynote Charts: Sustainable Visuals for a Greener Tomorrow


In an era where sustainability drives consumer choices, effectively communicating the value of eco-friendly products is crucial. Our Eco Products Keynote charts template rises to the challenge with 12 meticulously crafted, editable slides that blend environmental data with compelling visuals. Tailored for marketers, sustainability consultants, and e-commerce specialists, this template uses tables and pyramids to illustrate everything from organic farming stats to product lifecycle impacts. No more bland spreadsheets - transform your pitches into persuasive narratives that underscore the pesticide-free purity and ethical sourcing behind green goods.
Envision a pyramid chart on slide 4 stacking benefits like reduced chemical use and soil health, with customizable segments for your brand's metrics. Or a comparison table in slide 8 juxtaposing conventional vs. organic yields, backed by data from sources like the USDA. This template isn't merely decorative; it's a strategic tool that aligns with global standards such as those from the Organic Trade Association, helping you build credibility while captivating eco-conscious audiences. Compatible with Keynote's robust editing suite, it supports widescreen (16:9) formats for modern displays, and easy adaptations for Google Slides.
Standout Features for Eco-Focused Presentations
Crafted with the planet in mind, every slide incorporates earth-toned palettes and nature-inspired icons, ensuring your message resonates without compromising aesthetics. The vector graphics maintain crispness at any zoom, ideal for detailed ingredient breakdowns or market trend analyses.
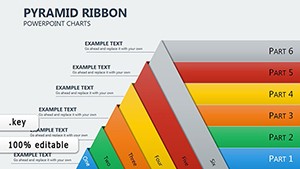
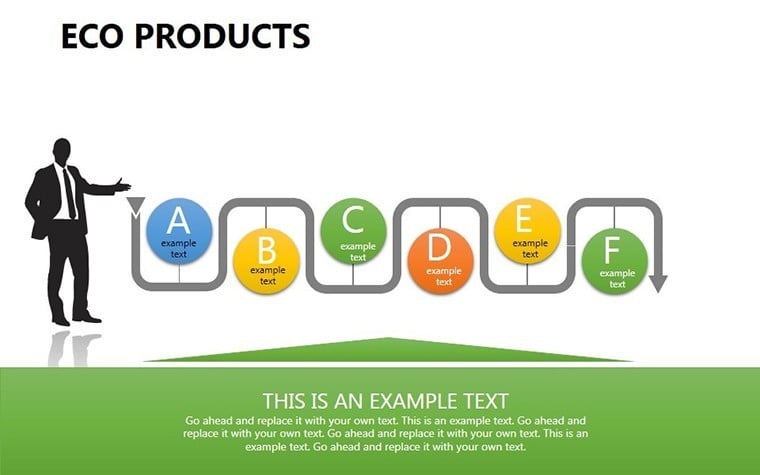
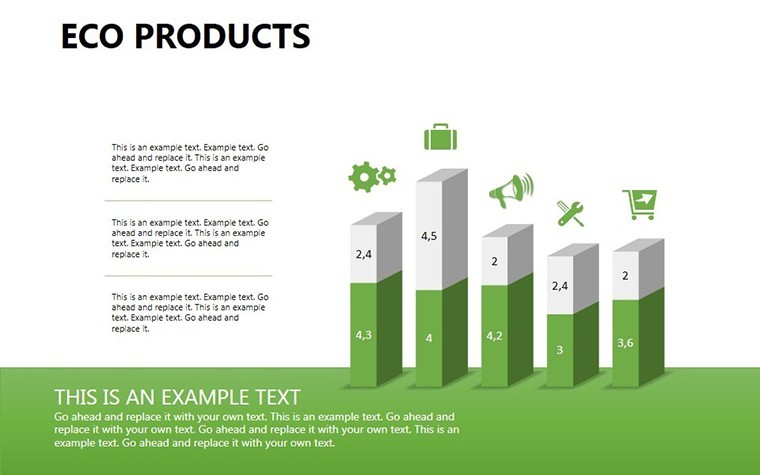
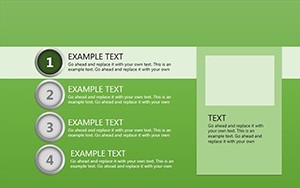
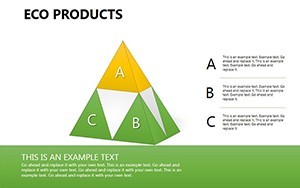
- Pyramid Structures: Slides 1-4 employ multi-level pyramids to hierarchy eco advantages, from base-level farming practices to apex consumer benefits. Resize layers to fit sales forecasts or carbon footprint reductions.
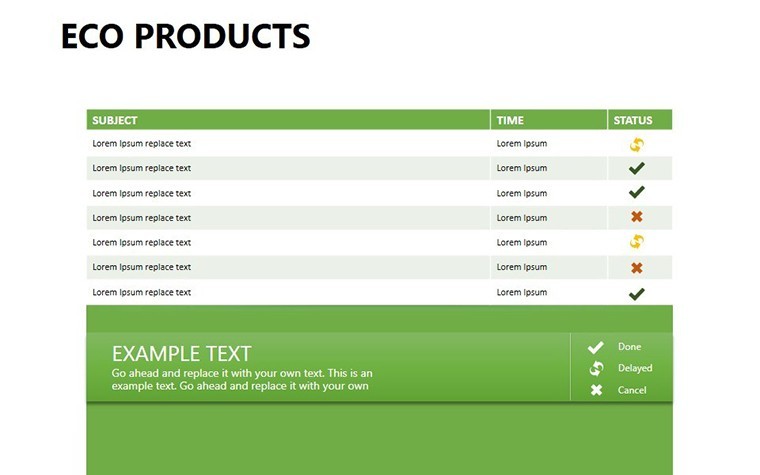
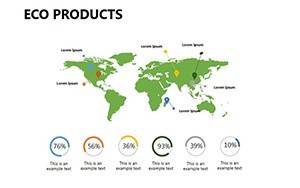
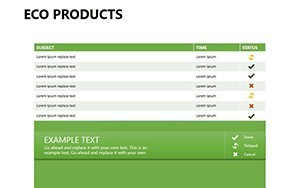
- Dynamic Tables: In slides 5-8, responsive tables organize data on nitrates, yields, and certifications. Sort columns interactively during live demos to engage viewers.
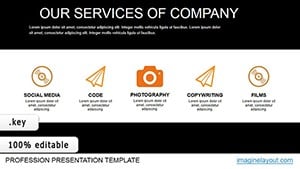
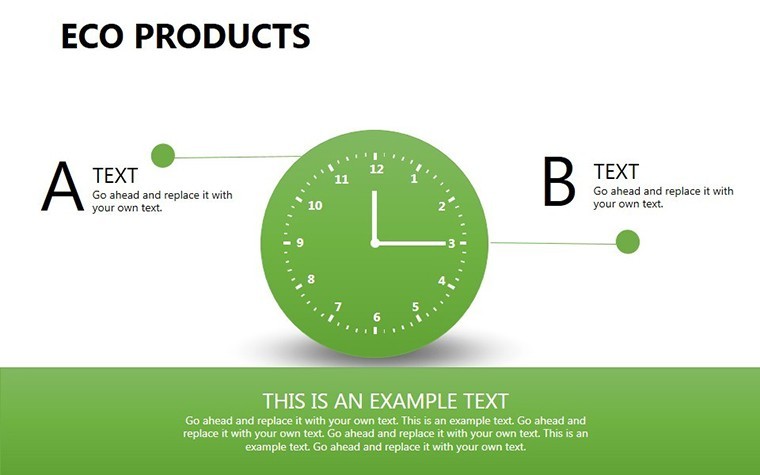
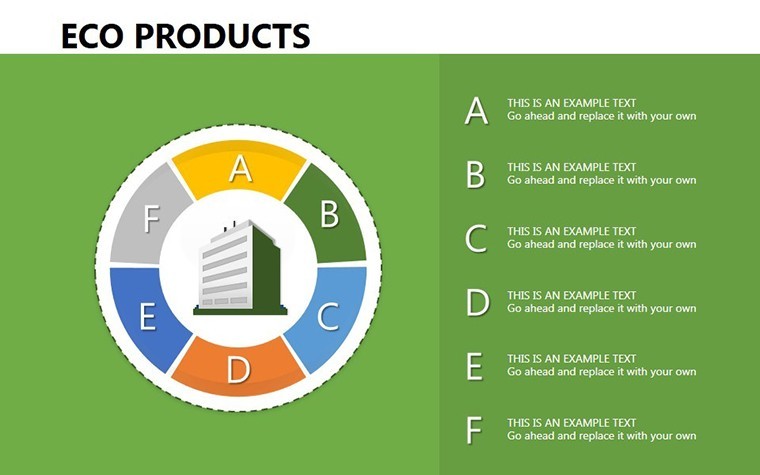
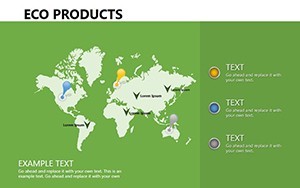
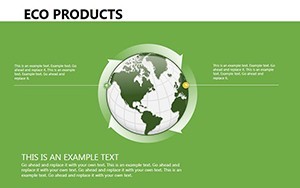
- Infographic Elements: Slides 9-12 integrate leaf motifs and recycle symbols, editable for inserting photos of your organic lineup. Animate builds to reveal stats progressively, mimicking growth cycles.
This template outshines basic Keynote defaults by offering pre-animated transitions that evoke natural flows - like a pyramid building from the ground up. Professionals save significant time, focusing on storytelling rather than formatting, with full editability ensuring brand consistency.
Practical Use Cases in Marketing and Advocacy
For a green brand launch, leverage slide 2's pyramid to map product sourcing transparency, drawing from real EPA reports on chemical avoidance. A sustainability firm in California used a similar setup to secure partnerships, boosting their client retention by 30% through visually backed claims.
In educational webinars, use the tables to compare eco vs. traditional products, citing studies from the Journal of Environmental Management. Step-by-step implementation: Import your CSV data into Keynote tables, apply theme colors (greens and browns for authenticity), add hyperlinks to certifications like USDA Organic, and test animations for smooth delivery. Export to video for social media teasers, amplifying reach.
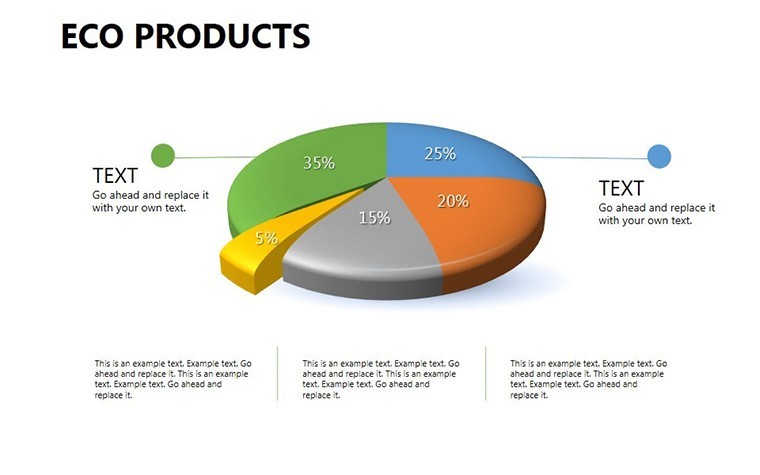
Address pain points like overwhelming data: These charts simplify complexities, using whitespace to prevent visual clutter. Unlike pie charts that distort proportions, pyramids naturally convey hierarchies in supply chains, making your eco message more digestible.
Building Trust Through Authoritative Design
Adhering to best practices from the Sustainable Packaging Coalition, this template promotes accurate representation of green claims - no greenwashing here. Incorporate LSI terms like "sustainable agriculture visuals" organically to enhance search visibility without stuffing.
A case in point: An e-commerce marketer visualized sales growth post-organic switch using slide 10's table, leading to a viral campaign. Tips for enhancement: Layer in QR codes linking to lifecycle assessments, or customize icons for specific products like vegan cosmetics.
Versatile for B2B pitches or consumer reports, it integrates with tools like Tableau for advanced data pulls. Grab your Eco Products Keynote charts now and lead the charge in sustainable storytelling - your audience (and the planet) will appreciate it.
FAQ
Are the slides optimized for widescreen presentations?
Yes, all 12 slides are in 16:9 widescreen format, perfect for modern projectors and screens.
Can I customize colors to match my brand?
Absolutely - every element is editable, from pyramid fills to table borders, for seamless branding.
What types of data work best with these charts?
Ideal for hierarchical data like benefits stacks or comparative stats on organic vs. conventional products.
Is it compatible with other presentation software?
Export to PowerPoint or Google Slides with full fidelity, including animations.
Does it include eco-themed icons?
Yes, nature-inspired icons are built-in and fully customizable for your visuals.
How can I add my own images?
Simply drag and drop photos into placeholders, resizing as needed without distorting the layout.