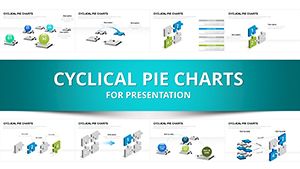
Design Inspiration Keynote Charts: Fueling Creativity Through Visual Cycles


Type: Keynote Charts template
Category: Cycle
Sources Available: .key
Product ID: KC00241
Template incl.: 11 editable slides
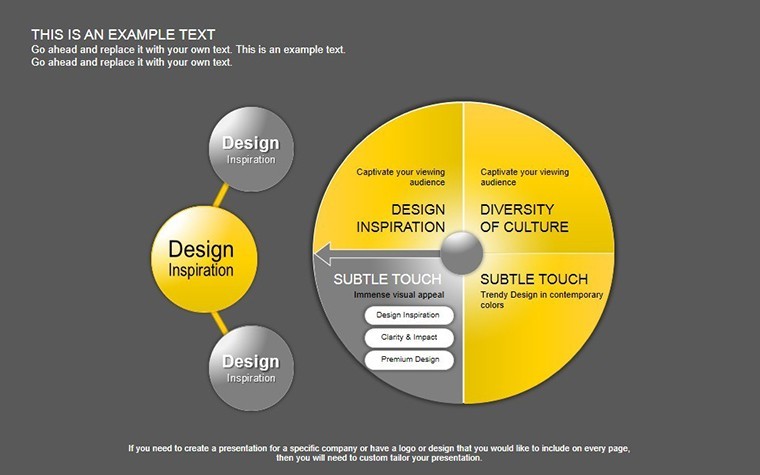
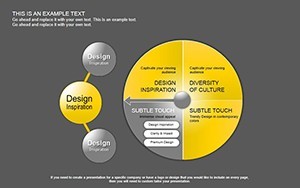
Creativity isn't a switch you flip - it's a cycle that needs nurturing, and the Design Inspiration Keynote Charts template is your catalyst. With 11 editable slides centered on cyclical themes, this tool is tailored for designers, artists, and innovators who thrive on visual stimulation. Forget bland data dumps; here, charts evolve into inspirational loops that mirror the iterative nature of design processes. Whether you're brainstorming for a new architecture concept or refining a graphic project, these slides help you visualize ideas in a way that sparks joy and productivity, sometimes making you forget the clock ticks.
Exclusively for Keynote, it offers .key files that blend seamlessly into your creative workflow. Drawing from cycle-based designs, it's like having a muse in digital form, encouraging endless iterations without starting from zero.
Embracing the Cycle of Creative Visualization
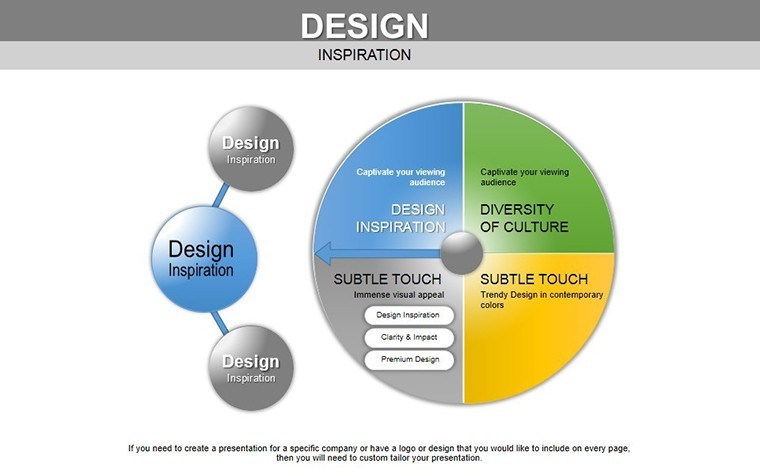
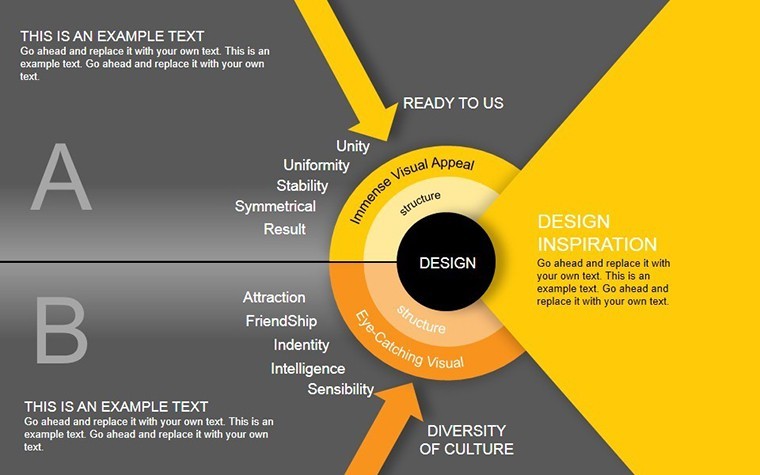
Cycles represent renewal and progression, making this template ideal for showing design evolutions. In architecture, use circular charts to depict sustainable material lifecycles, aligning with LEED standards for eco-friendly presentations. Creatives find that such visuals not only organize thoughts but ignite new ideas, turning potential blocks into breakthroughs.
Core Features Igniting Your Imagination
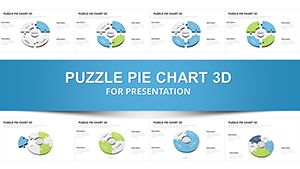
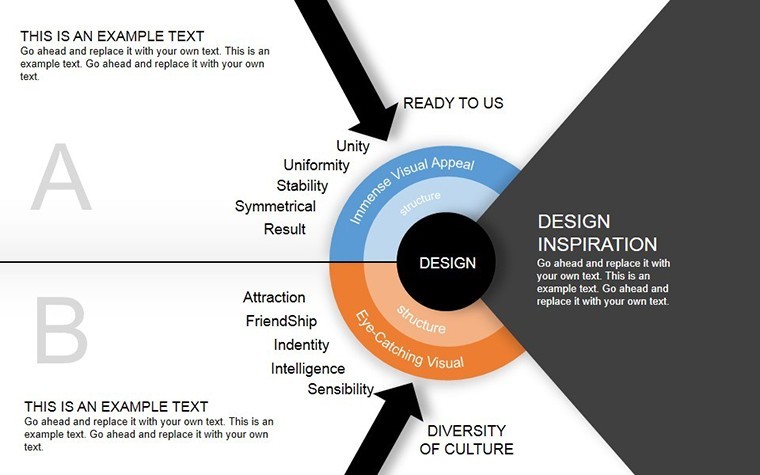
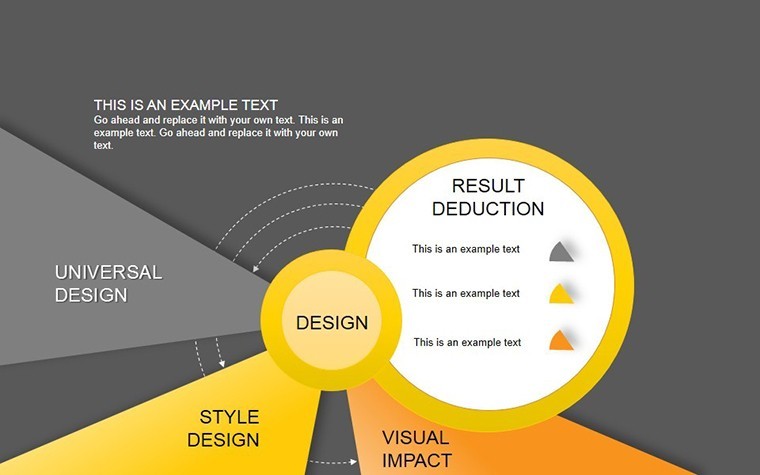
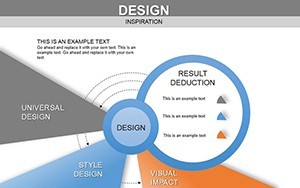
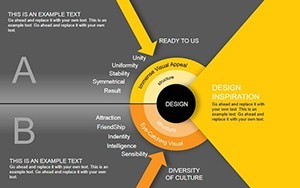
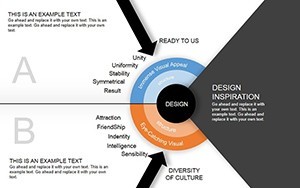
- Cyclical Chart Designs: Perfect for illustrating processes, feedback loops, or iterative developments.
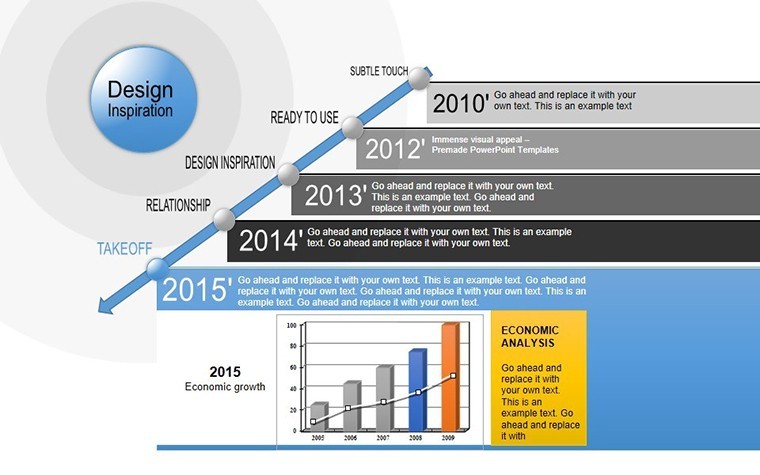
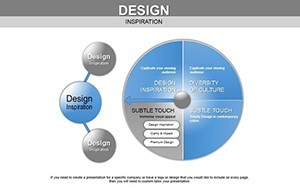
- Full Editability: Tweak shapes, colors, and texts to align with your artistic vision.
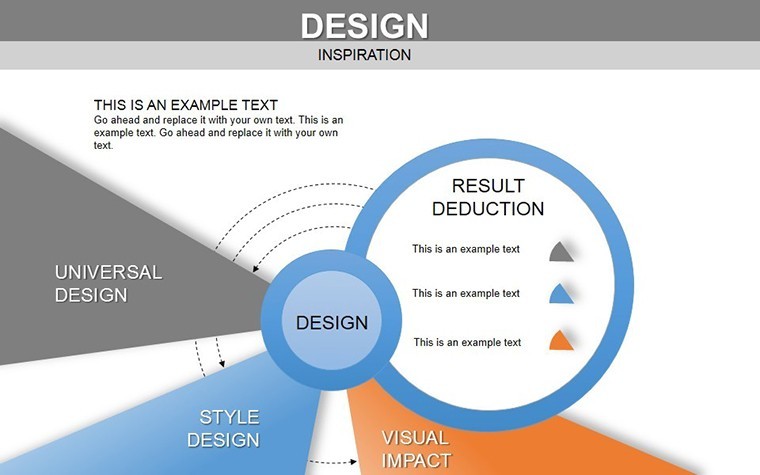
- High-Impact Graphics: Vibrant, inspiring visuals that pop in any setting.
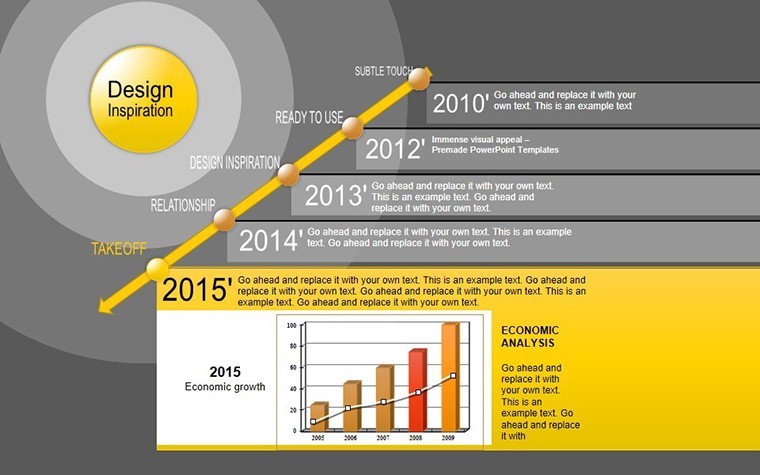
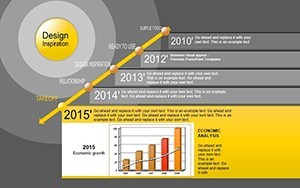
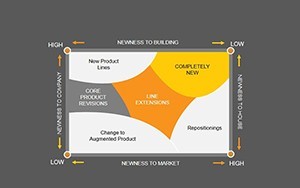
- Varied Slide Formats: From concept overviews to detailed cycle breakdowns.
- Creative Boosters: Built-in elements that prompt innovative thinking.
An indie designer shared how using cycle charts for client mood boards streamlined approvals, infusing presentations with energy that standard tools lack.
Innovative Use Cases for Designers
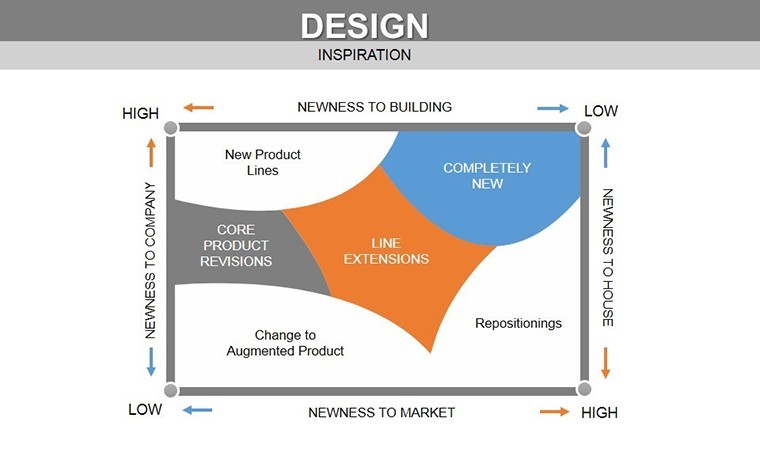
Apply in real scenarios: Graphic artists can map design iterations, architects visualize project cycles from sketch to build. For educators in art schools, cycles teach design thinking principles dynamically.
Workflow integration: Download, open in Keynote, sketch your cycle, add data or images, refine with feedback. Surpasses basic charts by embedding inspirational prompts.
Adding Flair with Thematic Elements
Incorporate icons that evoke inspiration - swirls for ideas flowing. In a landscape architecture pitch, cycle charts can show seasonal plant growth, creating immersive narratives.
Slides range from simple loops for quick ideas to complex multi-cycle displays for in-depth explorations.
Elevating Beyond Ordinary Tools
Ordinary Keynote lacks this inspirational edge; here, cycles foster creativity, leading to more original outputs. Community anecdotes suggest enhanced ideation sessions.
Use daily: For personal journals or team brainstorms, adapting fluidly.
Creative Tips for Best Results
- Begin with free association to populate cycles.
- Mix colors intuitively for emotional impact.
- Collaborate in real-time via Keynote sharing.
- Export iterations for portfolio building.
- Reflect on each cycle to evolve your process.
These habits turn routine into revelation.
In essence, the Design Inspiration Keynote Charts template is your creative companion, cycling through ideas to birth brilliance. For those in design realms, it's essential. Ignite your muse - download and let inspiration flow unbound.
Frequently Asked Questions
- How do the cycle charts enhance creativity?
- By visualizing iterative processes, they prompt new connections and ideas.
- Compatible with iPad Keynote?
- Yes, fully functional on all Keynote platforms.
- Suitable for non-design fields?
- Sure, adapt for any cyclical concept like business planning.
- File size and download?
- Compact .key files for quick access.
- Can I add images?
- Easily insert and position around cycles.