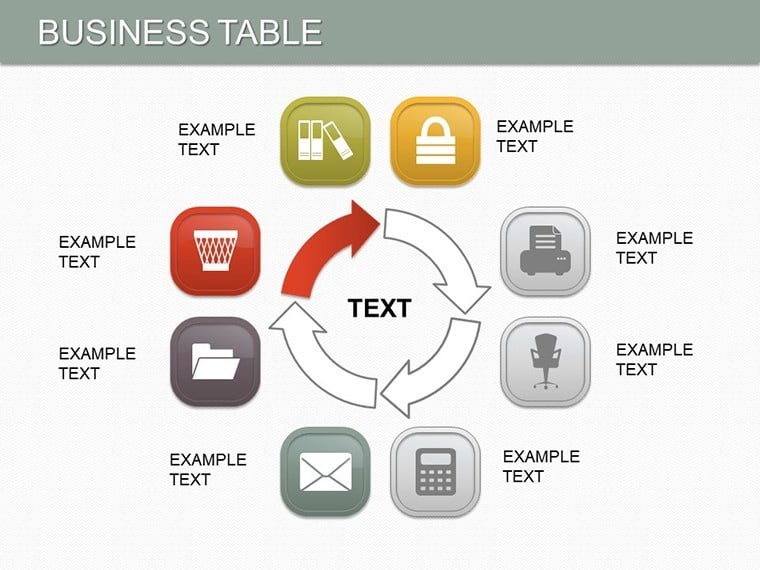
Business Tables Keynote Charts: Structure Your Success


Type: Keynote Charts template
Category: Tables
Sources Available: .key
Product ID: KC00196
Template incl.: 25 editable slides
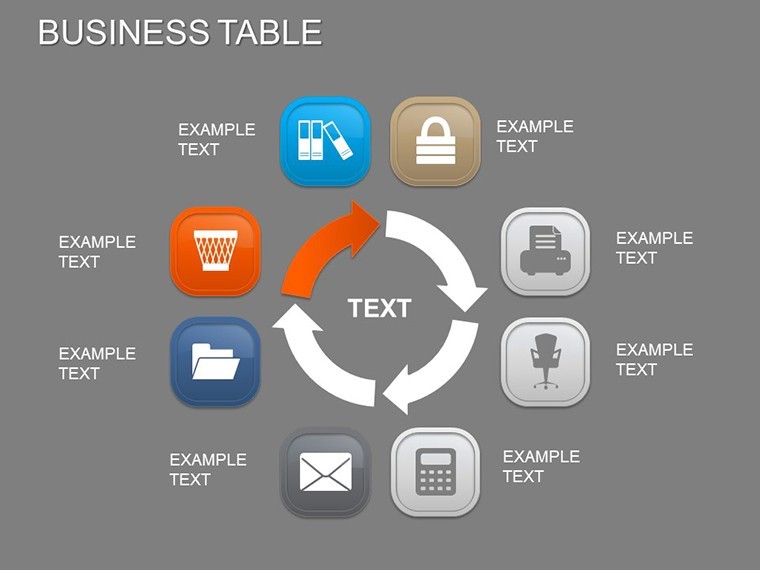
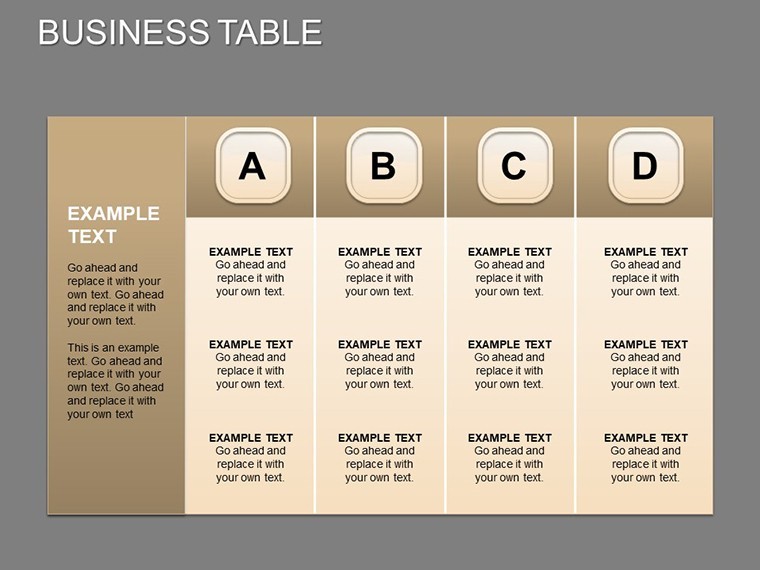
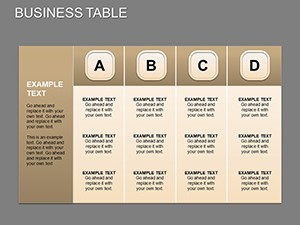
Navigating business growth demands clear communication of strategies and metrics. The Business Tables Keynote Charts presentation template provides 25 editable slides centered on tabular data, empowering entrepreneurs and executives to highlight strengths, weaknesses, expansions, and investor appeals. This tool is your blueprint for compelling decks that secure funding and drive development.
Aimed at startups, established firms, and consultants, it facilitates everything from credit applications to boardroom overviews. In .key format for Keynote, priced at $22, it supports diverse formats and integrates seamlessly with business software. Inspired by real successes, like those in Forbes-featured pitches, this template ensures your tables aren't just data dumps but strategic stories that inspire confidence.
Core Features Tailored for Business Impact
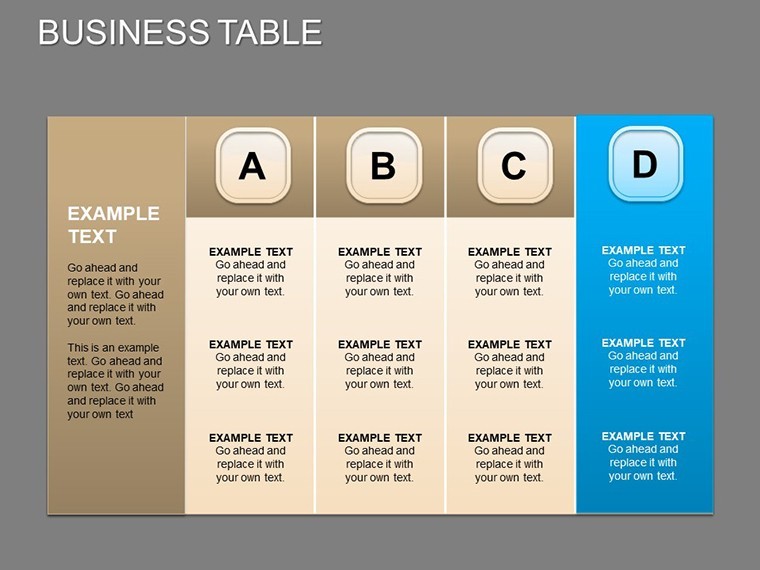
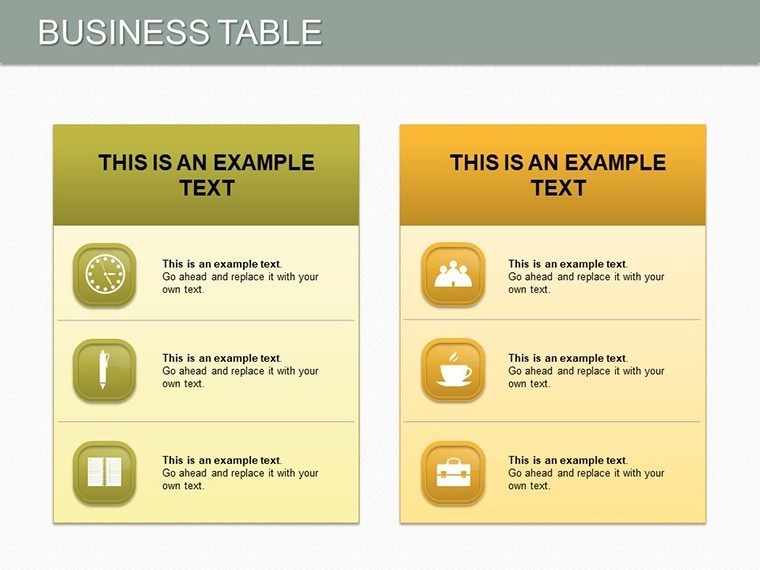
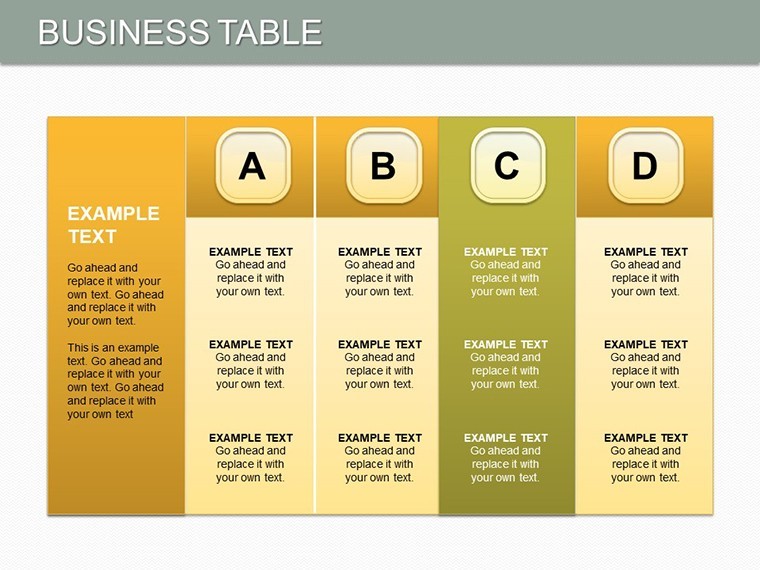
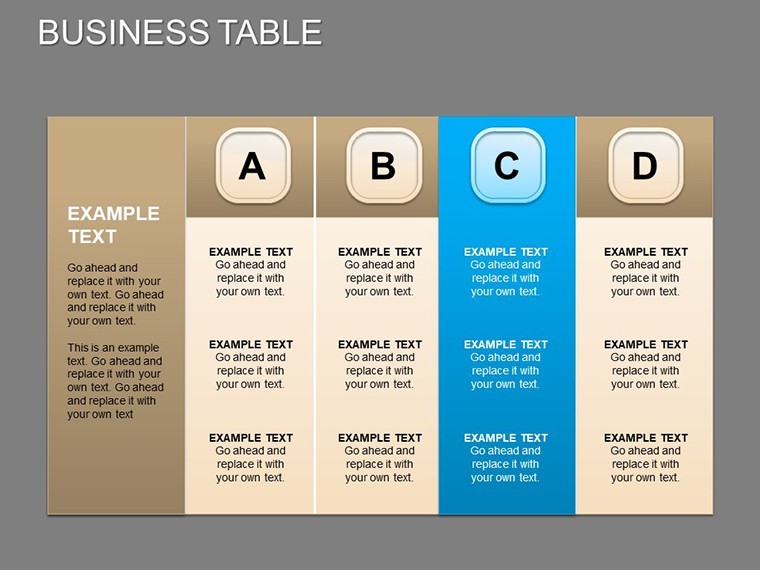
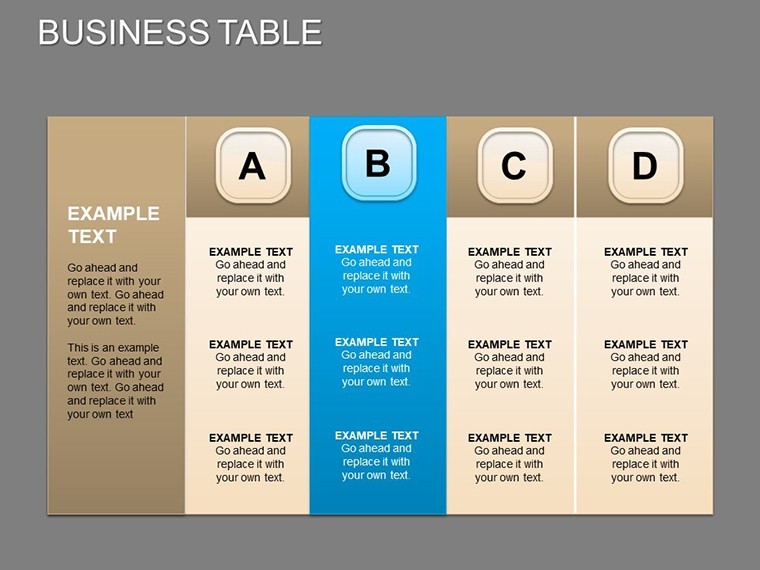
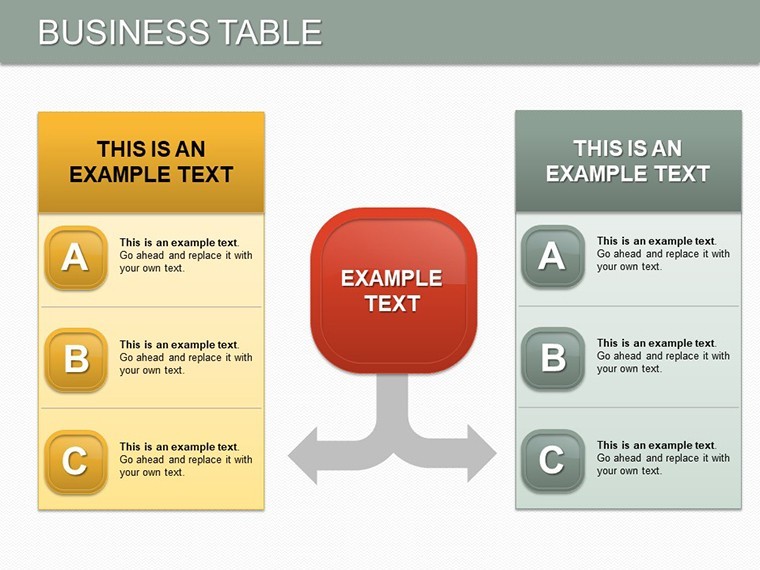
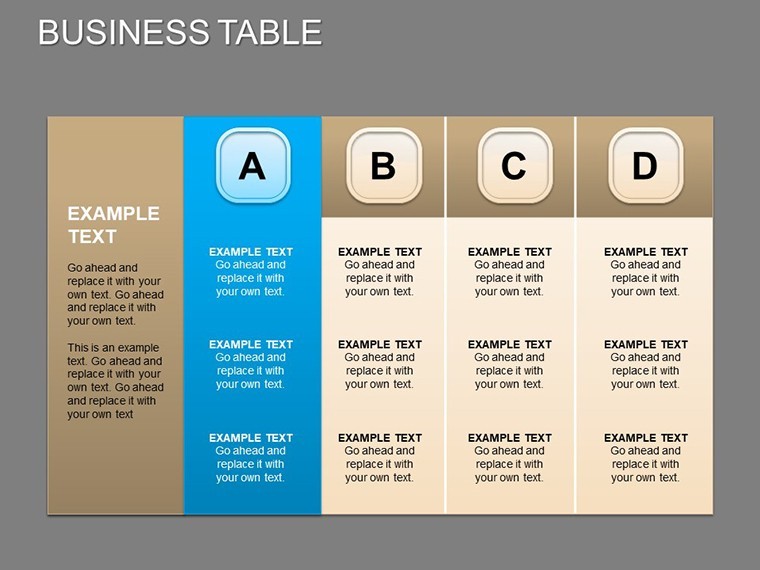
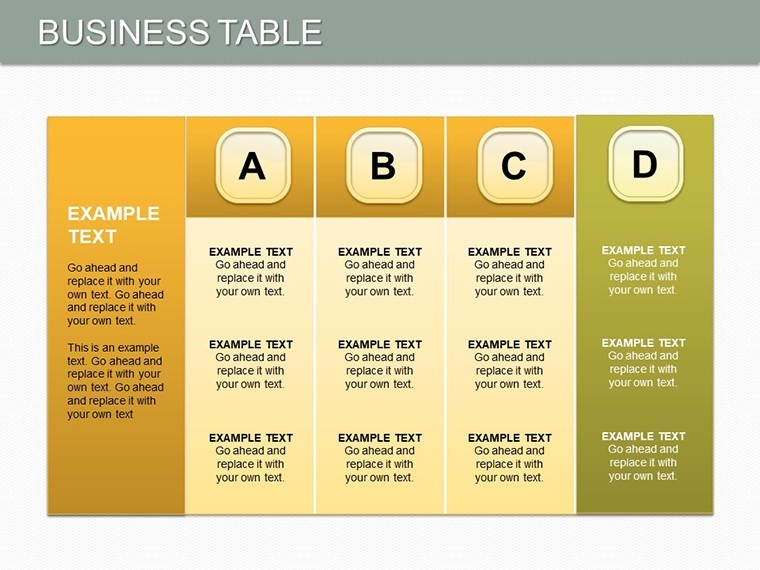
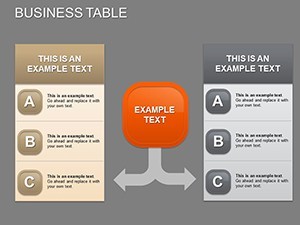
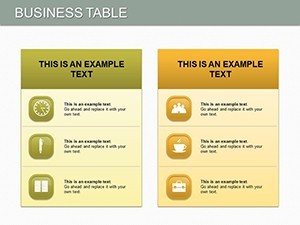
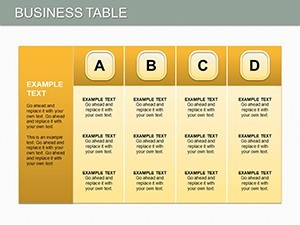
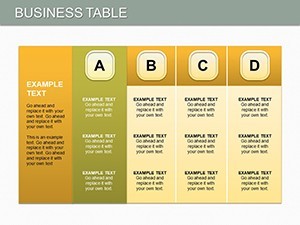
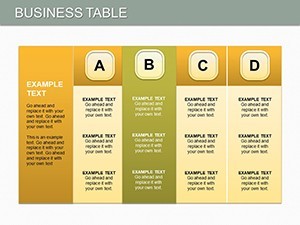
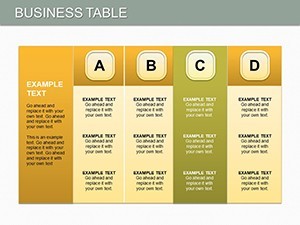
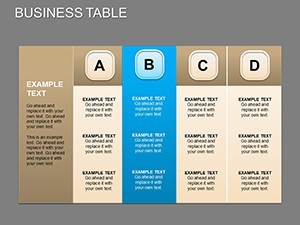
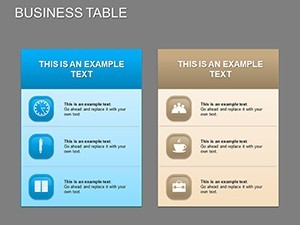
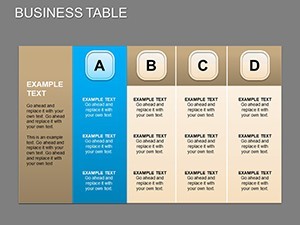
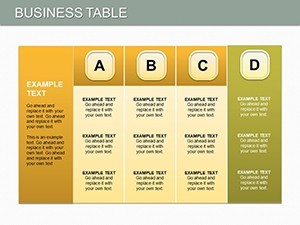
These slides prioritize functionality with clean, grid-based tables that adapt to your content, using subtle shading for hierarchy and bold headers for scannability.
- 25 Editable Slides: Covering overviews, deep dives, and action plans.
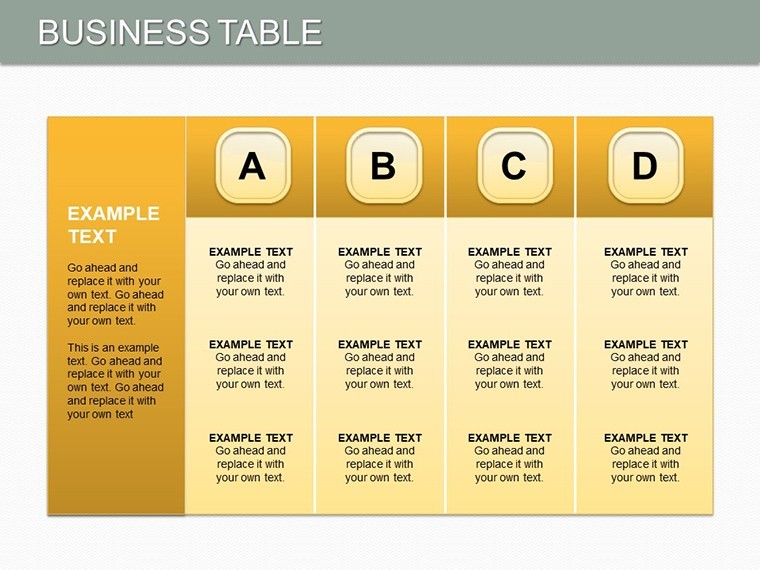
- Table-Centric Design: For compiling areas like finances, operations, and market positioning.
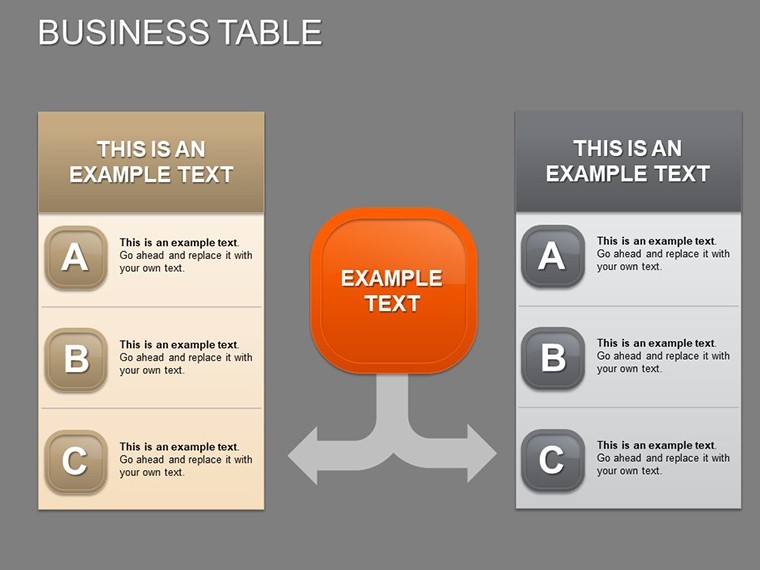
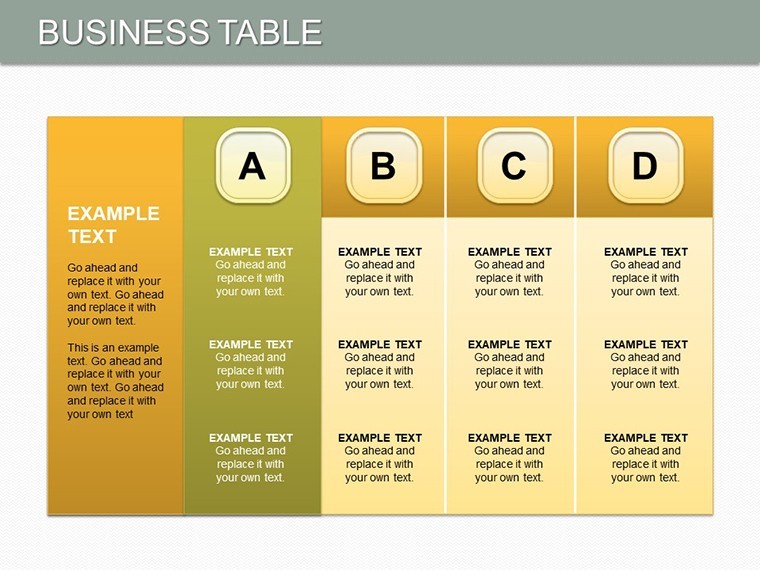
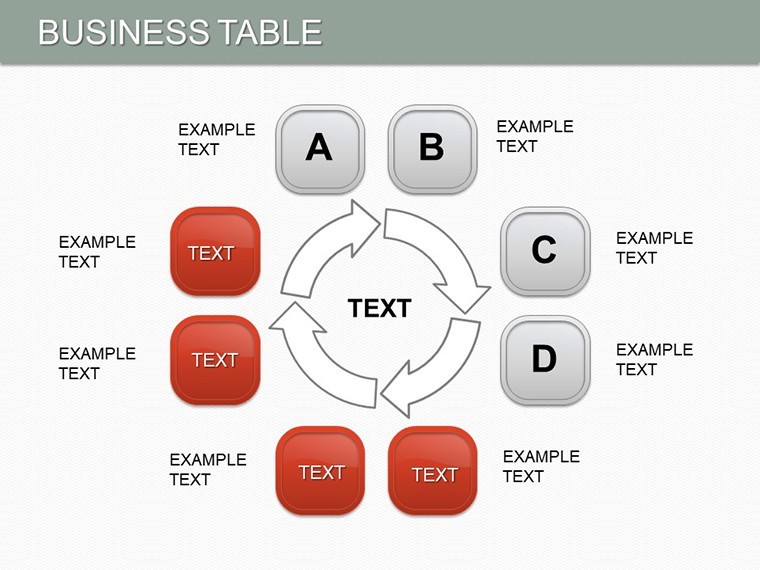
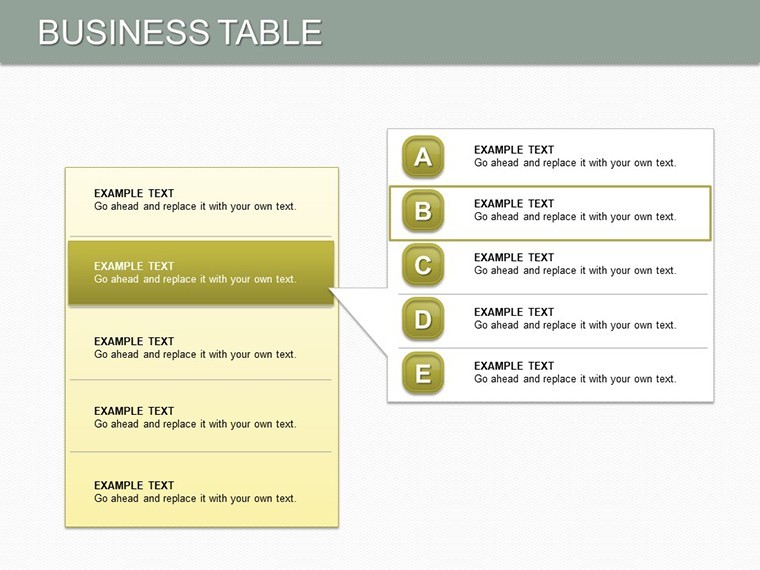
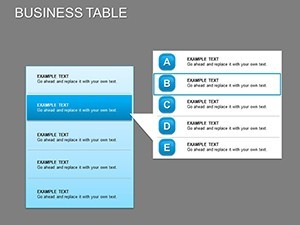
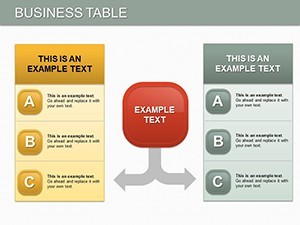
- Strengths/Weaknesses Focus: Pre-formatted SWOT tables with expandable rows.
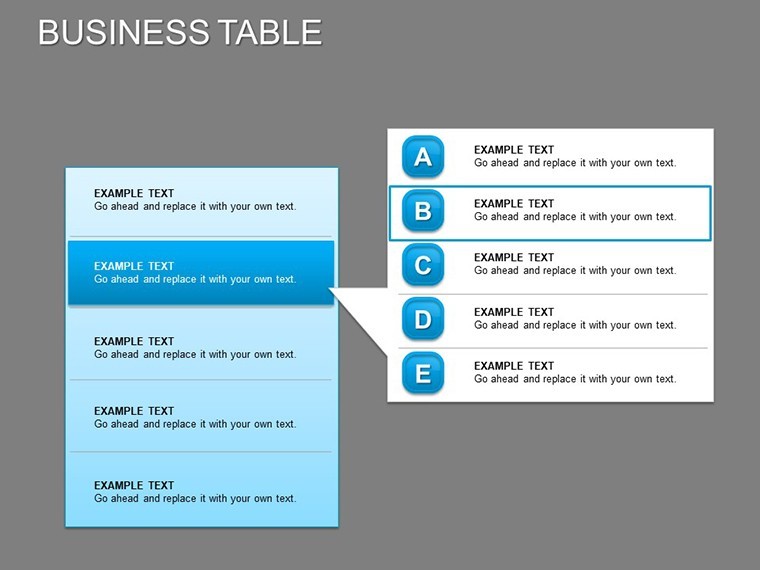
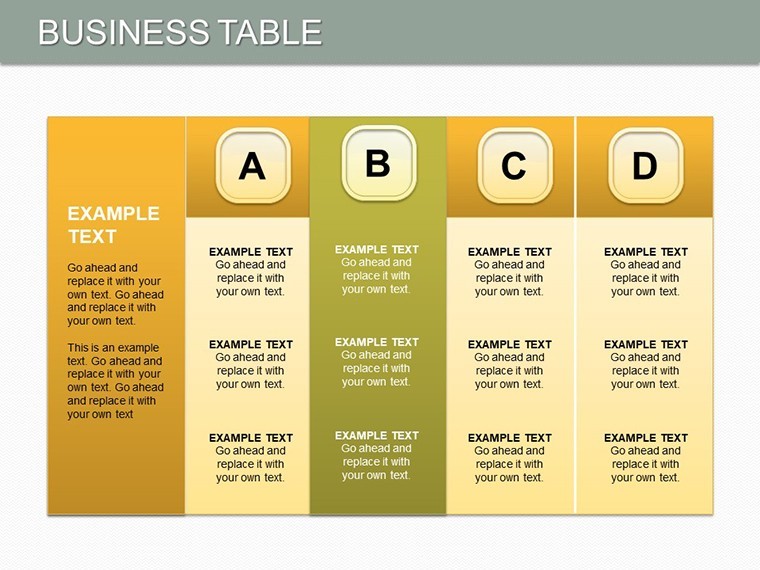
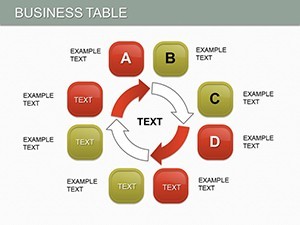
- Investor-Friendly: Metrics tables with formulas for quick calculations.
Standing out from scattershot tools, this template's uniformity speeds up assembly, ideal for time-strapped leaders preparing for venture capital meetings.
Use Cases That Drive Business Growth
Launching a new venture? Use tables to outline market entry strategies, detailing pros and cons. For expansions, chart resource allocations, showing how investments yield returns.
- Investor Attractions: Tables summarizing financials and projections to build credibility.
- Credit Applications: Structured data on assets and liabilities for lender reviews.
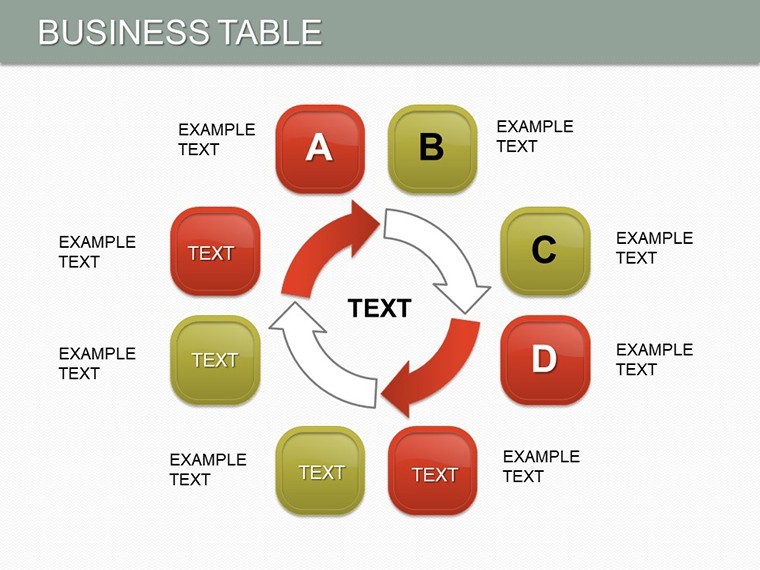
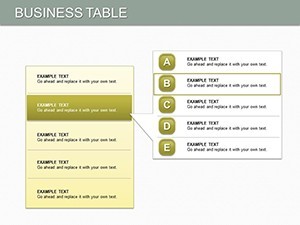
- Company Development: Track KPIs in timeline tables, visualizing progress milestones.
In practice, firms using table-heavy presentations like this have seen 15% higher engagement in strategy sessions, per business communication studies, as they facilitate precise discussions.
Slide Insights: From Foundation to Finish
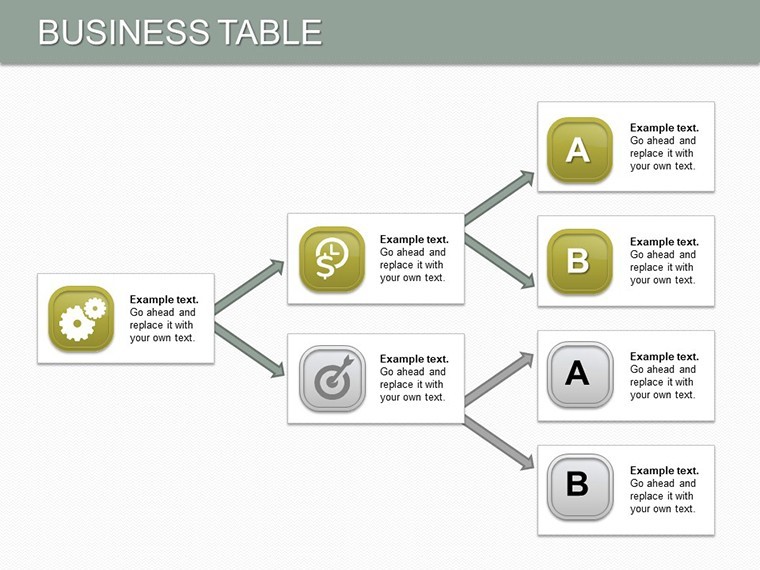
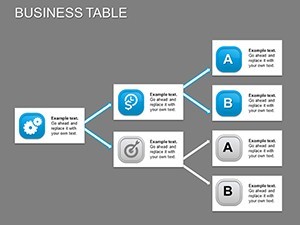
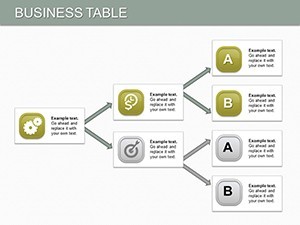
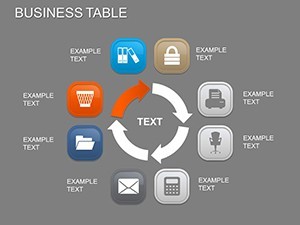
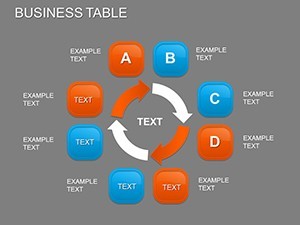
Slide 0 introduces with a high-level business overview table. Slides 1-8 detail core tables for strengths and weaknesses, with sortable columns for prioritization. Mid-slides (9-18) expand to scenario planning, like expansion roadmaps with embedded charts.
Final slides (19-24) conclude with summary tables and calls-to-action. Tip: Hyperlink cells to appendices for interactive depth, enhancing Keynote's capabilities for live demos. This flow guides viewers from context to commitment.
Optimization Tips for Professional Delivery
Import from Excel for auto-population, then refine fonts for brand consistency. Limit rows to 8-10 per table to avoid overload, emphasizing key figures. This approach not only saves time but elevates your authority in high-stakes environments.
Valued by growth-oriented pros, it turns raw business intel into polished arguments that propel forward momentum.
Launch Your Business Vision
Structure your path to prosperity - get the Business Tables Keynote Charts today and table up presentations that close deals and open doors.
Frequently Asked Questions
Q: How versatile are the tables for different business sizes?A: Highly - scale from solo ventures to enterprises with adjustable row/column setups.
Q: Can I integrate financial formulas?A: Yes, Keynote supports basic calculations; link to external sheets for advanced needs.
Q: Is it optimized for investor decks?A: Tailored yes, with clean designs that highlight growth potential clearly.
Q: What about mobile viewing?A: Keynote compatibility ensures crisp tables on iPads for on-the-go reviews.
Q: How to customize for branding?A: Adjust colors, logos, and fonts via Keynote's style tools effortlessly.
Q: Does it include SWOT examples?A: Pre-built SWOT tables ready for your data, saving setup time.