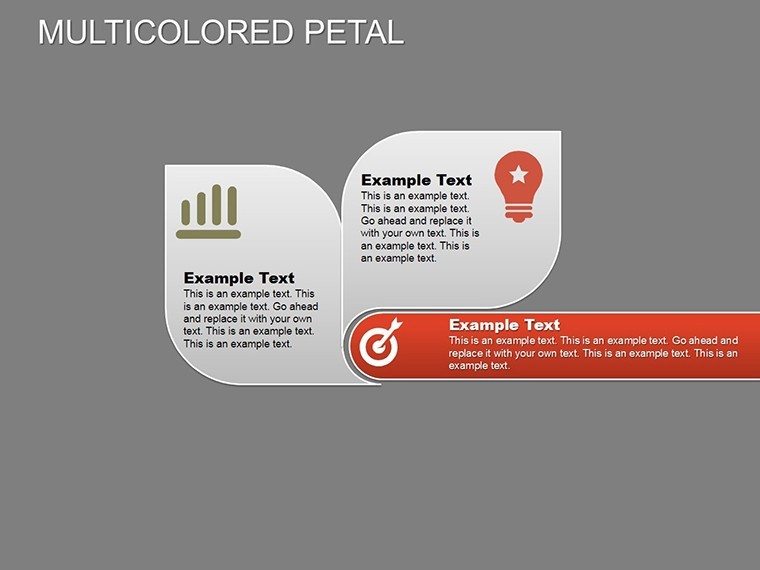
Multicolored Petal Keynote Charts: Blooming Insights for Analysis


Type: Keynote Charts template
Category: Analysis
Sources Available: .key
Product ID: KC00166
Template incl.: 23 editable slides
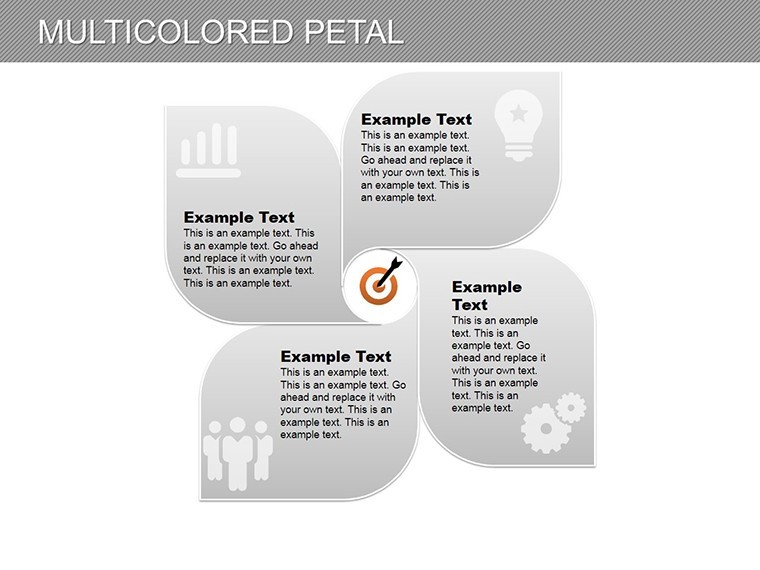
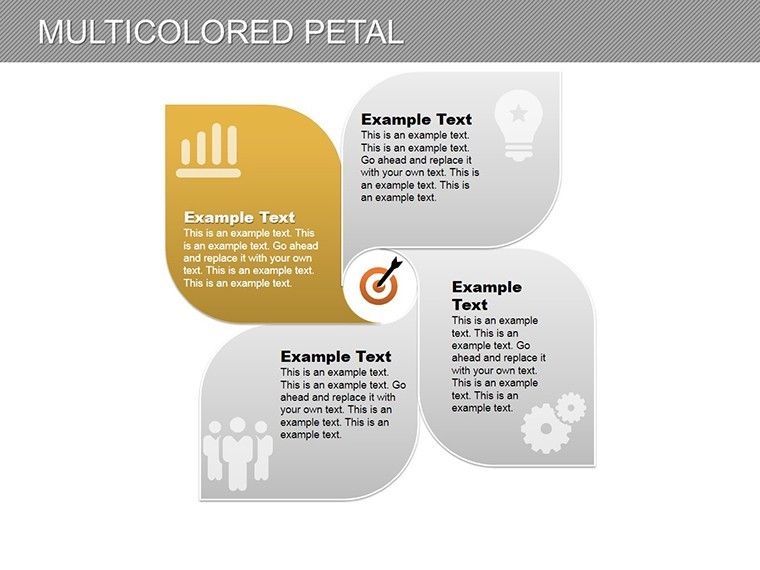
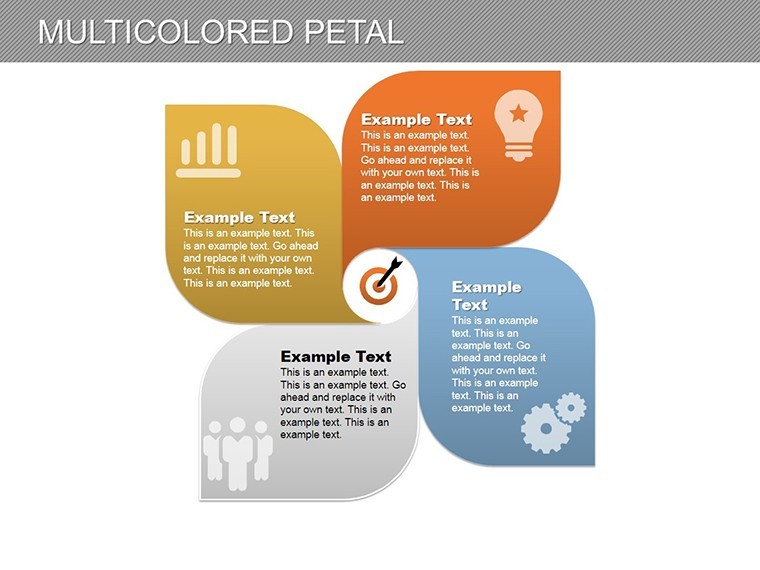
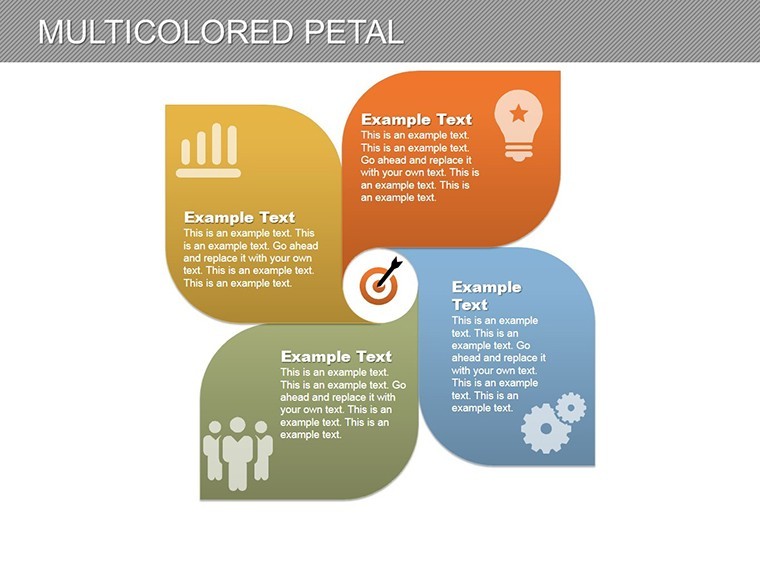
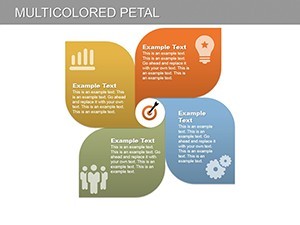
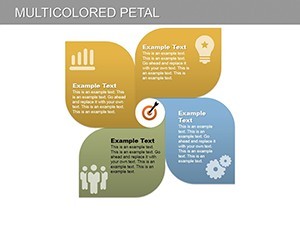
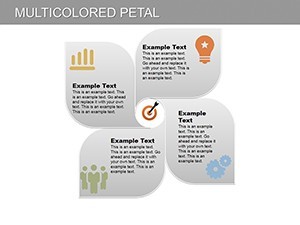
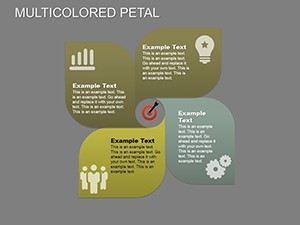
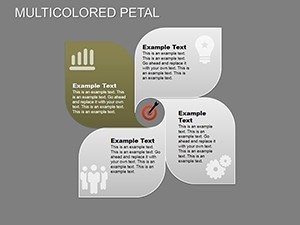
When dissecting work processes or project outcomes, the right visuals can illuminate patterns that words alone miss. Enter the Multicolored Petal Keynote Charts template - a vibrant collection of 23 editable slides designed for analysts, project managers, and researchers who demand precision in their presentations. These petal-inspired charts, resembling blooming flowers, offer a fresh take on radial data visualization, ideal for breaking down multifaceted datasets like workflow efficiencies or market trends.
Envision presenting a quarterly analysis where each petal unfurls to reveal departmental contributions, captivating your team with color-coded clarity. Optimized for Keynote yet effortlessly adaptable to PowerPoint and Google Slides, this template supports collaborative environments. From academic reports to corporate audits, it helps you uncover and communicate insights that inspire action.
Core Features Driving Analytical Depth
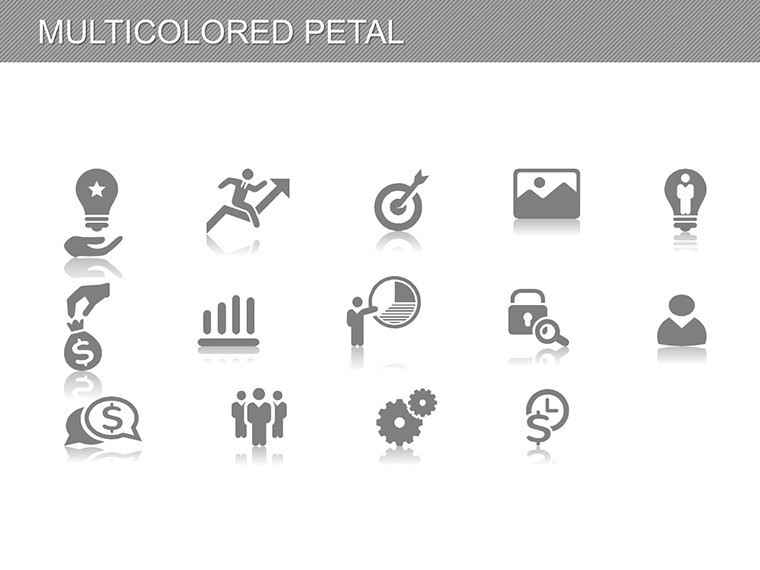
This template's petal motifs aren't just eye-catching; they're functional powerhouses. Editable parts allow for expansive text integration, ensuring no detail gets lost in translation.
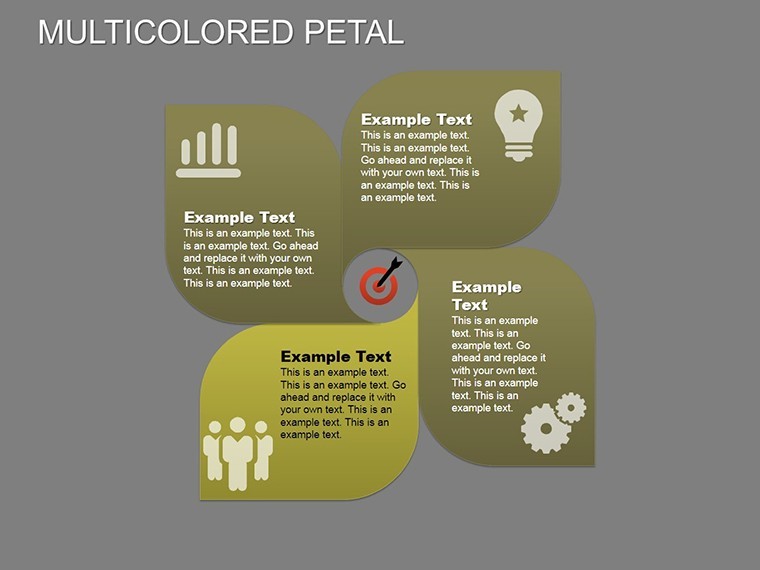
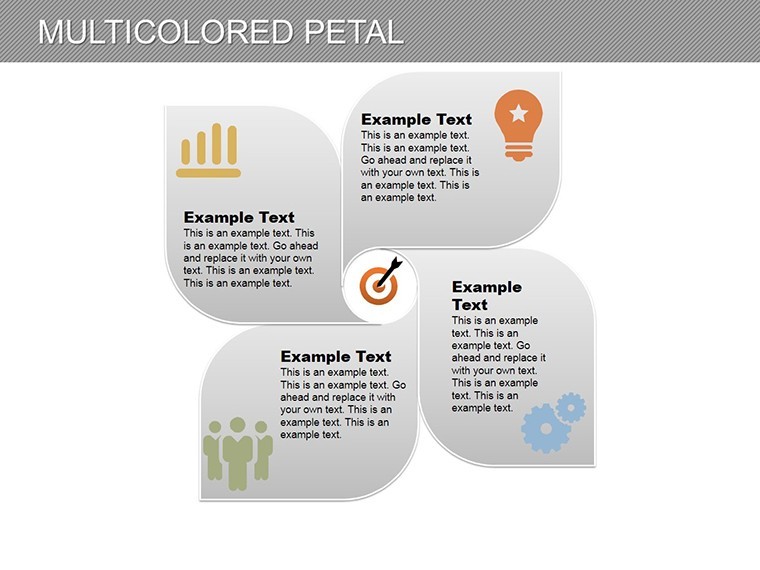
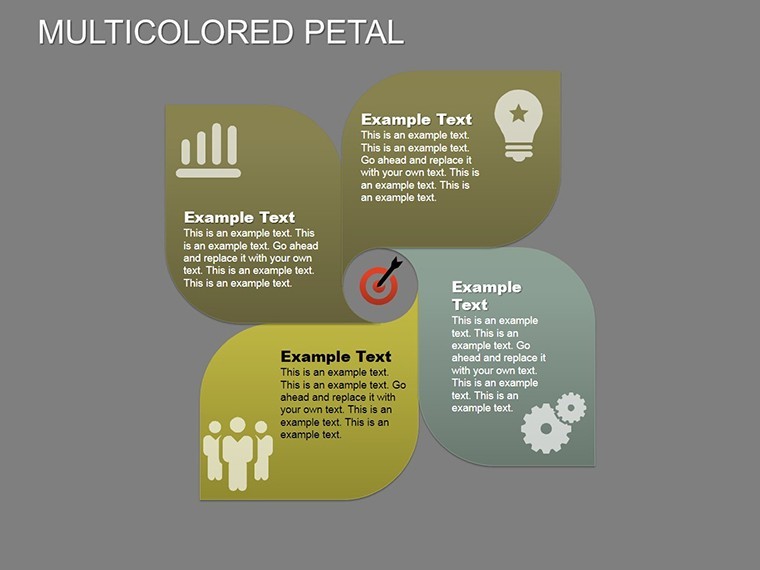
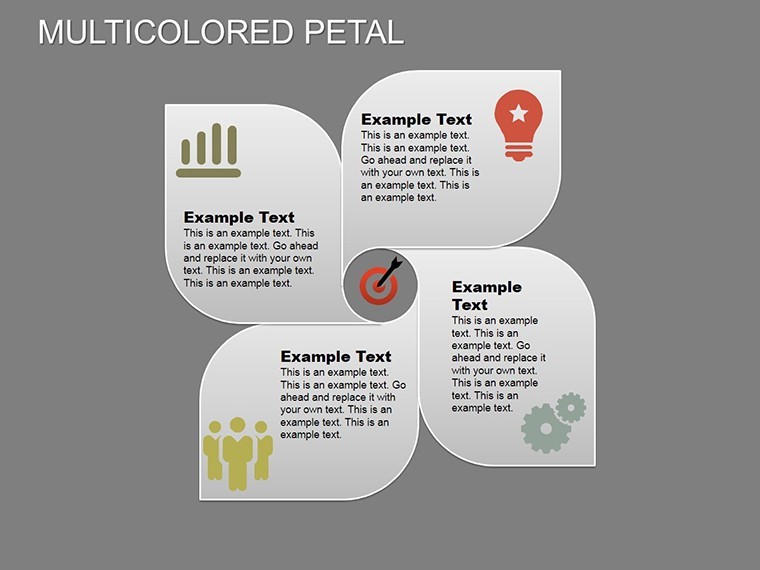
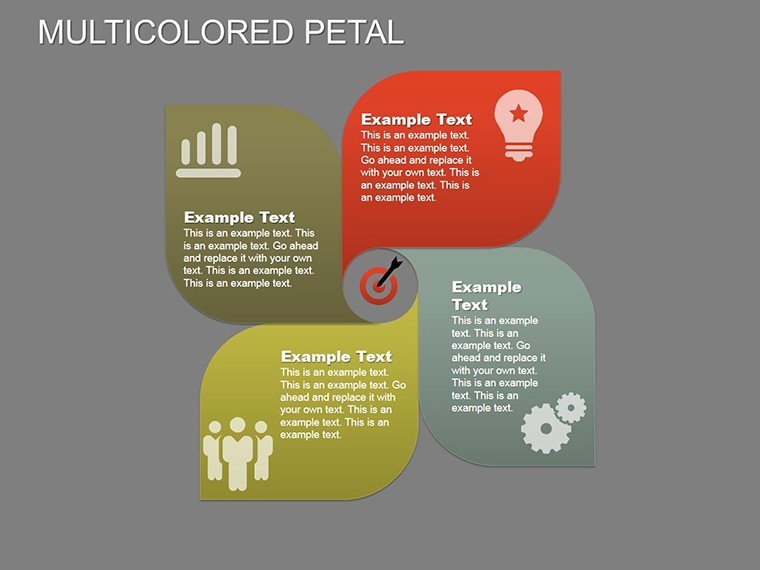
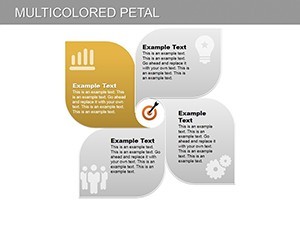
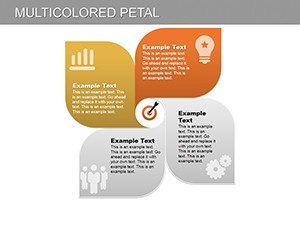
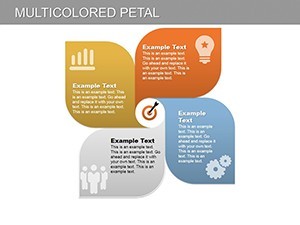
- Vibrant Multicolored Schemes: A palette of 20+ hues for segmenting data, evoking growth and diversity in visuals.
- Wide Editable Zones: Petals expand to accommodate detailed annotations, perfect for SWOT analyses or process mappings.
- Seamless Integration: Compatible across platforms, with preserved layering for complex petal overlaps.
In contrast to linear bar charts, petals provide a holistic view, making interconnections obvious at a glance - a boon for holistic thinkers in fields like environmental planning.
A Closer Look at the 23 Slides
The slides progress from broad overviews to granular details, fostering a logical analytical journey:
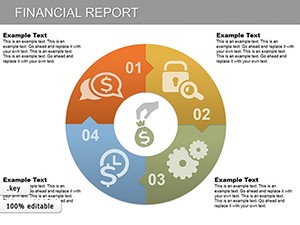
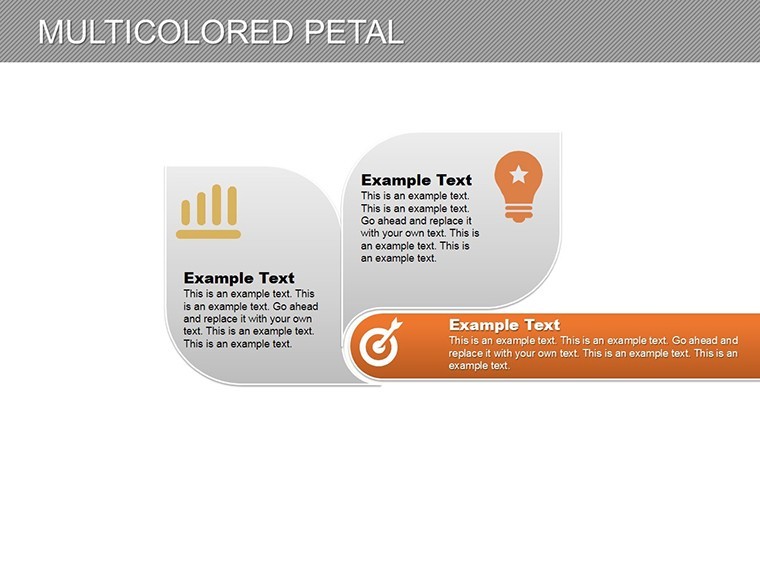
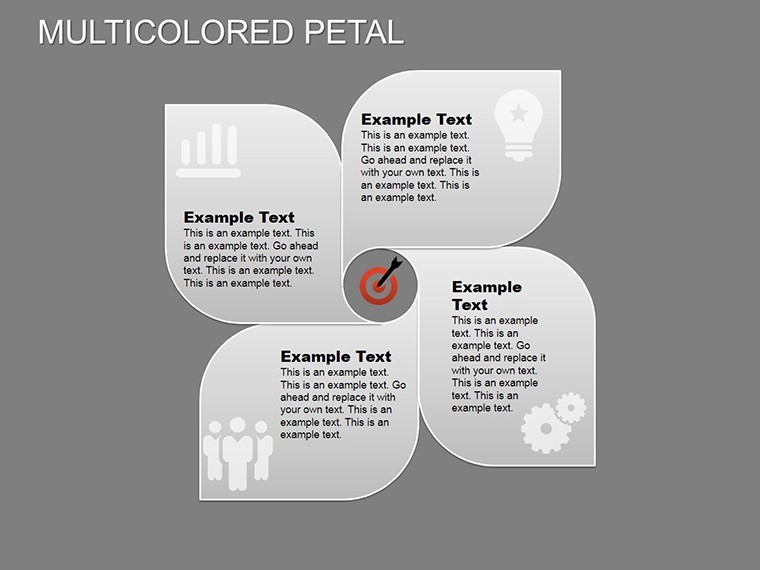
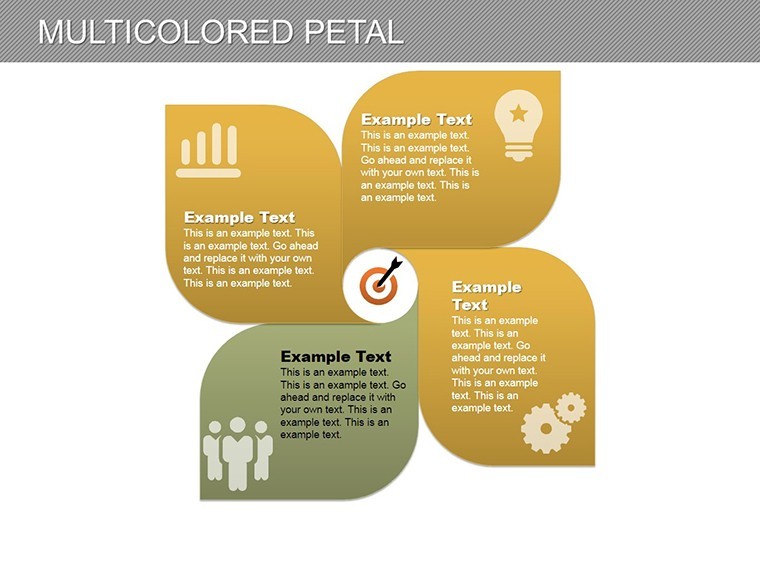
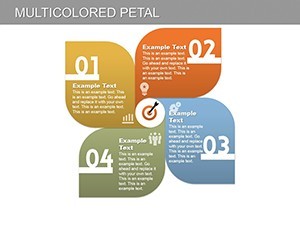
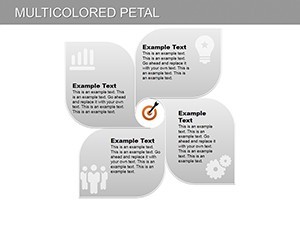
- Introductory Petal Hub: Central design for topic introduction, with outer petals as placeholders for key categories.
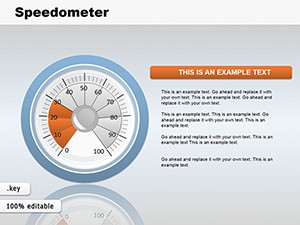
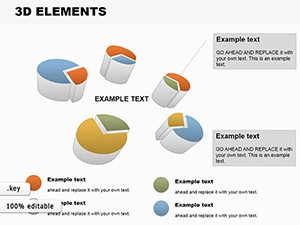
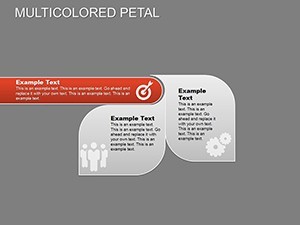
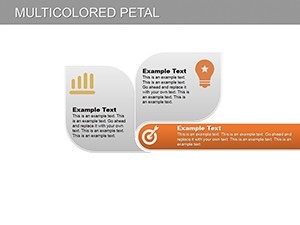
- Basic Analysis Petals (Slides 2-7): Single-layer blooms for simple metrics, like expense breakdowns.
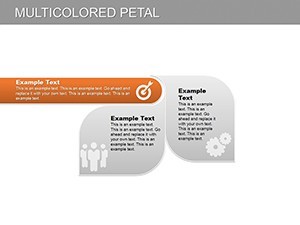
- Layered Workflow Petals (8-14): Multi-petal structures for process flows, editable for stages in project timelines.
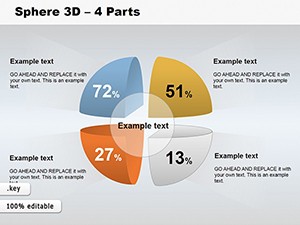
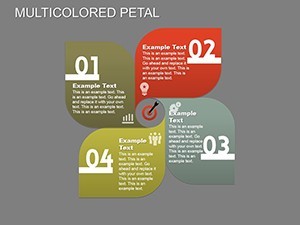
- Comparative Blooms (15-19): Overlapping petals for side-by-side evaluations, such as before/after scenarios.
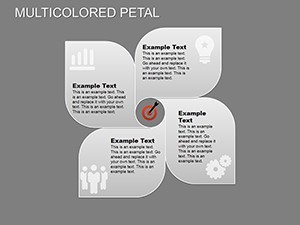
- Insight Summary Petals (20-22): Consolidated designs highlighting trends, with space for recommendations.
- Final Call-to-Action Slide: A blooming close with petal icons reinforcing key findings.
A case in point: An operations consultant used these for a supply chain audit, with petals representing vendor performances - leading to a 15% efficiency gain recommendation that was adopted firm-wide.
Tailored Use Cases for Everyday Analysis
Versatility defines this template. In business intelligence, populate petals with KPI data for dashboard-like slides, integrating with tools like Tableau exports. For creative industries, like graphic design firms, use them to analyze client feedback loops, aligning with agile review practices.
Draw from real scenarios, such as urban development projects where petals map stakeholder inputs, adhering to planning standards for transparent reporting. Feedback highlights a 35% reduction in slide creation time, with the wide editable areas allowing for narrative depth without clutter.
Pro workflow: Start in Keynote for design finesse, then share via Google Slides for team edits. Tip: Layer subtle shadows on petals for 3D depth, enhancing perceived complexity without added effort.
Why Petals Outshine Traditional Charts
The organic shape fosters intuitive understanding, especially for cyclical data like seasonal analyses. It's a step up from generic templates, offering thematic unity that professionalizes any deck.
Interactive previews let you test petal expansions, with guided CTAs like "Expand Your Analysis Here" for user-friendly navigation.
Cultivate Deeper Insights Now
Let your data flourish with the Multicolored Petal Keynote Charts. Download today and watch your analyses come alive - transform routine reports into revelations.
Frequently Asked Questions
What types of analysis are these best for?
Ideal for radial or cyclical data, like workflows, SWOT, or performance breakdowns.
Can petals be resized independently?
Yes, each petal is fully editable, allowing custom sizing and text additions.
Is it compatible with other software?
Fully, exporting to PowerPoint and Google Slides with layout integrity.
How many color options are there?
Multicolored with 20+ schemes, adjustable for accessibility and branding.
Are there templates for specific industries?
Adaptable, with examples for business, planning, and research fields.
Does it include animation options?
Basic blooms can be animated via Keynote tools for dynamic reveals.