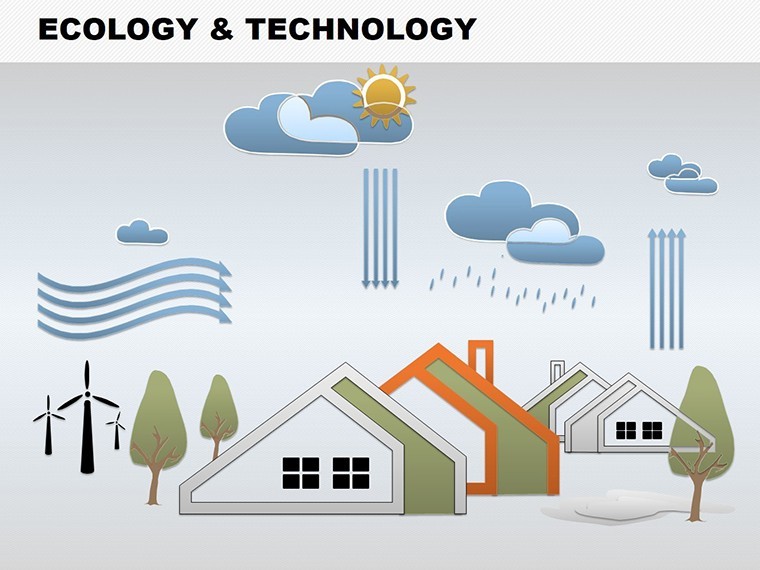
Ecology and Technology Keynote Charts: Illustrated Templates for Sustainable Architecture


Type: Keynote Charts template
Category: Illustrations
Sources Available: .key
Product ID: KC00146
Template incl.: 17 editable slides
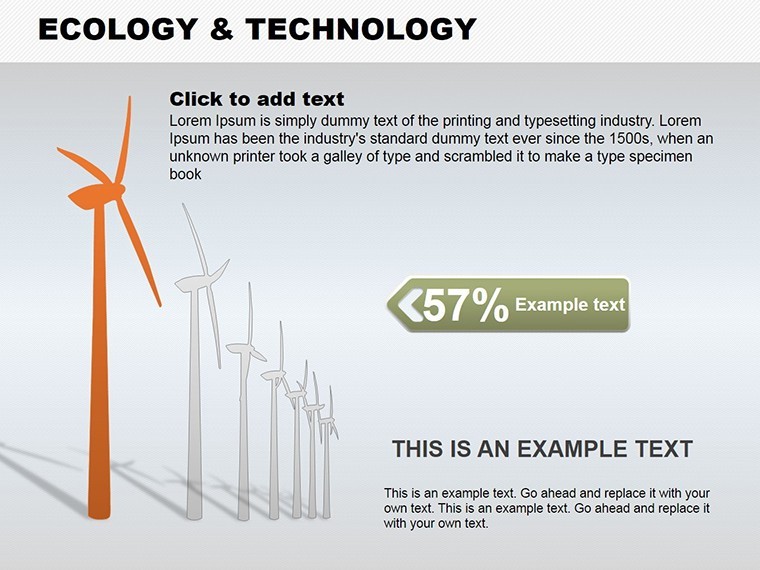
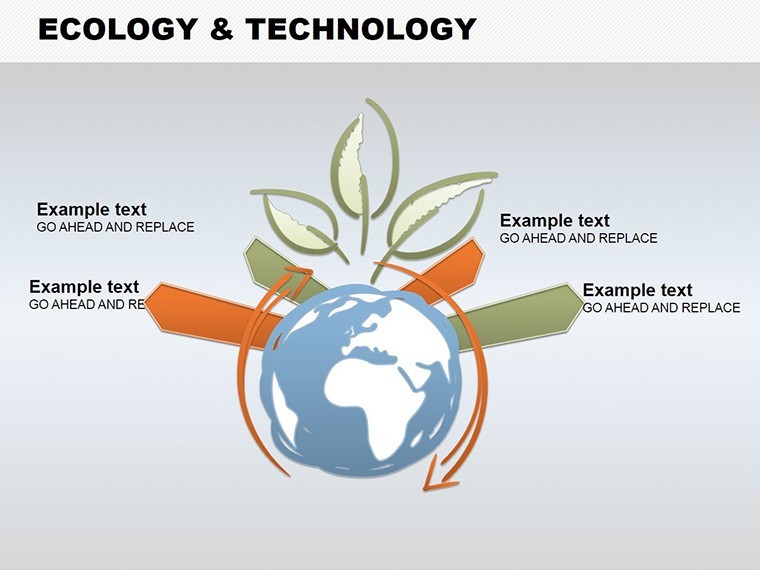
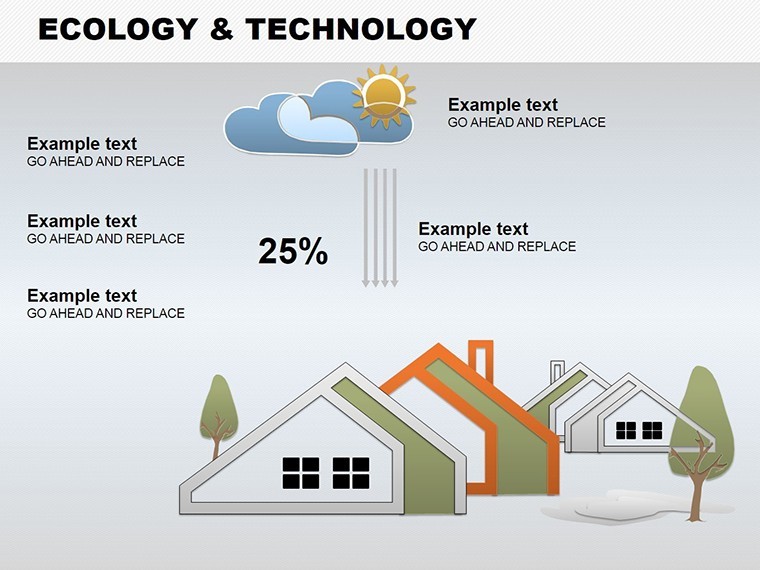
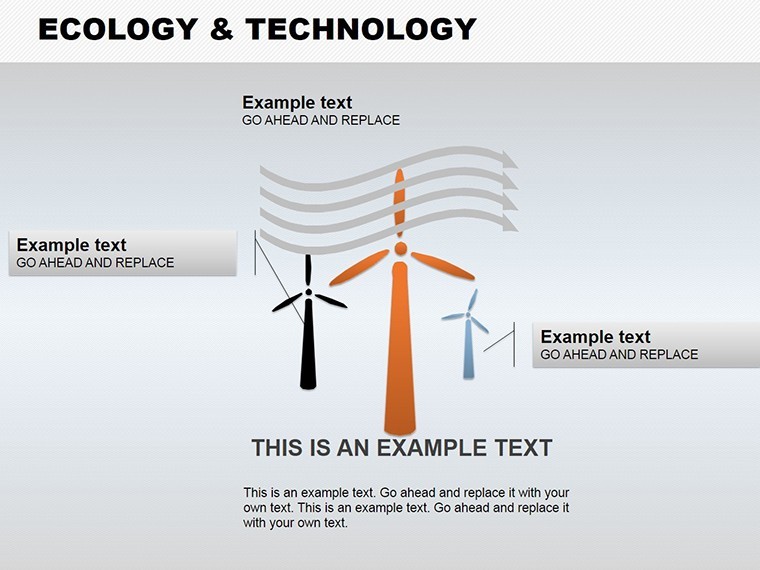
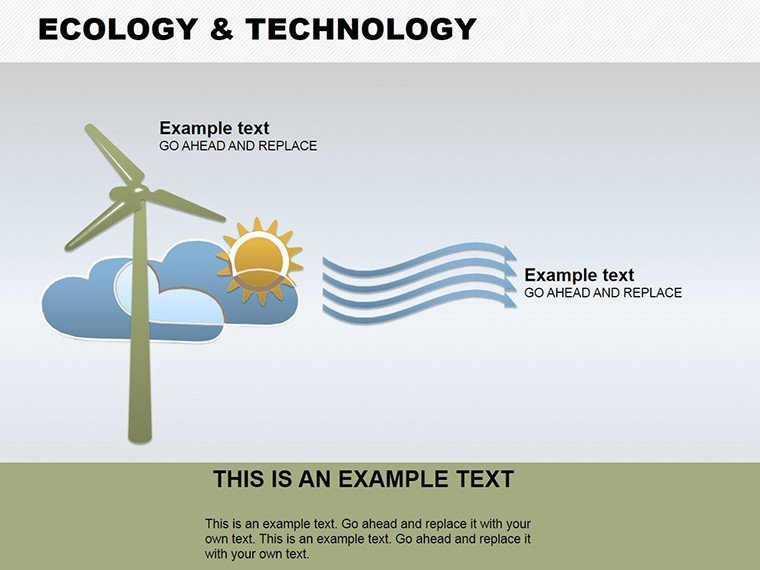
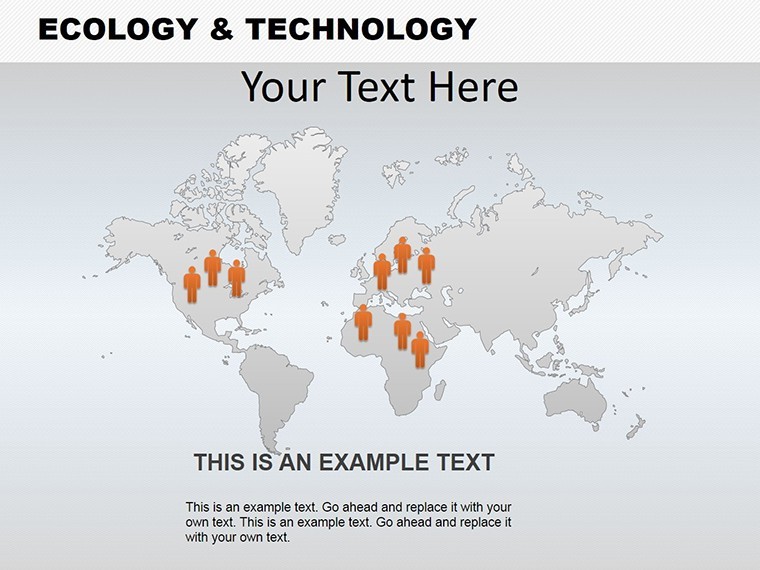
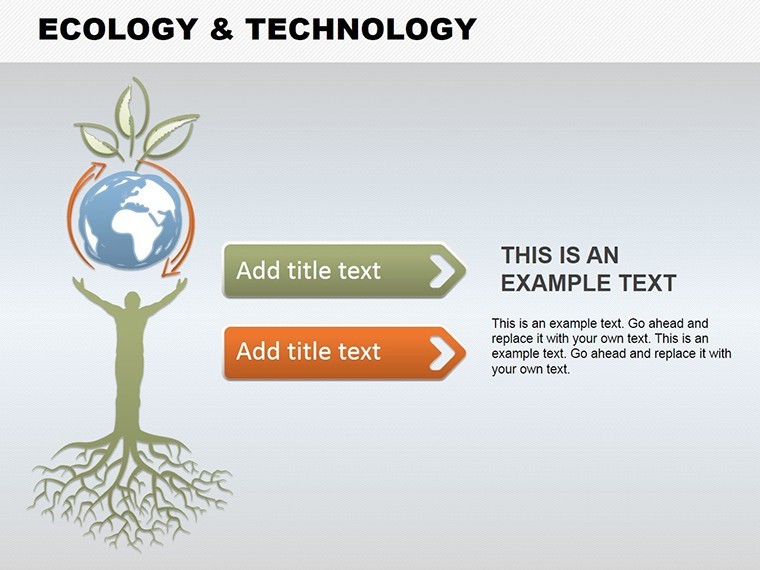
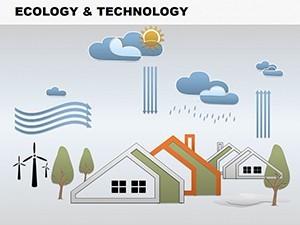
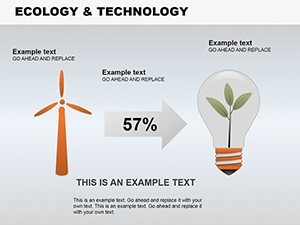
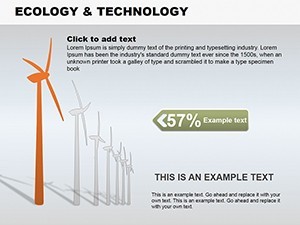
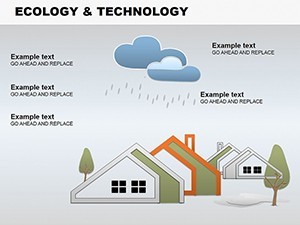
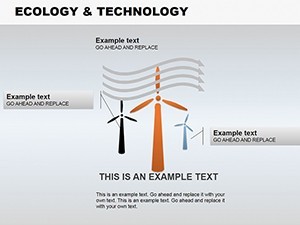
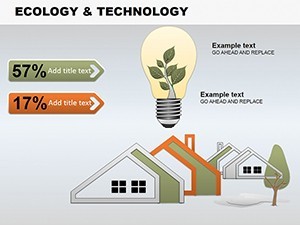
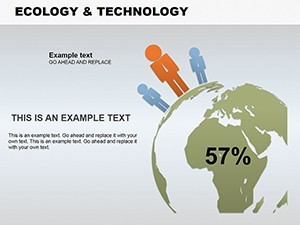
As architecture increasingly intertwines ecology and technology, presenting these fusions demands visuals that are both stylish and substantive. Our Ecology and Technology Keynote Charts template delivers with 17 editable illustration slides, perfect for showcasing green tech integrations like smart buildings or biophilic designs. Aimed at architects pioneering sustainable futures, it adapts to any presentation, serving as a foundation for your innovative narratives.
Visualize illustrating a solar-integrated facade: Eco-icons blend with tech diagrams, highlighting synergies. Aligned with AIA sustainability standards, this tool helps you communicate complex eco-tech balances, drawing from cases like the Bullitt Center's net-zero achievements.
Core Features Blending Nature and Innovation
These illustrations are cool, versatile, and fully customizable for eco-focused pitches.
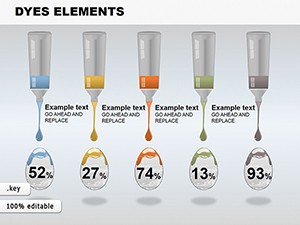
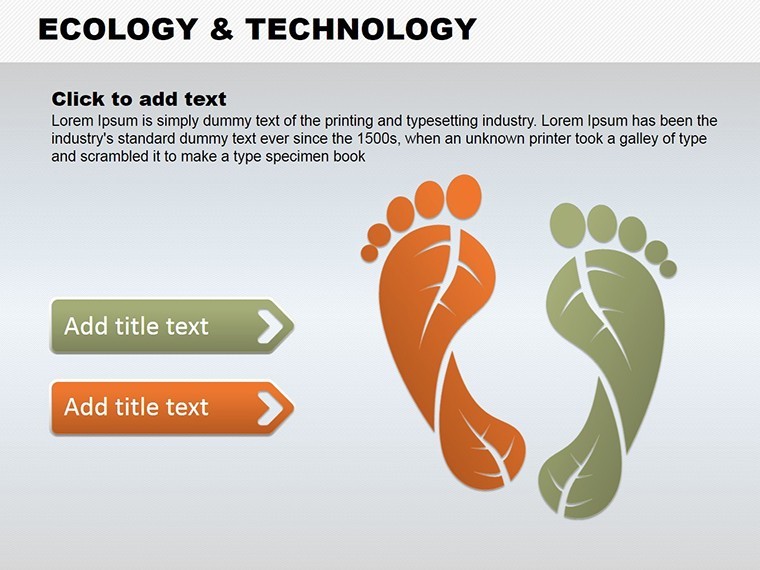
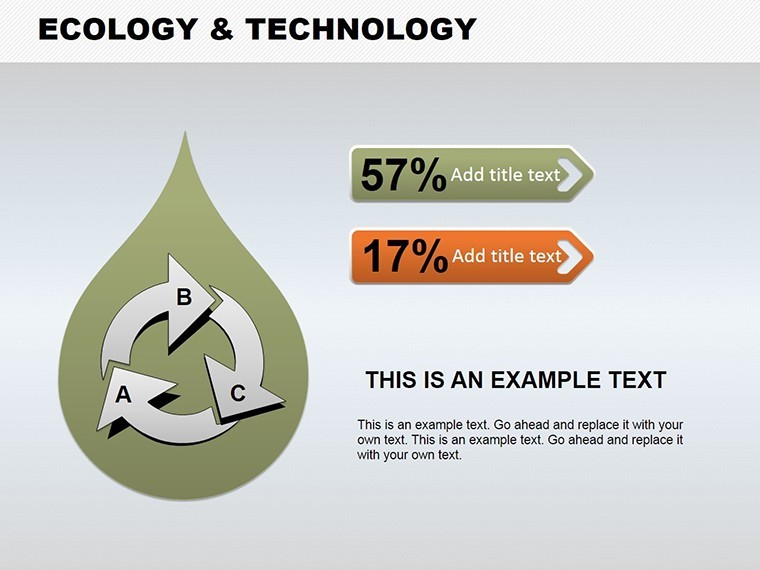
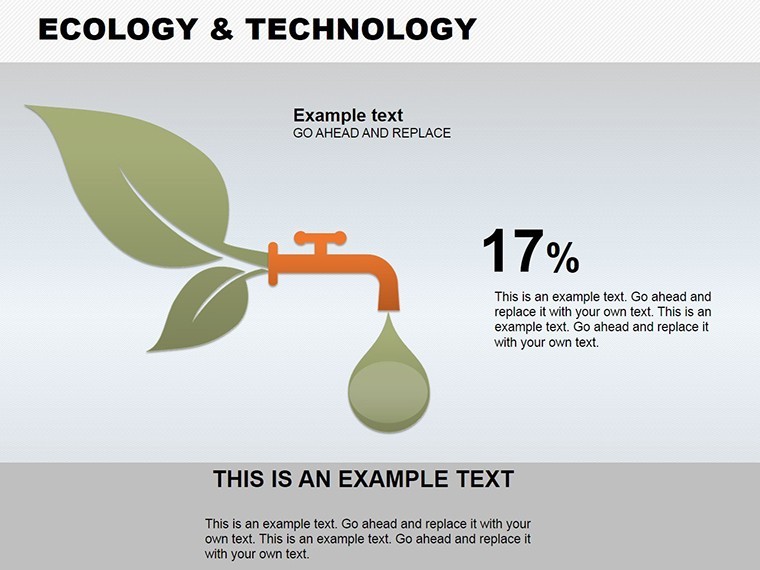
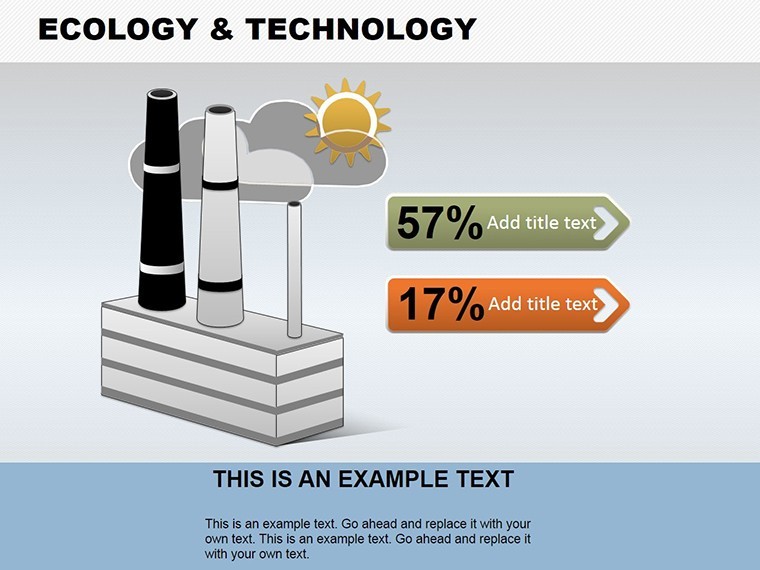
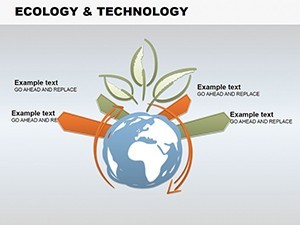
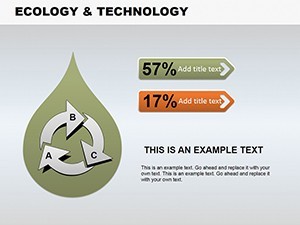
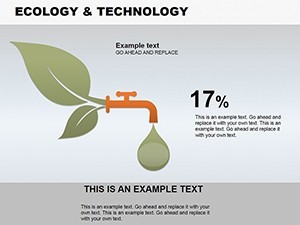
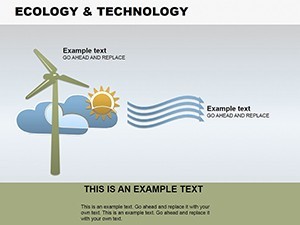
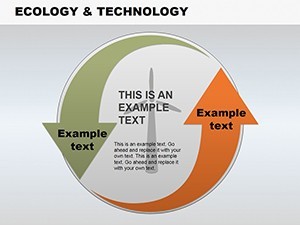
- Illustrative Designs: Stylish eco-tech motifs, from leaves to circuits.
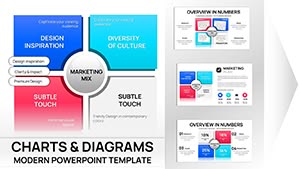
- Adaptable Layouts: Resize, recolor, and rearrange for custom fits.
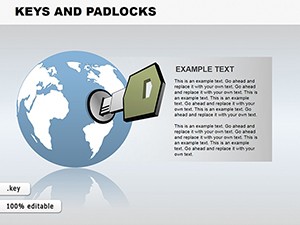
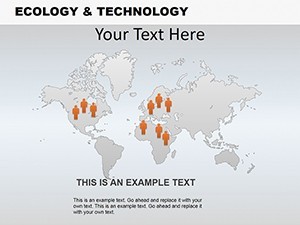
- Icon Libraries: Built-in symbols for ecology and tech themes.
- High-Res Quality: Crisp on all screens, per presentation best practices.
- Keynote Seamlessness: Easy edits and integrations.
LSI integration: "Eco illustrations" and "tech charts" for targeted reach.
Eco-Tech Use Cases in Design
For green retrofits, chart tech-ecology intersections; reference LEED projects.
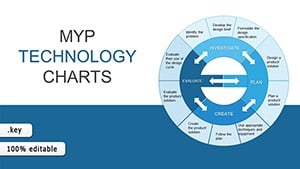
Process: 1. Select illustration. 2. Input eco-data. 3. Customize themes. 4. Add tech overlays. 5. Present sustainably.
Slide Details for Green Visions
Slides 1-6: Basic eco-tech fusions.Slides 7-12: Complex illustrations.Slides 13-17: Interactive for engagements.
Tip: Balance colors for harmony, mimicking natural palettes.
Advantages Over Generic Illustrations
More thematic and adaptable than stock, enhancing eco-narratives.
Tips from Sustainability Experts
Use for AIA CEUs on green tech; inspire with real-world integrations.
Embrace eco-tech - download and illustrate your sustainable path forward.
FAQ
- How stylish are the illustrations?
- Very - modern and cool for professional appeal.
- Adaptable to custom presentations?
- Yes, as a base or standalone.
- For ecology only?
- No, versatile across fields.
- Formats?
- .key with exports.
- Branding ease?
- Quick customizations.
- Animation included?
- Optional for dynamic effects.