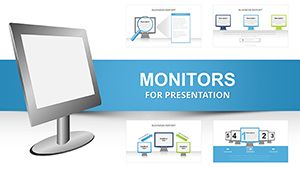
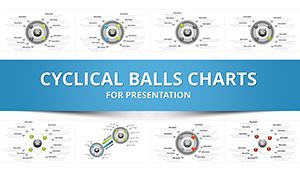
IT Technology Keynote Charts Template - 20 Slides


Type: Keynote Charts template
Category: Illustrations
Sources Available: .key
Product ID: KC00136
Template incl.: 20 editable slides
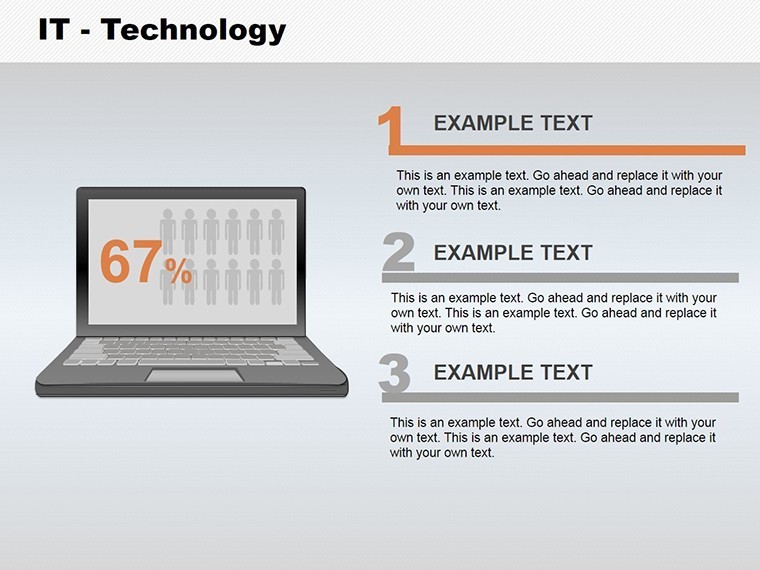
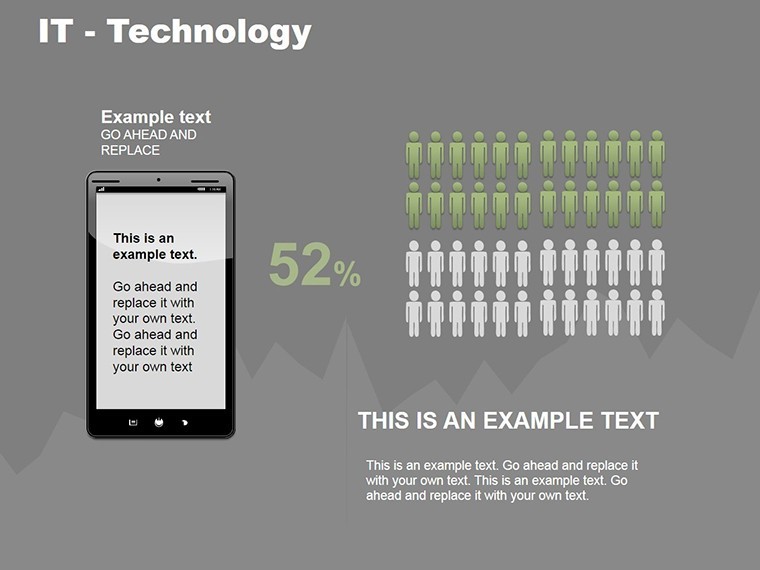
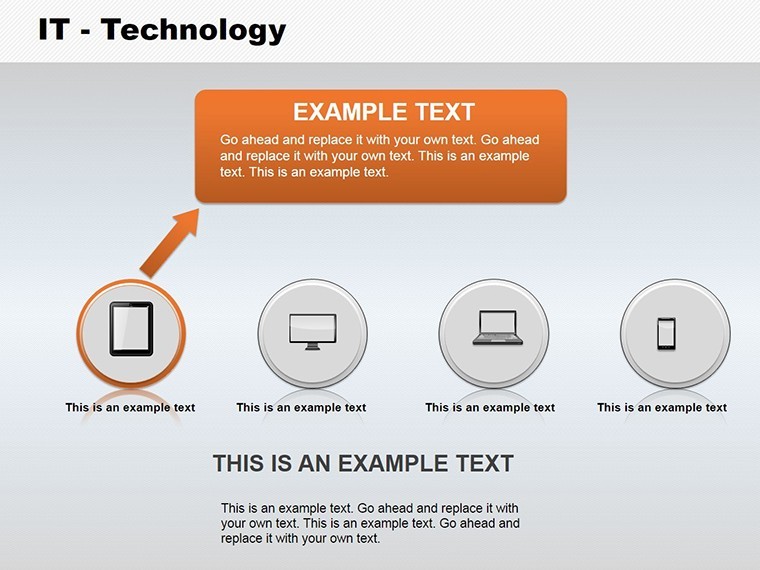
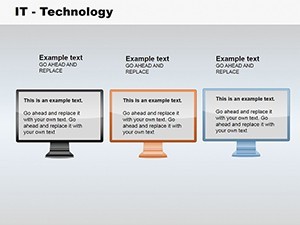
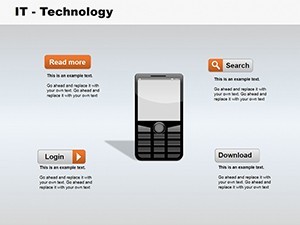
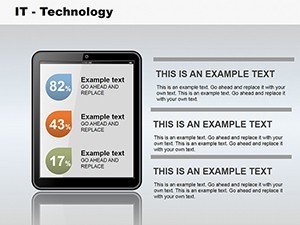
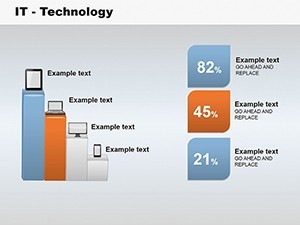
In the ever-evolving realm of IT, conveying complex technologies demands visuals that are as innovative as the ideas they represent. Our IT Technology Keynote Charts template delivers exactly that with 20 editable slides, crafted for IT professionals, developers, and tech educators. Featuring vector shapes that allow infinite scaling and customization, this template goes beyond static images - it's a dynamic toolkit for illustrating network architectures, data flows, and innovation timelines. Perfect for keynote speeches at tech conferences or internal training sessions, it includes custom animations to bring concepts like cloud migrations to life. Users can easily alter colors, sizes, and texts to fit specific narratives, ensuring presentations that not only inform but also inspire. Compatible exclusively with Keynote on Mac, this template bridges the gap between technical depth and audience accessibility, helping you articulate IT strategies with confidence and creativity. Whether demystifying AI algorithms or mapping cybersecurity protocols, it's your gateway to presentations that resonate in the digital age.
Harnessing Vector Power for Tech Visuals
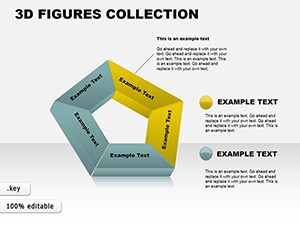
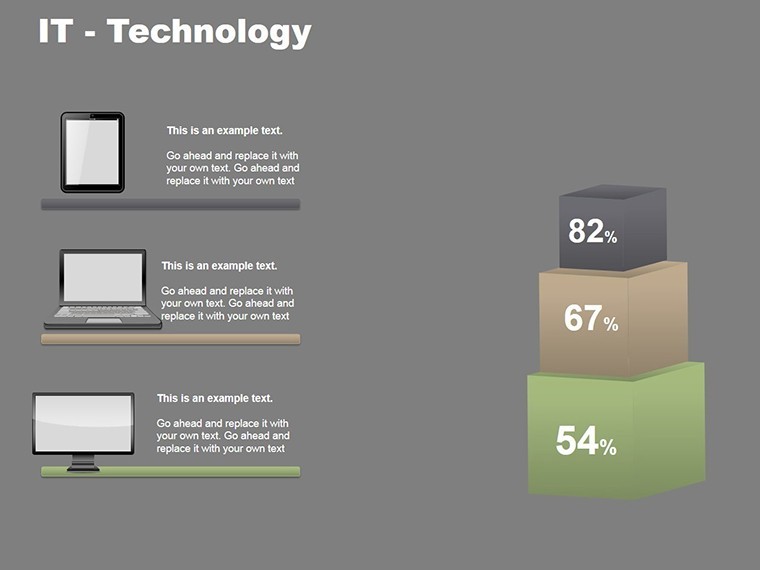
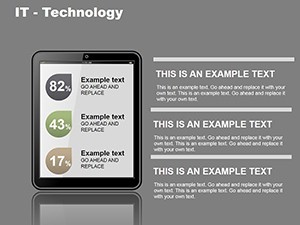
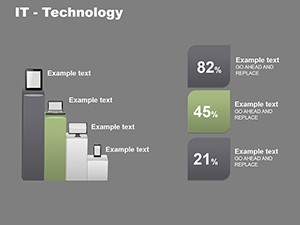
The template's vector-based design is a game-changer for IT presentations, where precision matters. Each slide, from network diagrams on slide 3 to process flows on slide 12, uses editable shapes that maintain clarity at any zoom level. This is crucial for detailing intricate systems, like blockchain ledgers or API integrations, without distortion. Inspired by standards from IEEE computing visuals, we've included PNG icons for quick additions, such as server racks or data packets. Tech leads can customize animations - fade-ins for layer reveals in stack architectures - enhancing storytelling. Unlike basic Keynote charts, which often pixelate, these vectors ensure professional polish, as seen in case studies from companies like Cisco, where similar tools streamlined solution pitches, boosting client understanding by 40%.
Standout Features for IT Pros
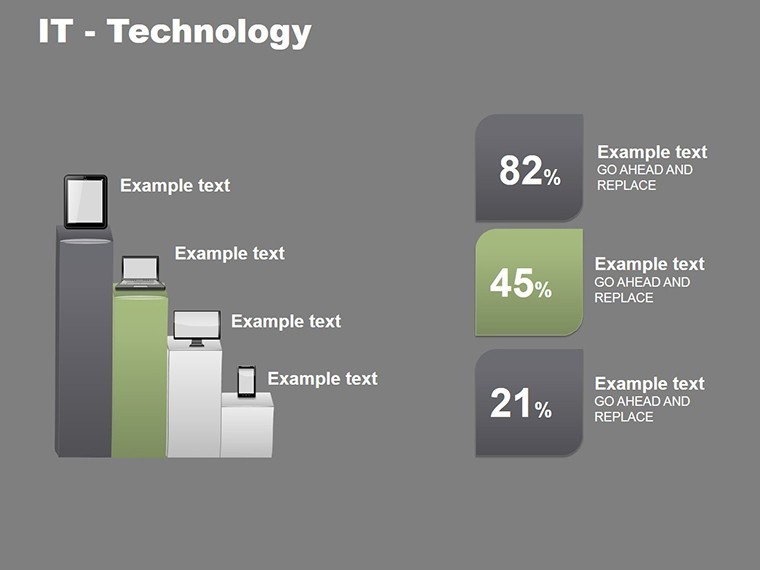
- Vector Customization: Change sizes, colors, and shapes without quality loss, ideal for adapting to project specs.
- Animation Integration: Built-in effects like path animations for data transfer simulations.
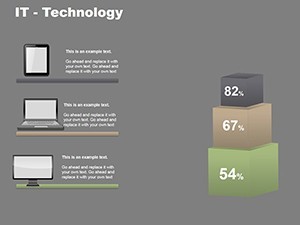
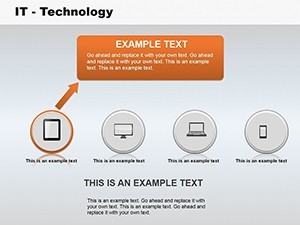
- Icon Library: Included vector icons and PNGs for tech elements like clouds, gears, and circuits.
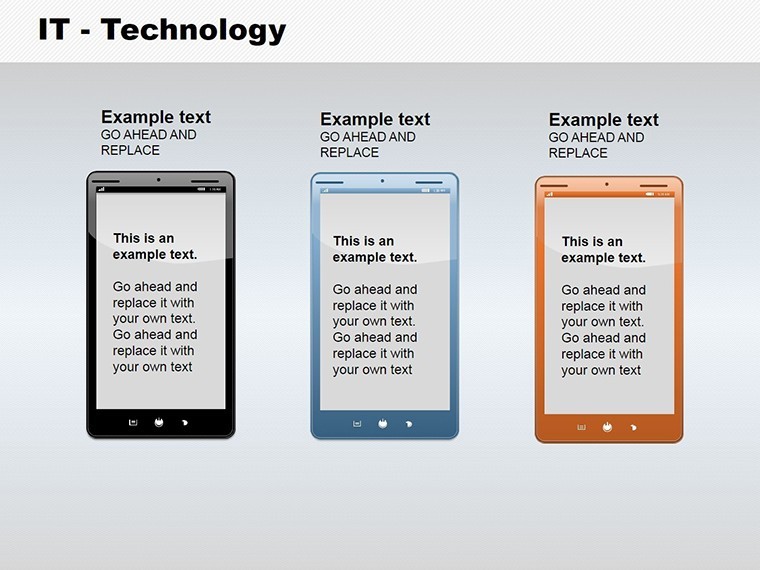
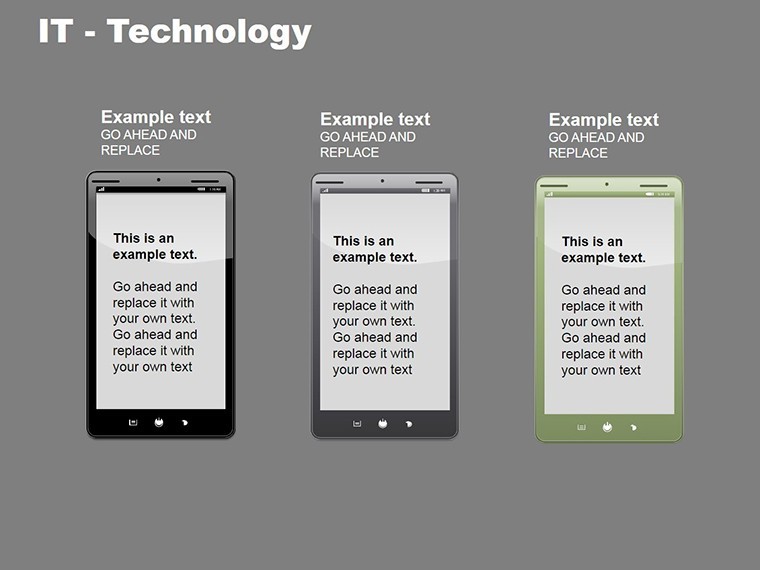
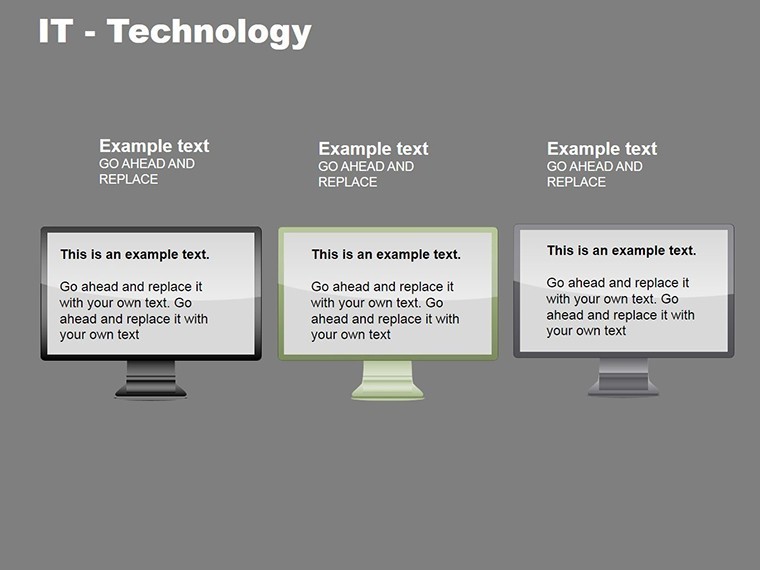
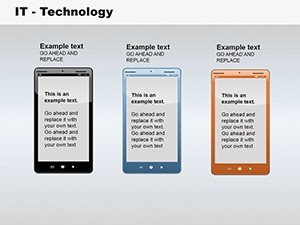
- Full Editability: Modify text, photos, and layouts in seconds for personalized content.
- High Compatibility: Optimized for iWork Keynote on Mac, with export to video for demos.
These elements make the template indispensable, offering more than illustrations - it's a framework for tech communication excellence.
Applications in IT and Tech Fields
This template excels in various IT scenarios. For software developers, use slide 7's flowchart to map agile sprints, adding colors for phase status. Step-by-step integration: Import your wireframes, apply animations for sequence demos, and present. In cybersecurity training, slide 18's layered diagrams illustrate threat vectors, far superior to text-heavy slides. Real example: An IT firm akin to Palo Alto Networks employed vector charts for vulnerability assessments, clarifying risks and accelerating response plans. For educators, it's perfect for online courses, visualizing algorithms with interactive elements.
Tips to Optimize Your Tech Presentations
- Align visuals with tech standards: Use consistent icons for familiarity, like standard cloud symbols.
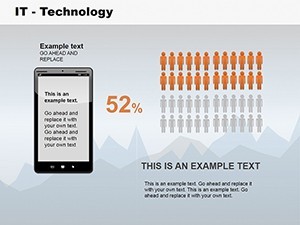
- Incorporate real data: Link to databases for live charts in demos.
- Balance complexity: Use animations sparingly to avoid overwhelming tech-savvy audiences.
- Test on devices: Ensure scalability for mobile views in hybrid meetings.
- Weave narratives: Connect slides with transitions to tell a tech story, from problem to solution.
Drawn from tech conference best practices, these enhance engagement, much like TEDx talks on innovation.
Transform Your IT Narratives Now
With 20 versatile slides, this IT Technology Keynote Charts template is your ally in the digital frontier. Affordable and powerful, it's designed to empower tech visionaries. Secure yours and redefine how you present technology.
Frequently Asked Questions
Are the vectors truly editable?
Yes, fully customizable in size, color, and shape within Keynote.
Does it support animations?
Custom effects are included for dynamic presentations.
Can I add my own images?
Easily insert photos or icons as needed.
What platforms is it for?
Exclusively for Keynote on Mac/iOS.
Is it suitable for beginners?
Yes, intuitive editing makes it accessible.