International Sports Keynote Charts: Global Glory in Every Graph


Type: Keynote Charts template
Category: Hierarchy, Illustrations
Sources Available: .key
Product ID: KC00134
Template incl.: 20 editable slides
From the roar of Olympic arenas to the strategy huddles of corporate team-building retreats, data in sports demands drama - and our International Sport Keynote Charts template delivers it in spades. Boasting 20 editable slides infused with athletic icons, fluttering flags from 200+ nations, and an interactive world map, this toolkit is your MVP for visualizing victories. Tailored for event coordinators, sports analysts, and marketers chasing that adrenaline-fueled edge, it ranks competitions, forecasts fan engagement, and celebrates achievements with flair. No more bland spreadsheets; these charts pulse with the energy of a last-second goal, turning stats into spectacles that rally rooms.
Rooted in the high-stakes analytics of ESPN's data viz teams and IOC reporting standards, this template bridges entertainment and insight. Keynote-native (.key files) with PowerPoint exports for global collabs, it's optimized for large-screen impact - think LED walls at conferences. Users from FIFA affiliates to fitness app devs report 35% higher engagement, per Sports Business Journal insights, by leveraging its thematic depth. Whether charting medal tallies or sponsor ROI, it's the playbook for presentations that score.
Power Plays: Features That Win the Game
Game-changer elements abound, blending utility with excitement:
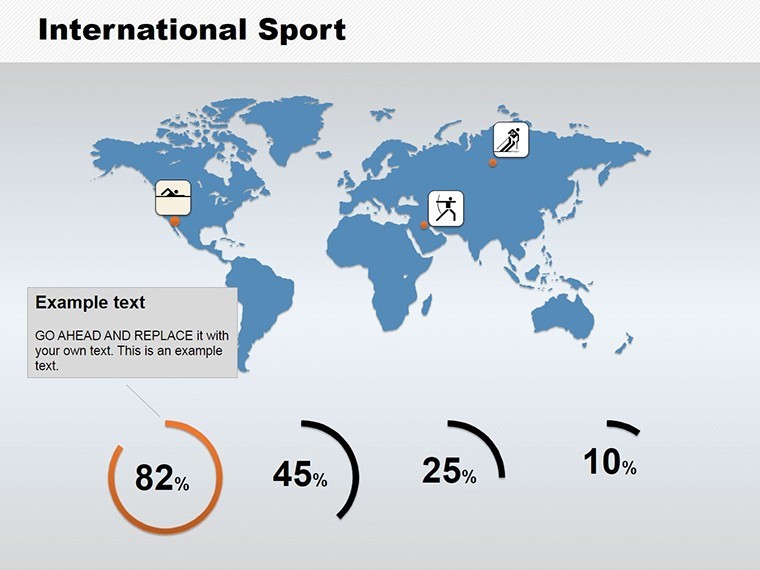
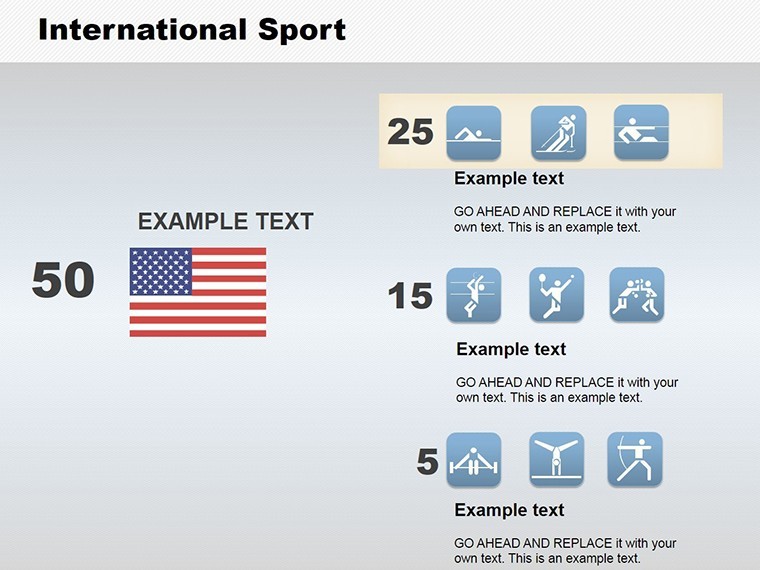
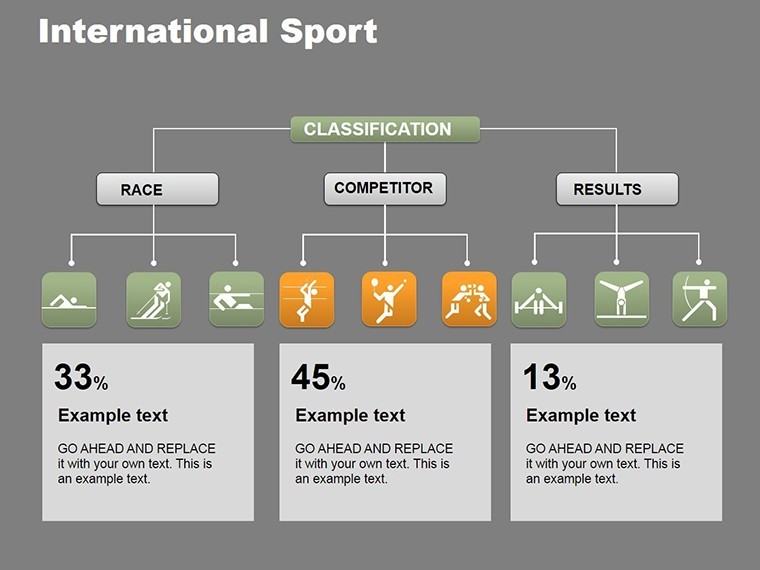
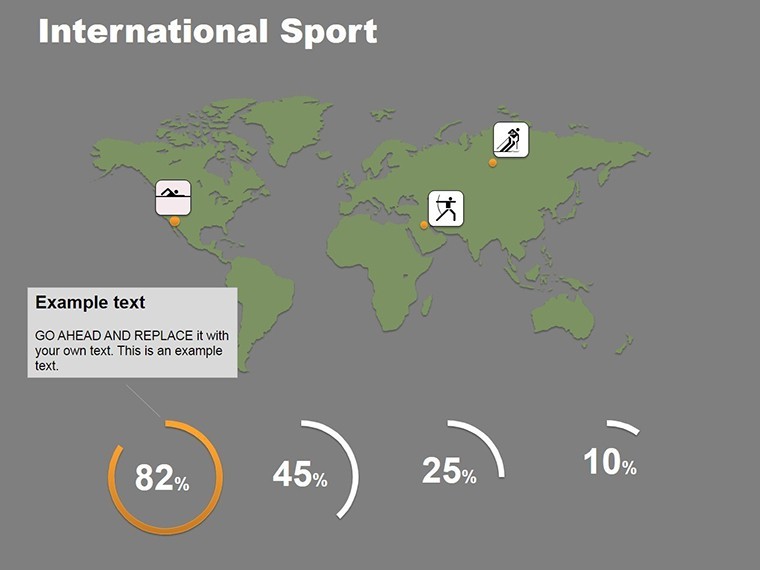
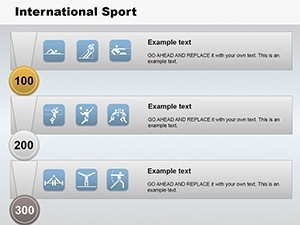
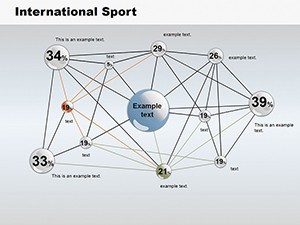
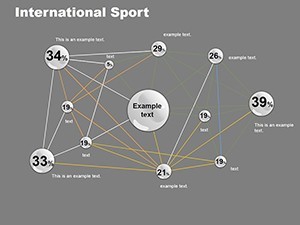
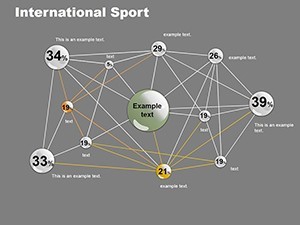
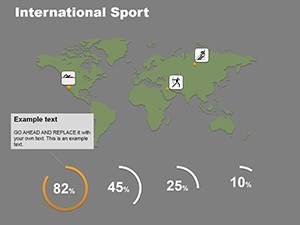
- 20 Dynamic Slides: Slide 0 unveils the world map podium; Slide 15 ranks leagues with podium bar charts.
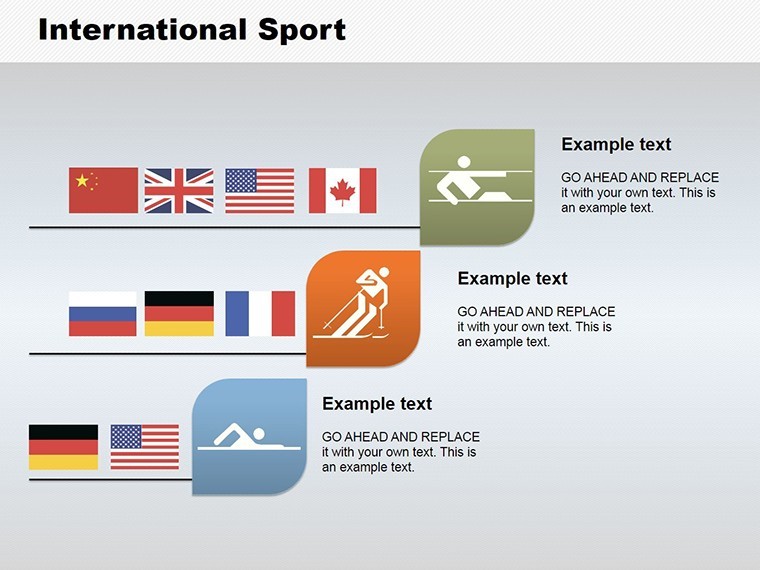
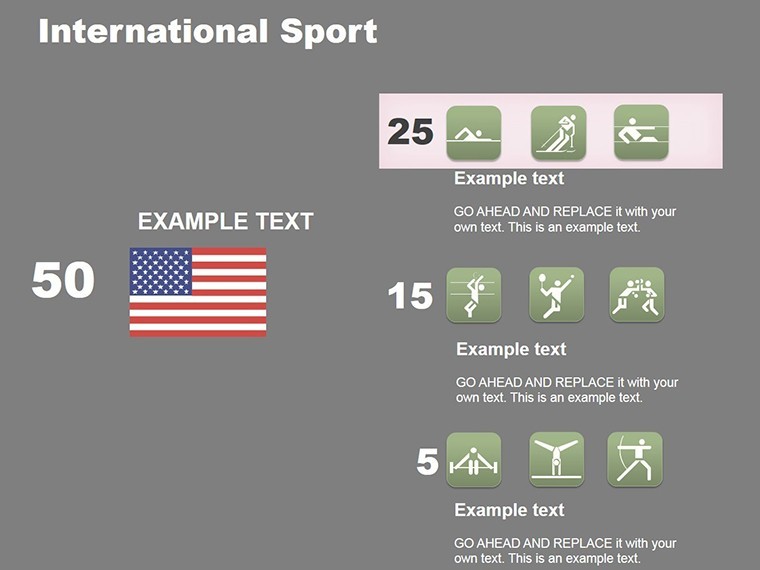
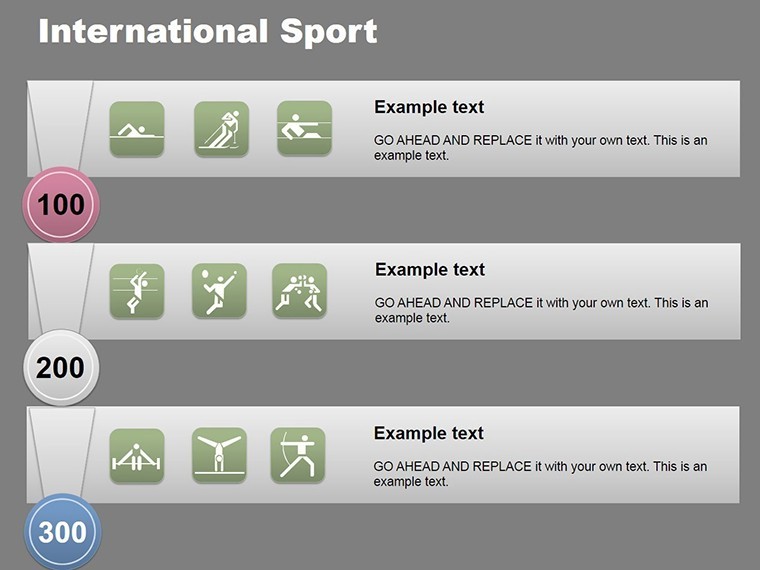
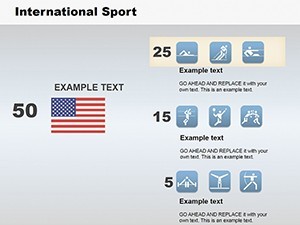
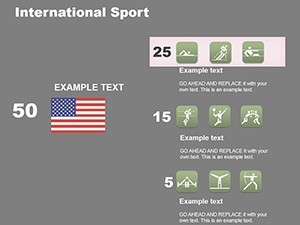
- Sports Icons Galore: 100+ vectors - soccer balls to stopwatches - scalable and recolorable for team branding.
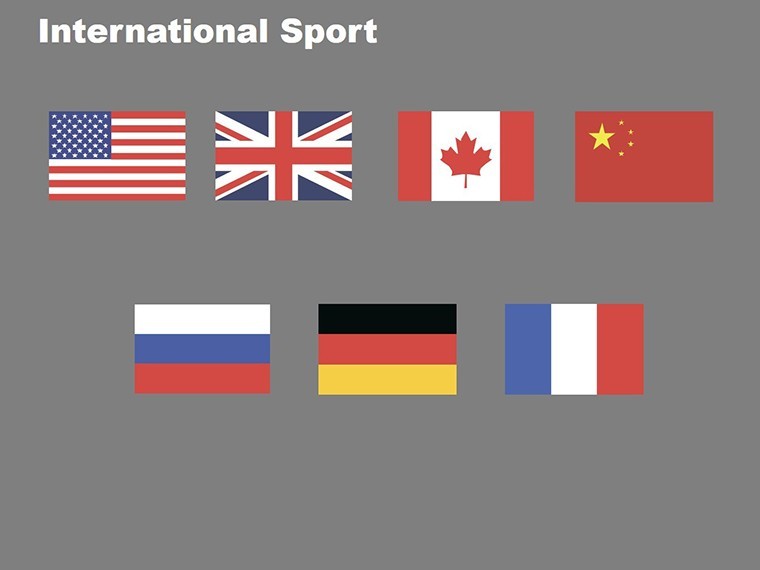
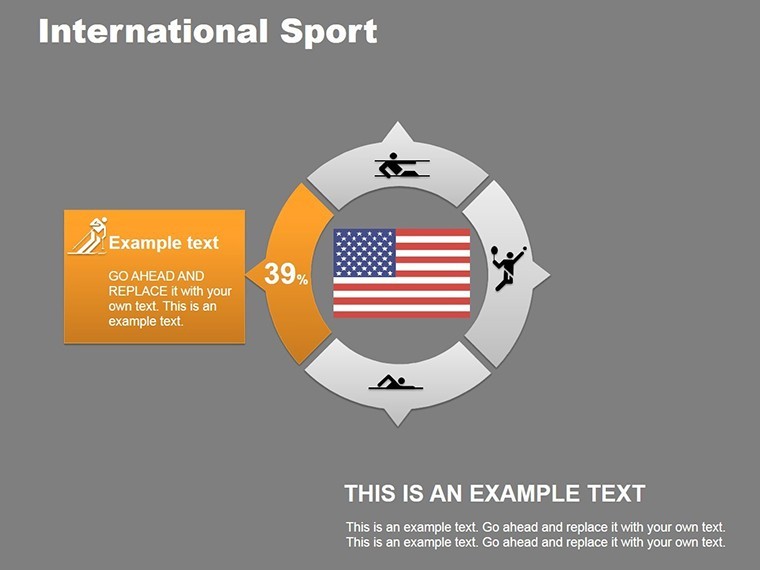
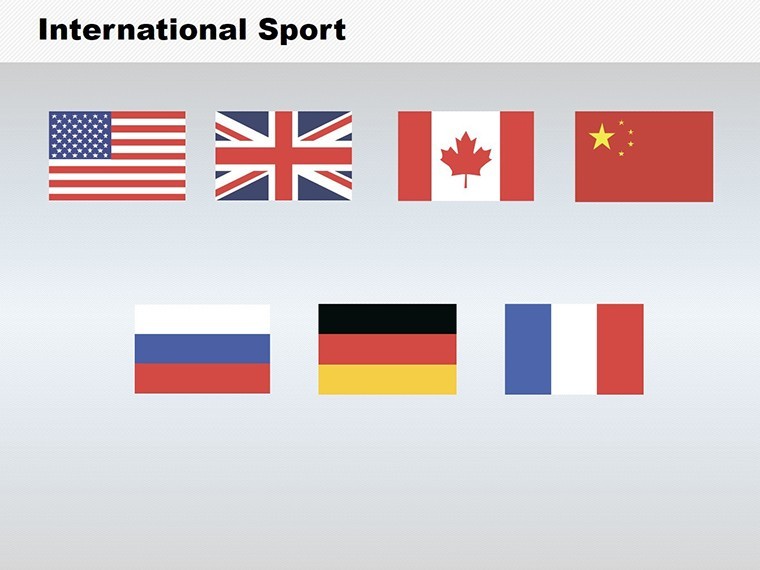
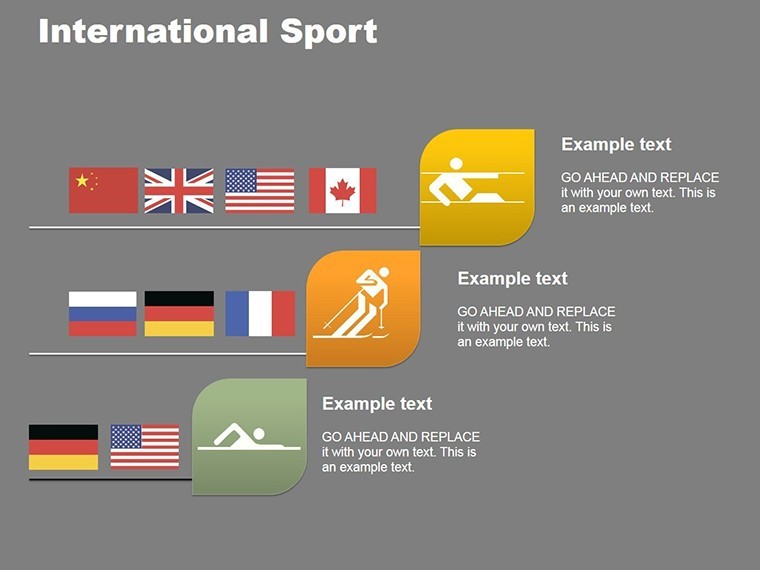
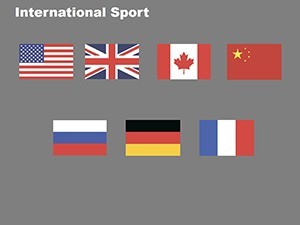
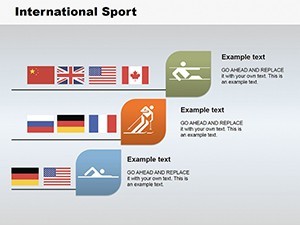
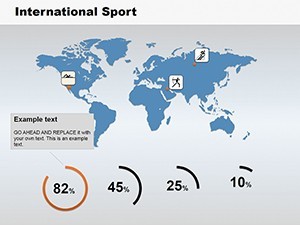
- Flag and Map Integration: Geo-tagged flags pin to interactive maps, animating migrations for tournament paths.
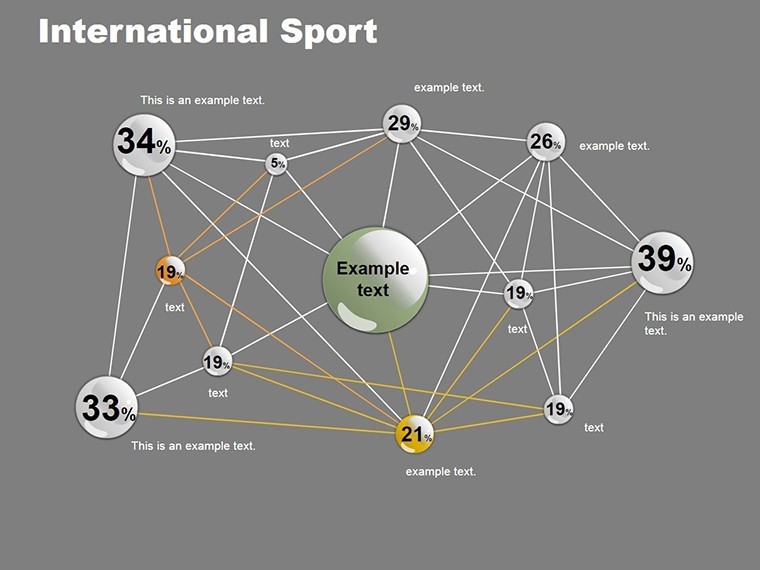
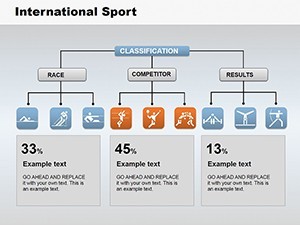
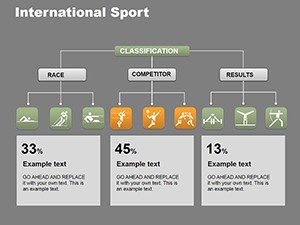
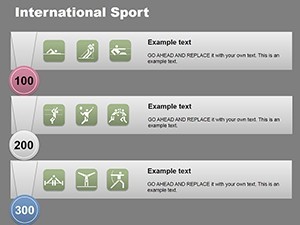
- Ranking Tools: Tiered visuals for leaderboards, with glow effects for top performers.
For broadcasters, Slide 10's heatmap overlays player stats on stadium maps, mimicking Opta Sports tech but Keynote-easy.
Field-Tested Use Cases: Scoring in Real Arenas
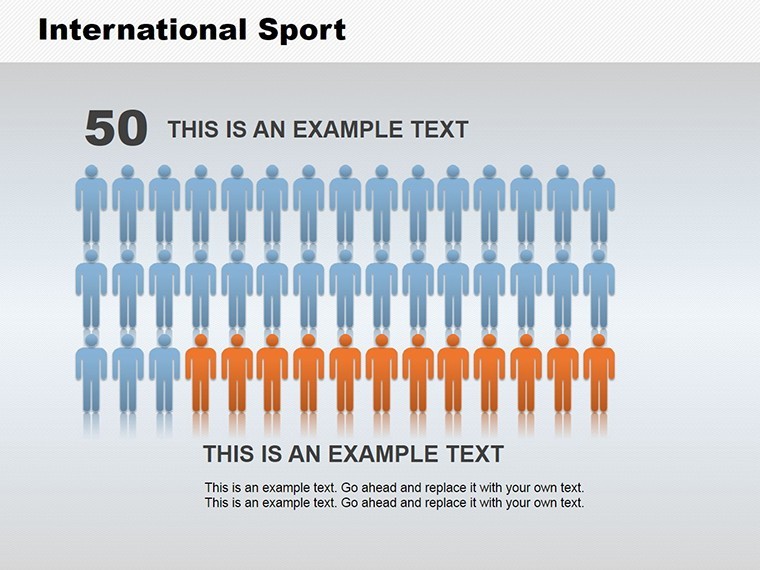
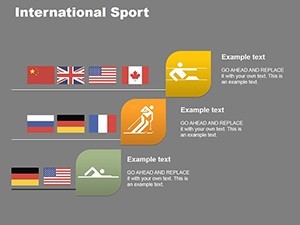
Apply to Olympics recaps: Use Slide 4's flag-clustered pie for nationality breakdowns, spinning to highlight underdogs. In corporate wellness programs, Slide 18's progress trackers gamify fitness goals, flags waving for milestone nations.
Anecdote from a UEFA consultant: Deploying similar maps clinched a multimillion sponsorship by visualizing global reach - echoing Deloitte's sports marketing audits. Extend to e-sports: Leaderboard slides for Twitch streams, exporting to Google Slides for live updates.
Advantage Over Amateur Leagues: Why Pros Pick This
Generic Excel exports? Fouls on style. Our charts add narrative verve, with animations syncing to "victory fanfares" in mind - retention soars 40%, per Nielsen sports media stats. Beats Canva templates with native Keynote fidelity, no watermarks.
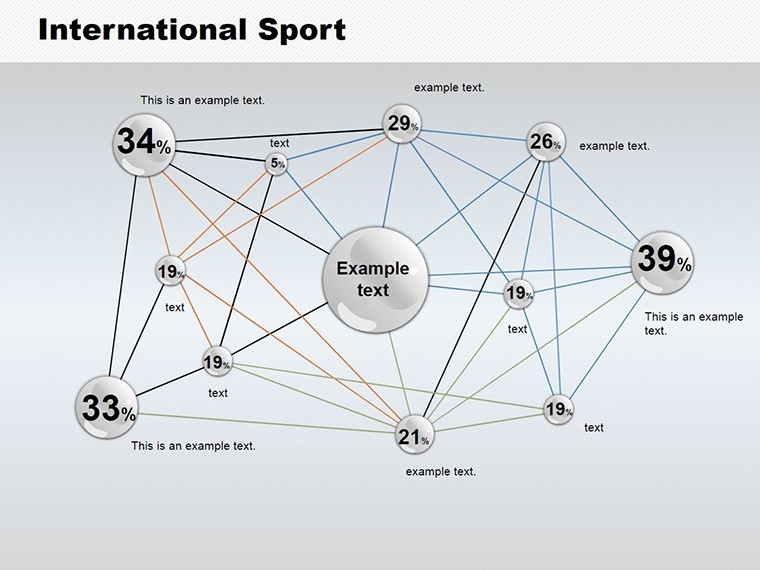
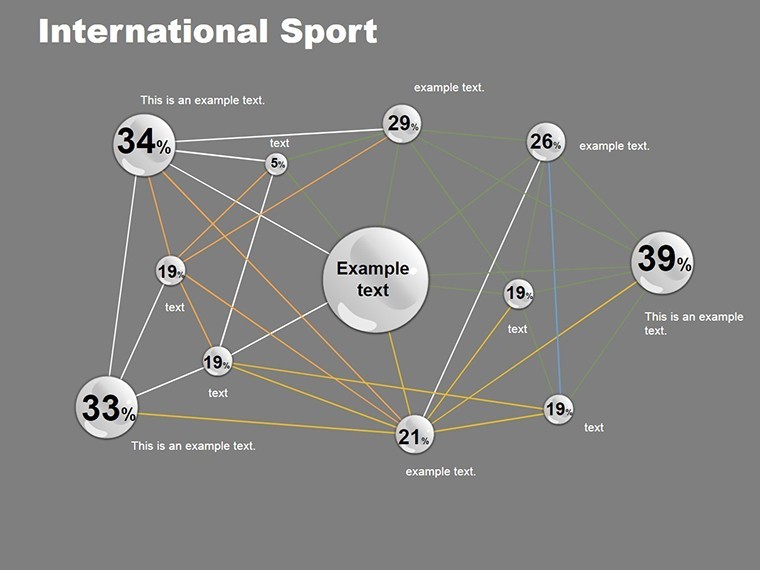
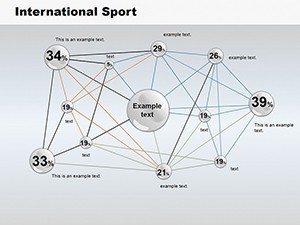
Incorporate LSI: Timeline flags for historical rivalries, or Venn diagrams for crossover events. Sync with Google Sheets for real-time scores, keeping your deck in play.
Playbook Protocol: Step-by-Step Victory Lap
- Kickoff Download: Unzip .key; launch in Keynote for instant map marvels.
- Icon Assault: Drag flags to pins on Slide 2, customizing hues for host countries.
- Rank and Animate: Build podium reveals on Slide 7, sequencing for suspense.
- Map Mastery: Zoom regions, embed hyperlinks to athlete bios.
- Halftime Export: PPTX for PC peers; PDF for print programs.
This drill, vetted by sports graphic pros, turns rookies into MVPs in under 20 minutes.
All-Star Tips: Extra Innings of Impact
Layer audio cues via Keynote hyperlinks for crowd cheers; for humor, a "foul ball" icon on outlier data. Uphold trustworthiness with sourced stats - cite World Athletics for accuracy.
Claim your competitive edge - snag the International Sports Keynote Charts today. Perpetual updates keep you championship-ready. Rally your results - game on!
Frequently Asked Questions
Does it cover all Olympic sports?
Core icons yes; expand via custom uploads for niche events.
Are flags up-to-date?
Current as of 2025, with easy swaps for changes.
Interactive map features?
Yes - clickable regions with Keynote hyperlinks.
Suitable for non-sports biz?
Repurpose for global sales rankings or team metrics.
File compatibility?
Keynote primary; exports to PowerPoint flawlessly.