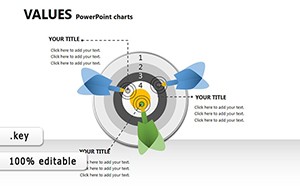
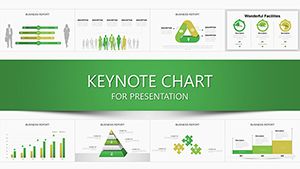
Supply Chain Management Keynote Charts: Streamline Your Operations


Type: Keynote Charts template
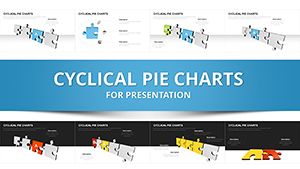
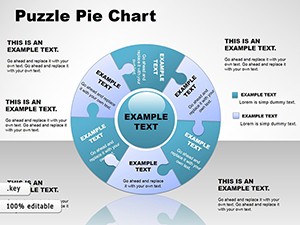
Category: Cycle, Business Models, Pie
Sources Available: .key
Product ID: KC00129
Template incl.: 12 editable slides
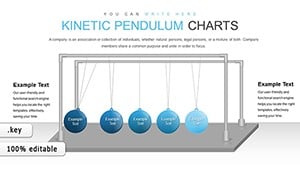
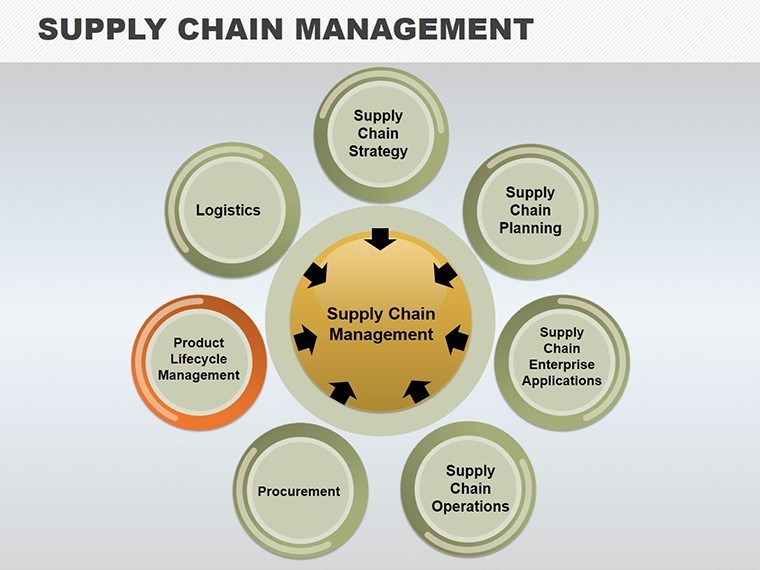
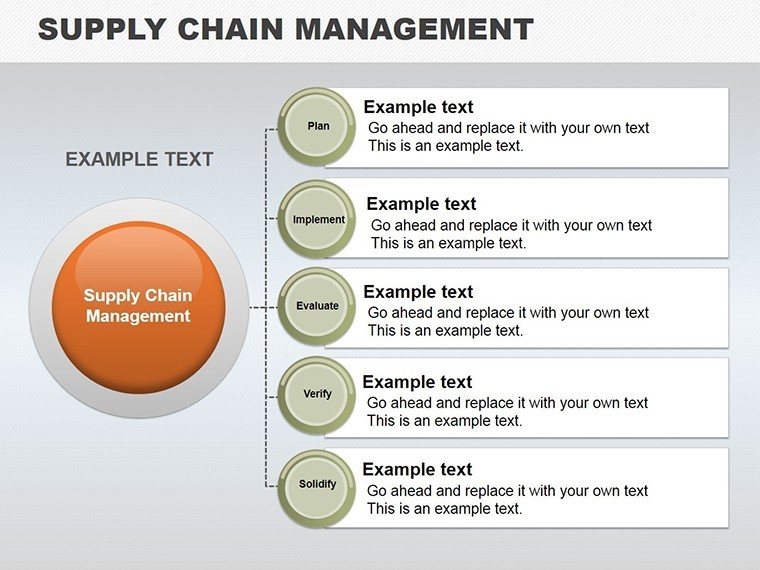
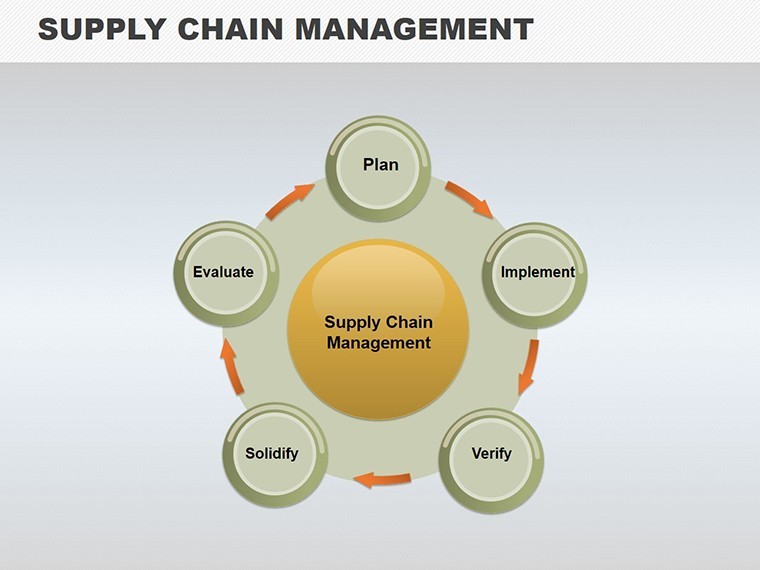
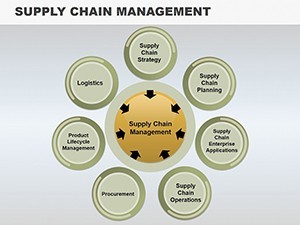
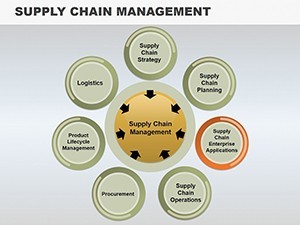
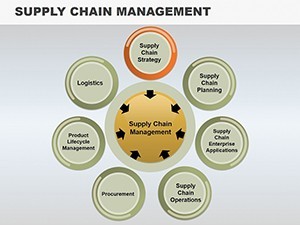
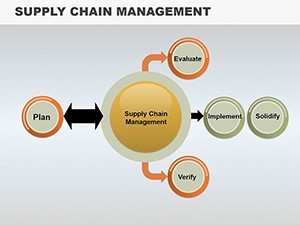
Navigating the intricate web of supply chains demands more than words - it requires visuals that map connections and pinpoint efficiencies. Our Supply Chain Management Keynote Charts template, with 12 editable slides, is engineered for logistics experts, operations managers, and procurement specialists. Envision cycle diagrams that trace product journeys from raw materials to end-users, or pie charts breaking down cost distributions. Inspired by lean management principles from thought leaders like Taiichi Ohno of Toyota Production System fame, this template fosters a holistic view, helping you identify bottlenecks and opportunities.
Fully compatible with Keynote, it allows effortless edits: resize cycles, recolor segments, and embed data for personalized insights. Categories like Cycle and Business Models ensure relevance across sectors, from manufacturing to e-commerce.
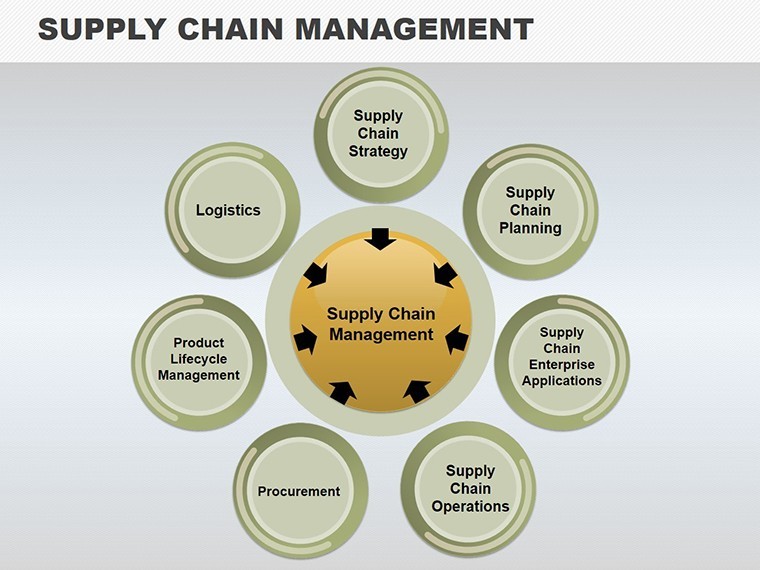
Mapping Efficiency in Supply Chain Dynamics
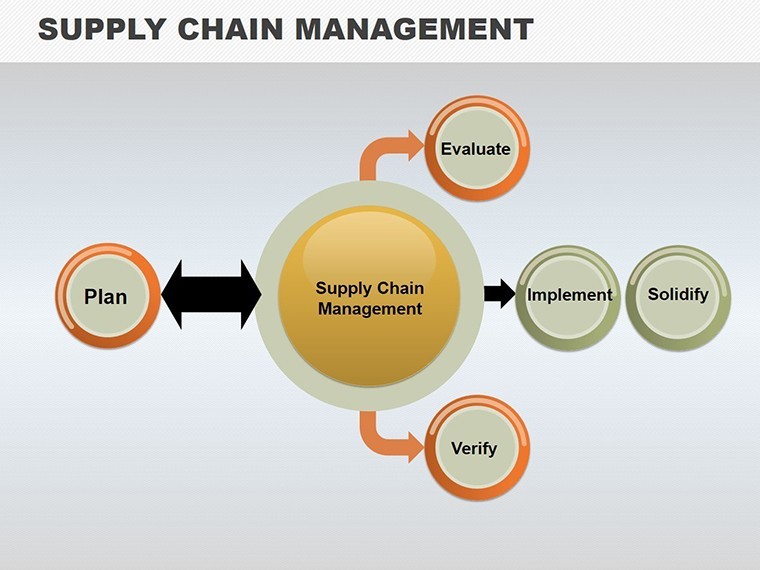
Supply chains are ecosystems of interdependence; our charts illuminate these links. For a distributor, Slide 3's flow diagram could illustrate vendor integration, highlighting delays in real-time. In a global firm case, similar visuals aided in reducing inventory costs by 15%, as per a McKinsey report on supply chain resilience.
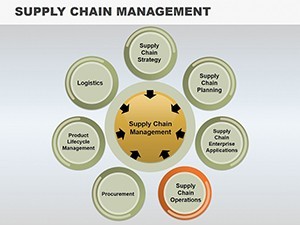
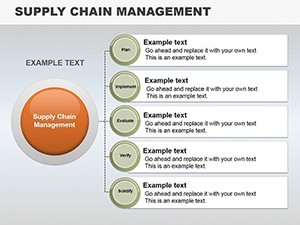
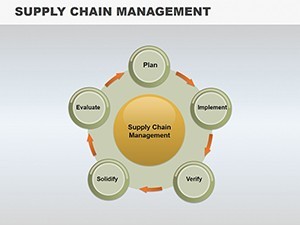
The slides vary: basic pies for share analysis, advanced cycles for process loops. Slide 7 combines both for hybrid models, ideal for hybrid supply strategies.
Essential Features for Operational Excellence
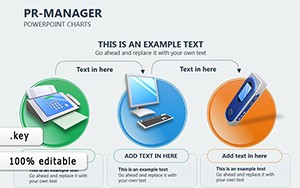
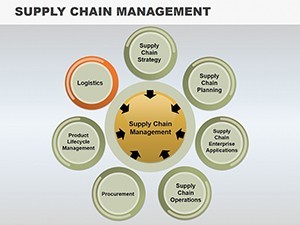
- Integrated Visuals: Connect entities like suppliers and sellers in cohesive diagrams.
- Planning Tools: Editable timelines for forecasting storage and distribution.
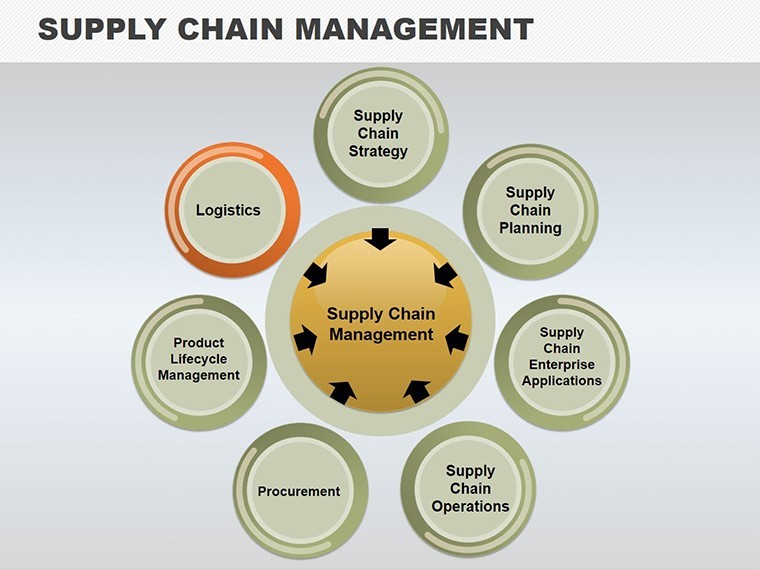
- Color-Coded Coordination: Use hues to denote stages, aiding quick comprehension.
- Data-Driven Customization: Input metrics to auto-adjust charts.
- Export Flexibility: Share via PDF for cross-team collaboration.
This template addresses core challenges: coordination mishaps that lead to stockouts or overages. By visualizing flows, you empower decisions that enhance agility, much like Amazon's data-centric approach.
Strategic Applications in Diverse Scenarios
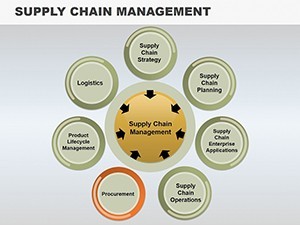
In manufacturing, chart production cycles to optimize just-in-time delivery. For retail, pie slices show supplier contributions. Step-by-step: Open in Keynote, populate data, customize paths, and animate for emphasis.
Outperforming default charts, it includes layered elements for depth, simulating real-world complexities.
Insights from Supply Chain Veterans
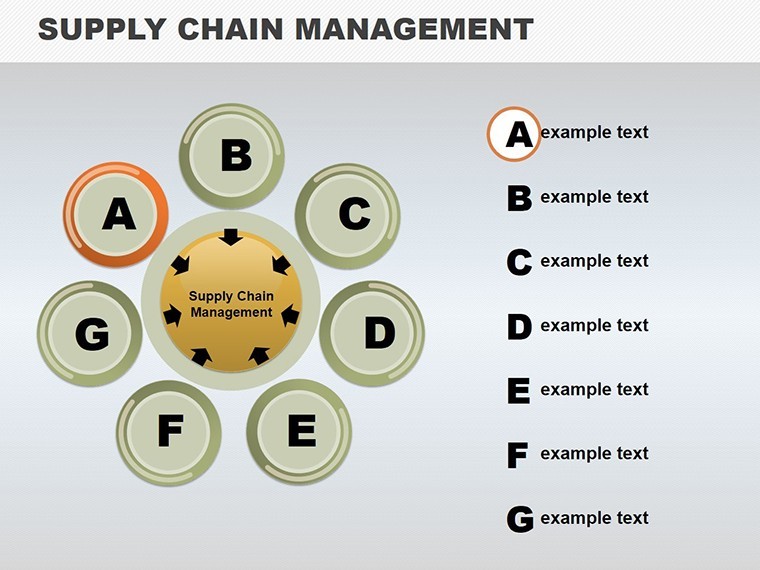
- Identify key nodes: Focus on critical suppliers in your diagrams.
- Simulate disruptions: Use variants to model risks.
- Align with metrics: Tie visuals to KPIs like OTIF.
- Collaborate iteratively: Share drafts for input.
- Update regularly: Refresh with new data for relevance.
These strategies, honed from industry experience, maximize your template's utility.
Transform Your Supply Chain Vision
Equip yourself with tools that turn complexity into clarity. Download this template and orchestrate seamless operations.
Frequently Asked Questions
How do these charts aid coordination?
By visually linking entities, they highlight interdependencies clearly.
Can I adapt for global chains?
Yes, customizable for multi-region scenarios.
What data sources integrate?
Excel, ERP systems via Keynote links.
Are cycles animated?
Built-in options for dynamic flows.
Compatible with iPad Keynote?
Fully, for on-the-go edits.
How to expand models?
Duplicate slides for detailed breakdowns.