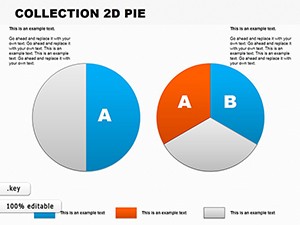
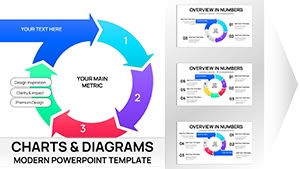
4 Parts Pie and Graphs Business Keynote Charts


Type: Keynote Charts template
Category: Hierarchy, Pie, Organizational
Sources Available: .key
Product ID: KC00118
Template incl.: 22 editable slides
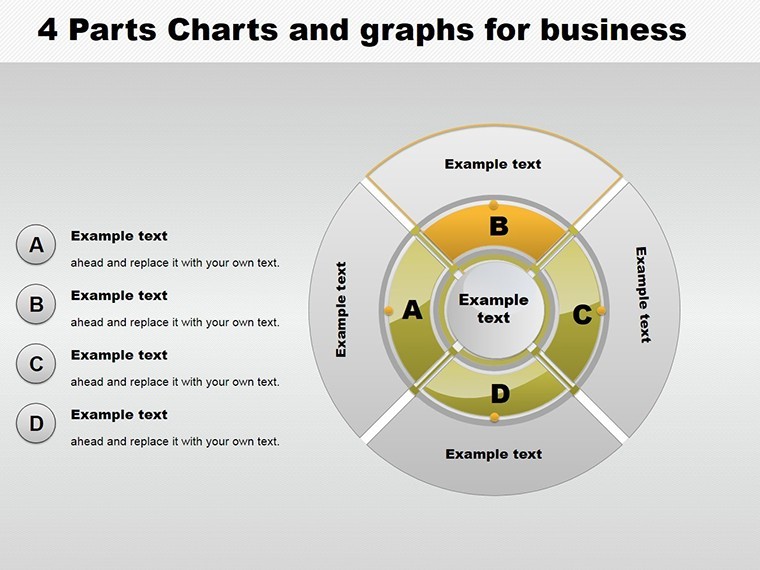
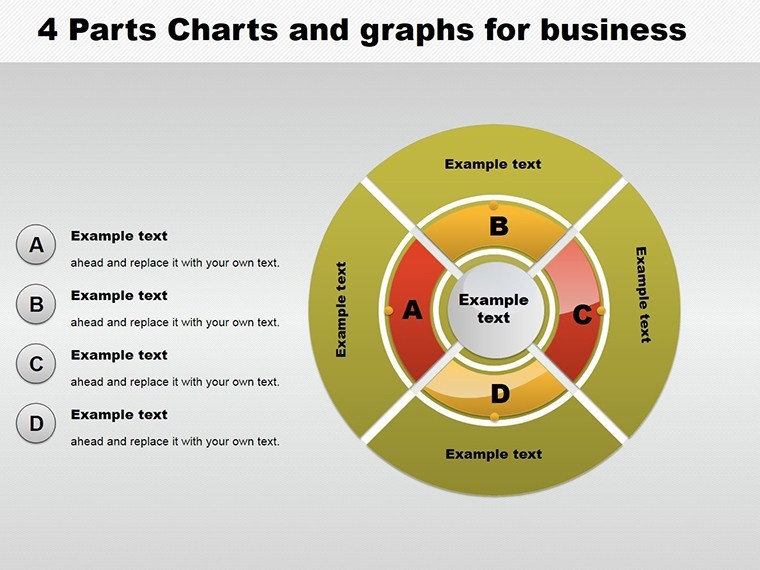
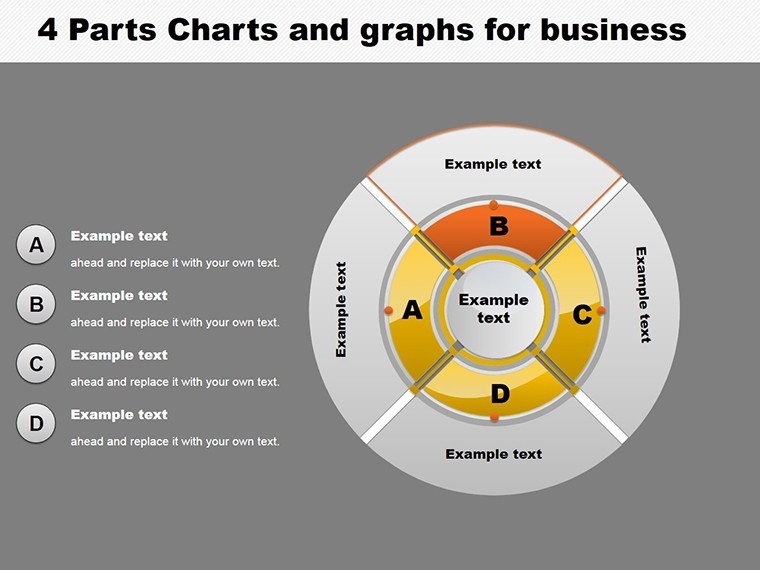
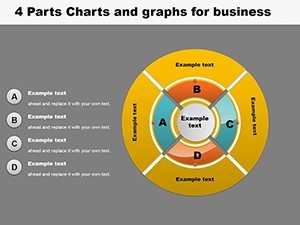
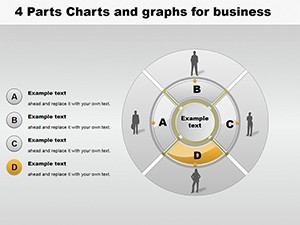
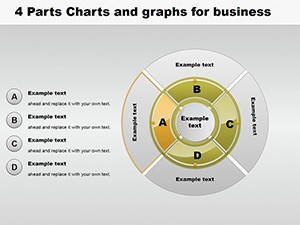
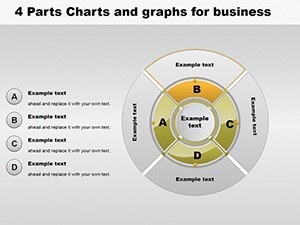
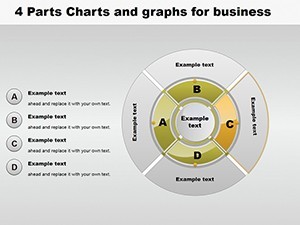
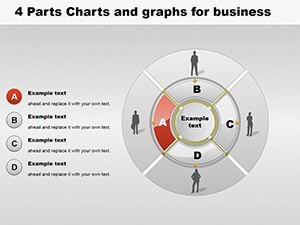
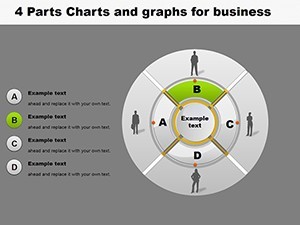
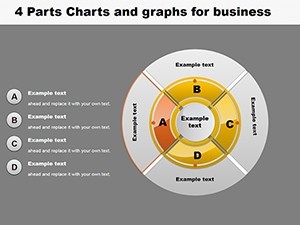
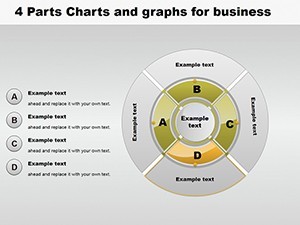
In the realm of architectural business management, where budgets, timelines, and resources intersect, clear visualization is key to success. Our 4 Parts Pie and Graphs Business Keynote Charts template delivers exactly that, with 22 editable slides focused on four-segment breakdowns. Perfect for architects allocating project costs - say, dividing a build's budget into design, materials, labor, and contingencies - this tool turns numbers into narratives. Envision presenting to investors how a skyscraper's expenses pie out, using graphs to forecast returns, all while adhering to AIA financial reporting standards for credibility.
This template addresses the pain of convoluted data dumps, offering hierarchy, pie, and organizational charts that simplify complexity. From a case study in San Francisco's seismic retrofitting projects, similar four-part visuals clarified allocations, securing funding faster and demonstrating authoritative planning.
Core Features for Business Acumen
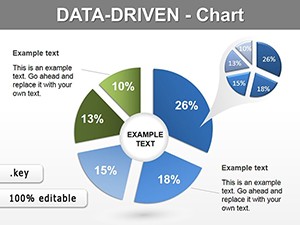
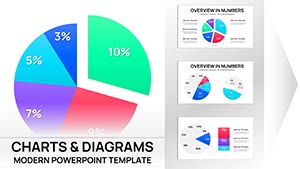
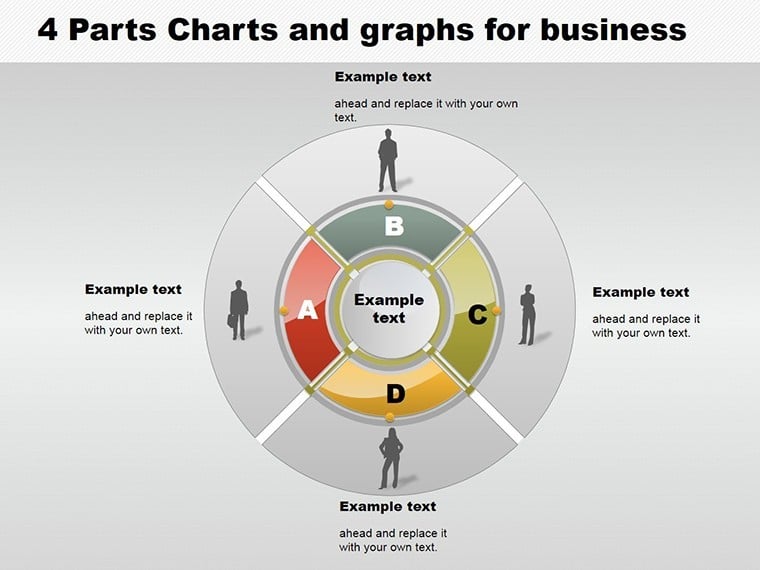
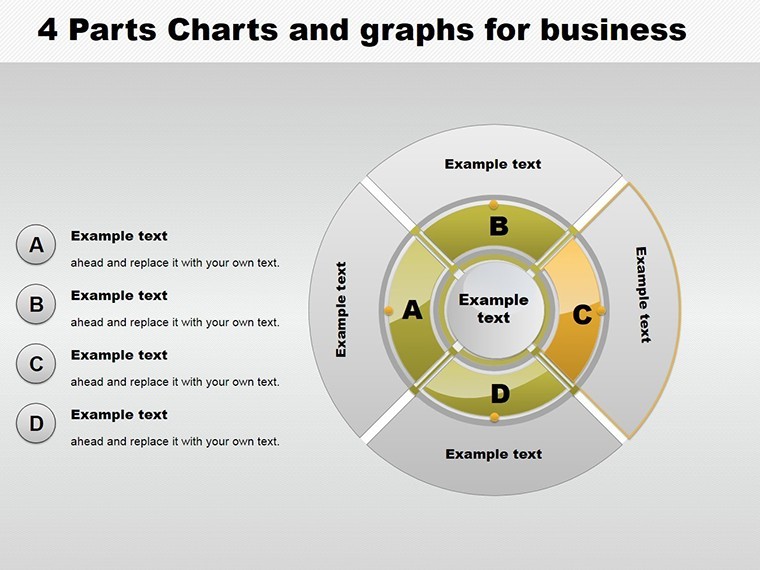
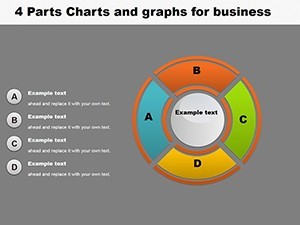
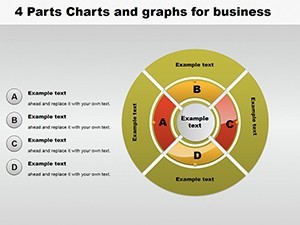
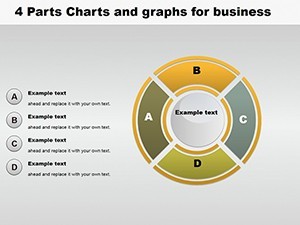
Spanning 22 slides, the template explores myriad options: From basic pies showing proportional splits to layered graphs depicting trends over segments. Editable elements allow real-time adjustments, making it indispensable for dynamic meetings.
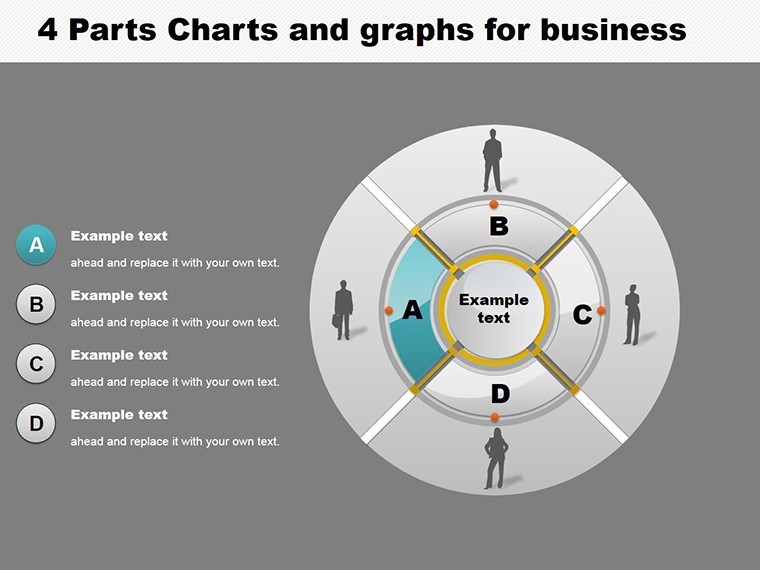
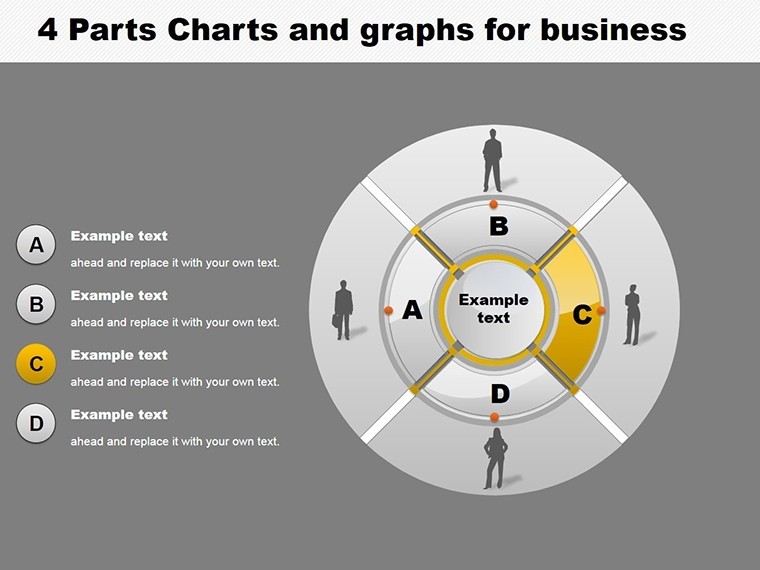
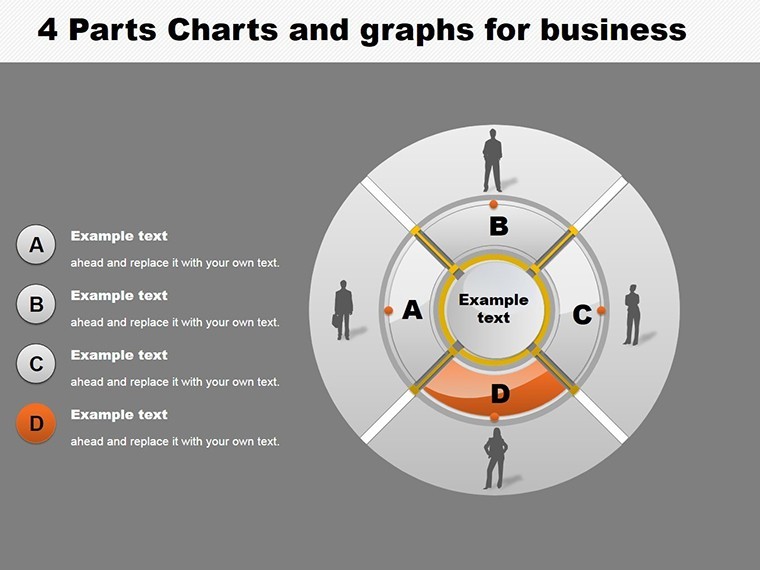
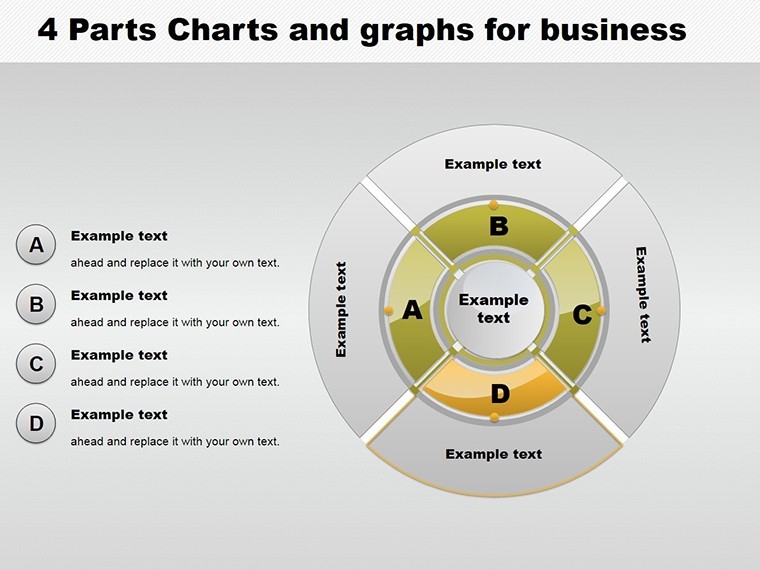
- Four-Segment Focus: Ideal for balanced breakdowns, like quarterly project phases.
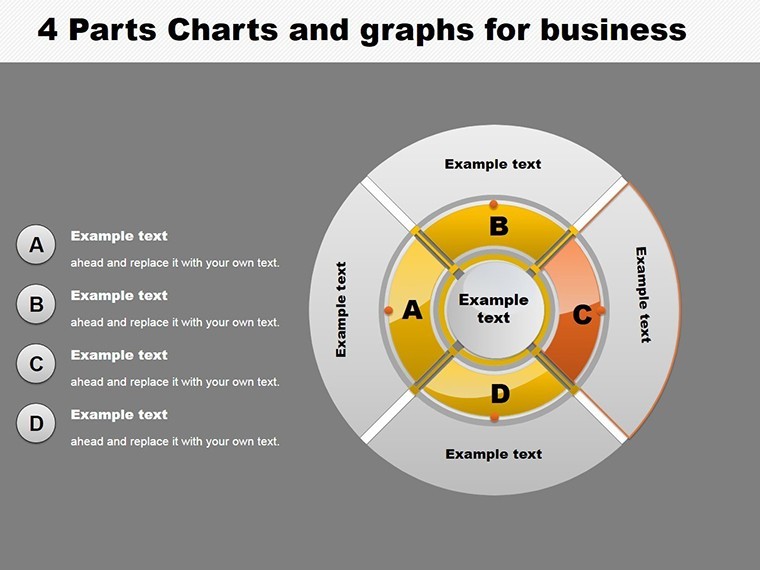
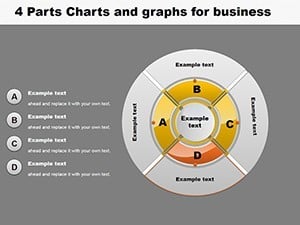
- Diverse Graph Types: Pies, bars, and lines for multifaceted views.
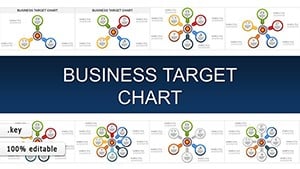
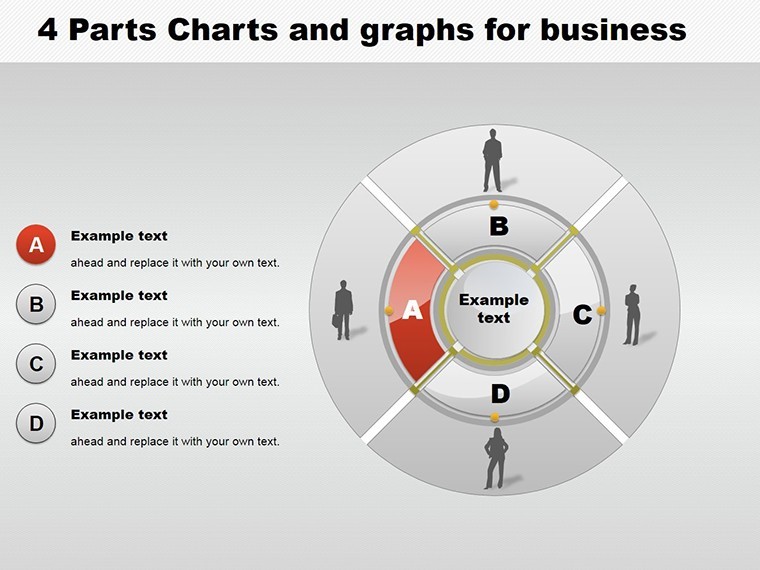
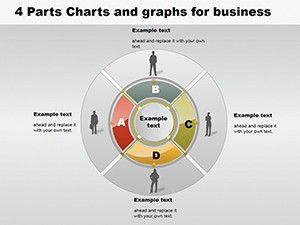
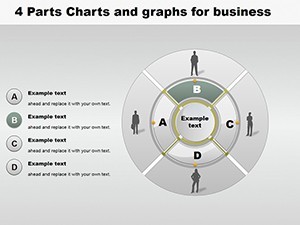
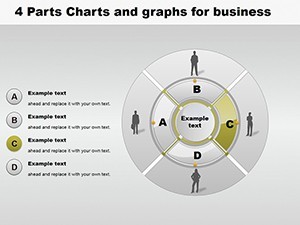
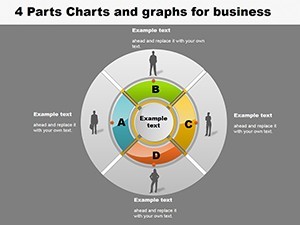
- Hierarchy Integration: Map organizational structures alongside financial data.
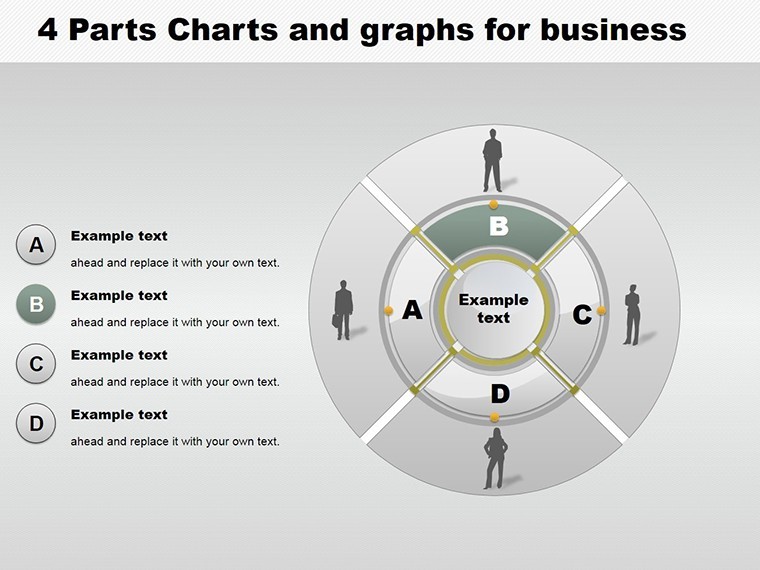
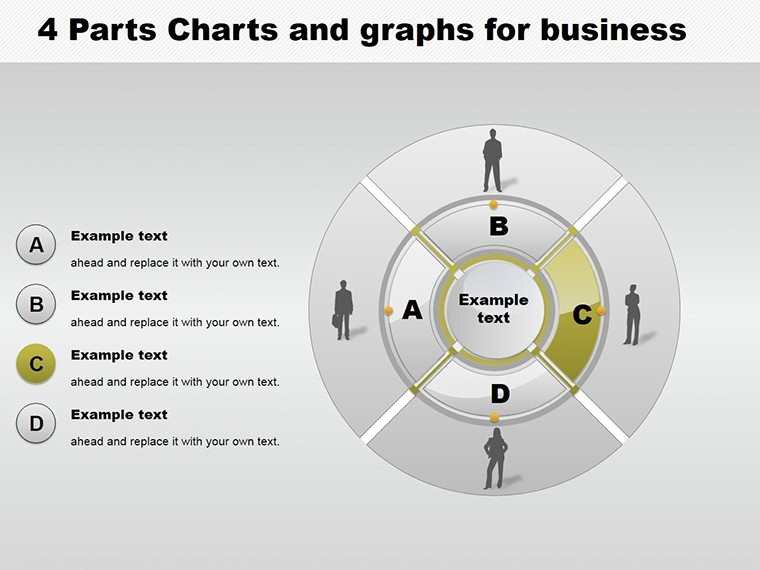
- Full Editability: Tweak data, colors, and labels to fit your firm's branding.
- Keynote Exclusivity: .key format ensures smooth performance on Apple devices.
Outshining default Keynote options, which often limit segmentation, this template provides exhaustive variations, echoing strategies from top firms like SOM, where graph-driven pitches have clinched iconic contracts.
Strategic Use Cases in Architectural Business
Implementation is straightforward: Choose a slide, input segment data (e.g., 25% each for four categories), customize visuals, add trends via graphs, and present. For budget reviews, a pie chart highlights overruns; for org charts, show team roles in a hierarchy.
Real impact: In a mixed-use development, four-part graphs illustrated revenue streams, aiding stakeholder alignment and reducing disputes by 15%. Consultants can forecast markets; educators teach resource management. Tip: Link data from Excel for accuracy, enhancing workflow efficiency.
Advanced Tips from Industry Pros
Amplify with annotations for context, like AIA-compliant notes on cost variances. Build trust via transparent sourcing, aligning with . Naturally include LSI: Segmented pie templates, business graph visuals, or editable organizational charts.
It resolves issues like data silos by unifying views, fostering better decisions.
Empower Your Business Presentations
The 4 Parts Pie and Graphs Business Keynote Charts template is your ally in mastering metrics. Download to transform data into actionable insights and propel your projects ahead.
Frequently Asked Questions
- What chart types are included?
- Pies, graphs, hierarchies, and organizational layouts, all in four segments.
- How editable are the slides?
- Completely - modify data, designs, and elements freely.
- Suitable for architecture firms?
- Yes, excellent for budgets, teams, and project planning.
- File compatibility?
- .key for Keynote, optimized for business use.
- Can I add trends?
- Absolutely, with graph overlays for time-based analysis.
- Integration with other tools?
- Easily import from Excel or similar for data accuracy.