Professional Vacancy Charts Keynote Template


Type: Keynote Charts template
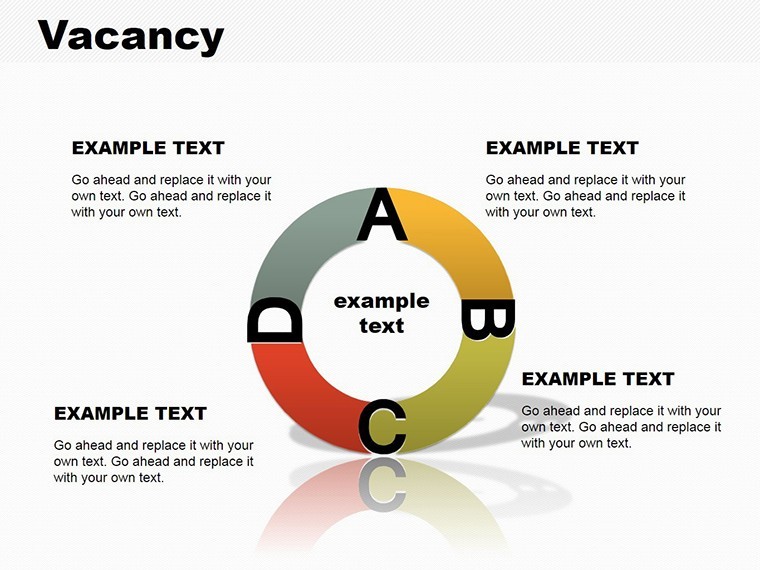
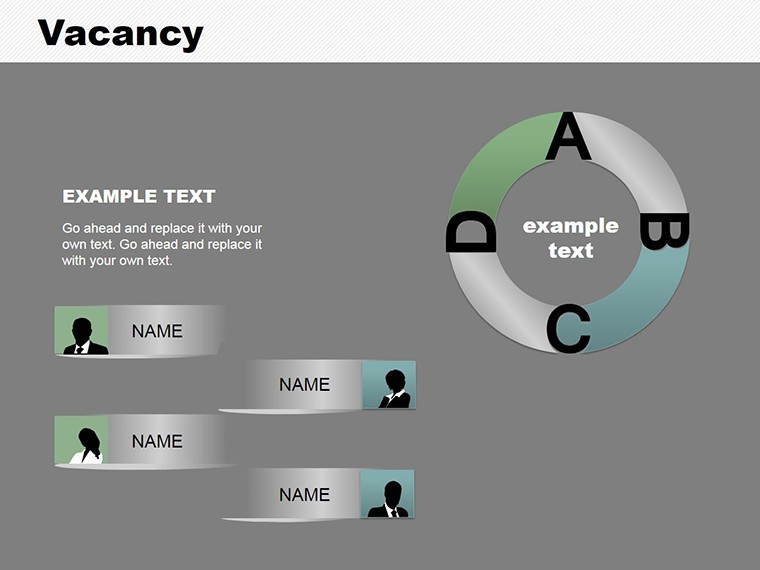
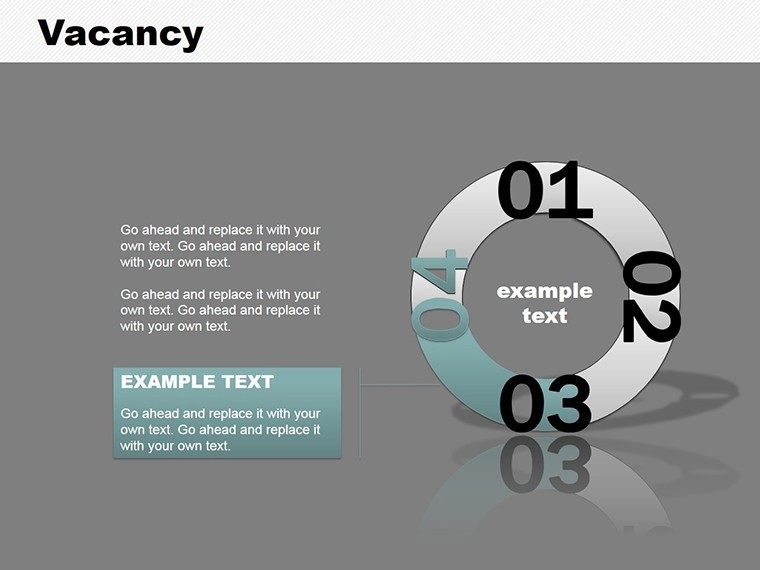
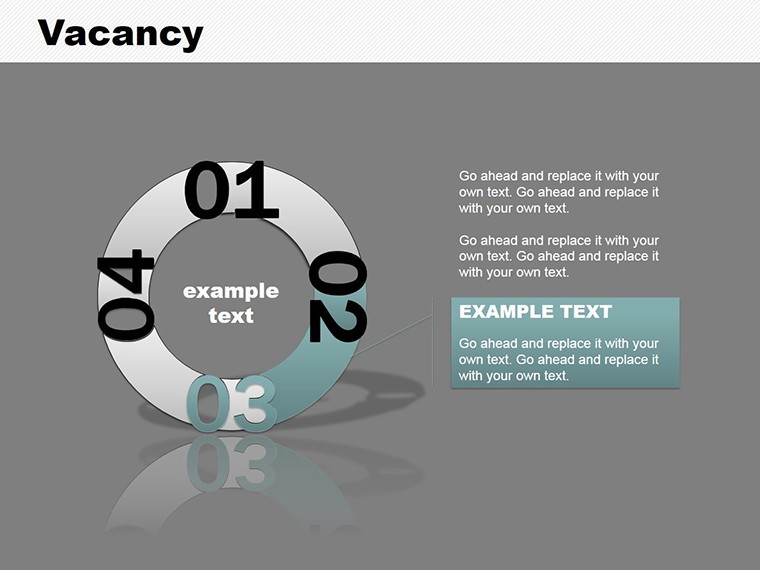
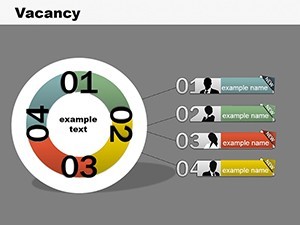
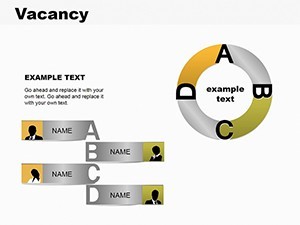
Category: Pie, Organizational
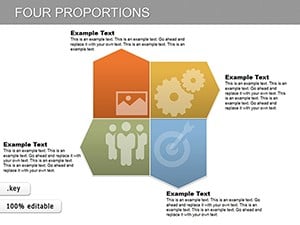
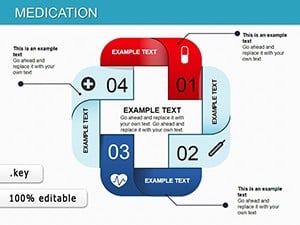
Sources Available: .key
Product ID: KC00109
Template incl.: 19 editable slides
In the competitive arena of architectural recruitment, where filling key roles like lead structural engineers can make or break a project's timeline, clear communication is king. Enter our Professional Vacancy Charts Keynote Template - a 19-slide powerhouse designed for HR managers, recruiters, and firm principals to visualize open positions, candidate funnels, and diversity metrics with precision and poise. This isn't mere charting; it's strategic storytelling that aligns with SHRM best practices, helping you attract talent that builds legacies, not just structures.
We've all sat through monotonous vacancy reports that bury insights under bullet-point avalanche. This template flips the script, offering visually intuitive designs that resonate with design-savvy audiences. Envision a recruitment dashboard slide where bar charts in firm-brand blues track applicant demographics for a urban design role - highlighting gaps in underrepresented groups with subtle highlights, prompting inclusive action without preachiness. Compatible with Keynote's robust ecosystem, it's your ally for internal talent reviews or client-facing talent strategy overviews in partnership bids.
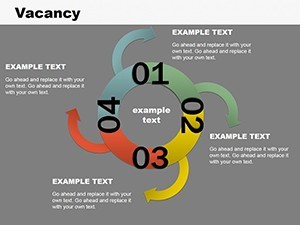
Rooted in data visualization wisdom from experts like Cole Nussbaumer Knaflic, this set prioritizes narrative flow over noise. From funnel diagrams mapping the journey from job post to onboarding - color-coded by stage drop-offs - to pie charts apportioning skill requirements for BIM specialists, every element empowers decisions. Export to PDF for board packets or animate for virtual town halls, ensuring your message lands as sharply as a well-placed partition wall.
Strategic Edges: Features Tailored for Talent Acquisition
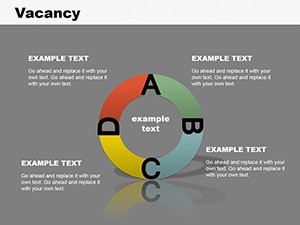
At its heart, this template equips you with tools that blend aesthetics and analytics seamlessly. The vacancy visualization core includes seven chart varieties, from stacked areas depicting seasonal hiring trends in sustainable architecture to radial gauges measuring fill rates against benchmarks.
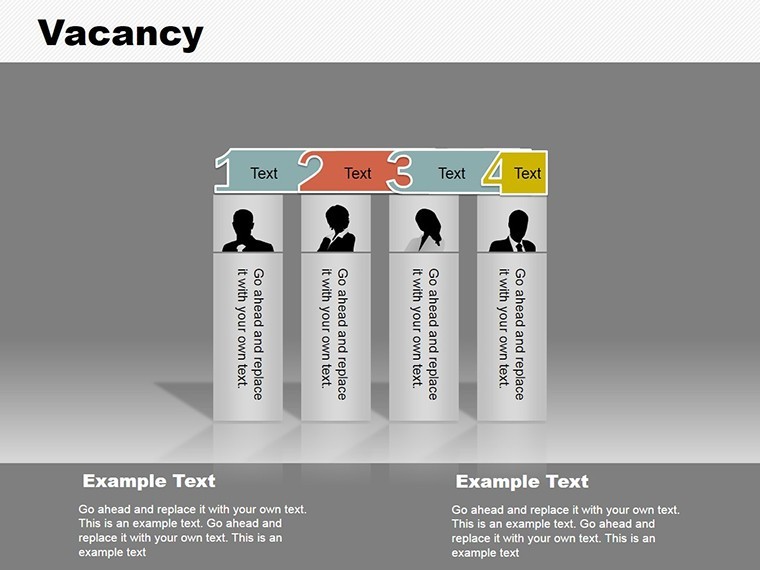
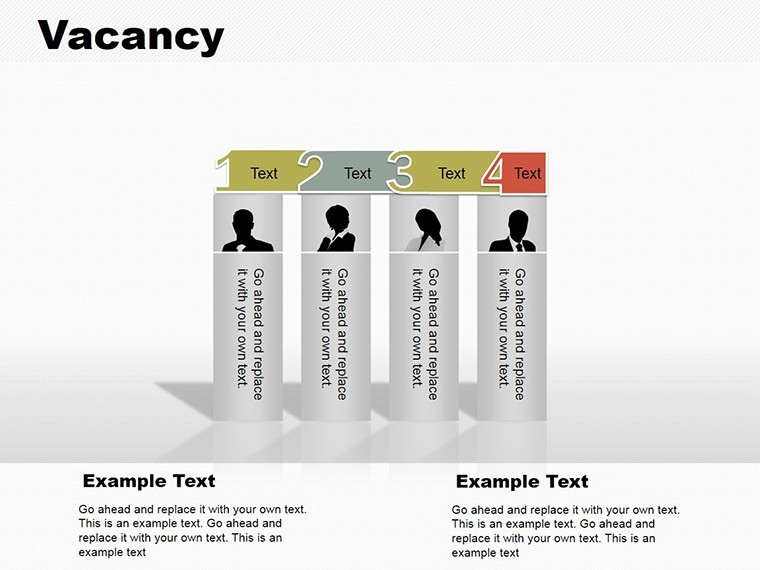
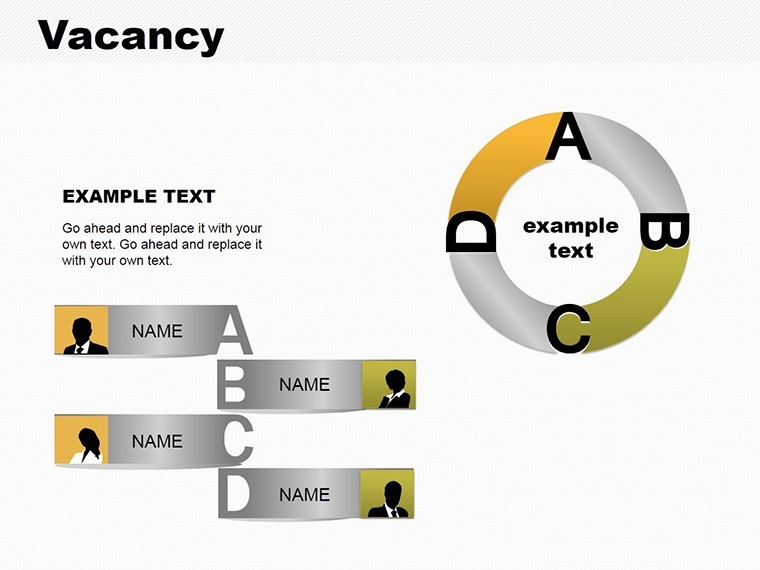
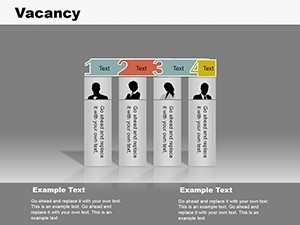
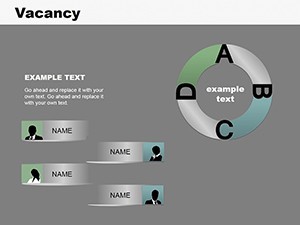
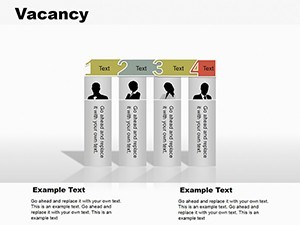
- 19 Fully Customizable Slides: Vector graphics that scale flawlessly, with placeholders for headshots and role icons - think hard hats for site supervisors, drafting tools for drafters.
- Diverse Color and Layout Options: Three schemes - corporate neutrals, vibrant accents for creative roles, monochromatic for executive summaries - adaptable via simple sliders.
- Integrated Metrics Library: Pre-formatted for KPIs like time-to-hire, cost-per-hire, and retention forecasts, with formulas linking to Google Sheets for live firm data.
Editing is a breeze: Drag icons to swap roles, recolor segments to match your logo, and add hyperlinks to applicant portals. For accessibility, built-in alt text prompts and high-contrast modes ensure compliance with ADA guidelines, vital for diverse candidate outreach.
Navigating the Slides: A Roadmap to Recruitment Success
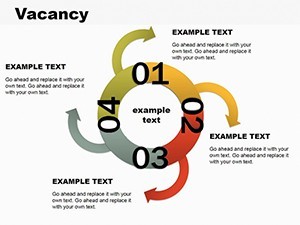
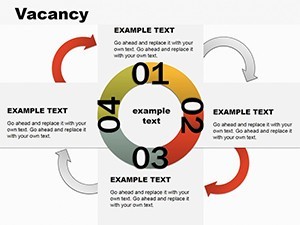
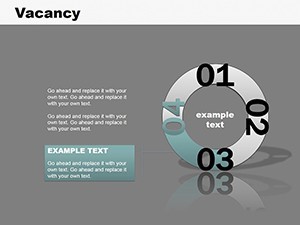
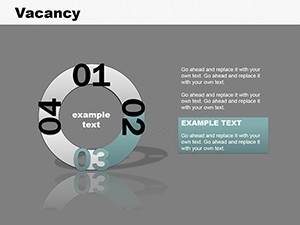
- Overview and Agenda (Slides 1-3): Hero slide with a central vacancy heatmap, agenda timeline in arrowed paths for sections like "Market Analysis" and "Talent Pipeline."
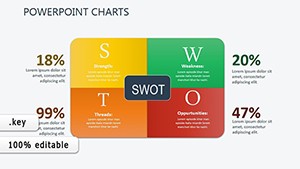
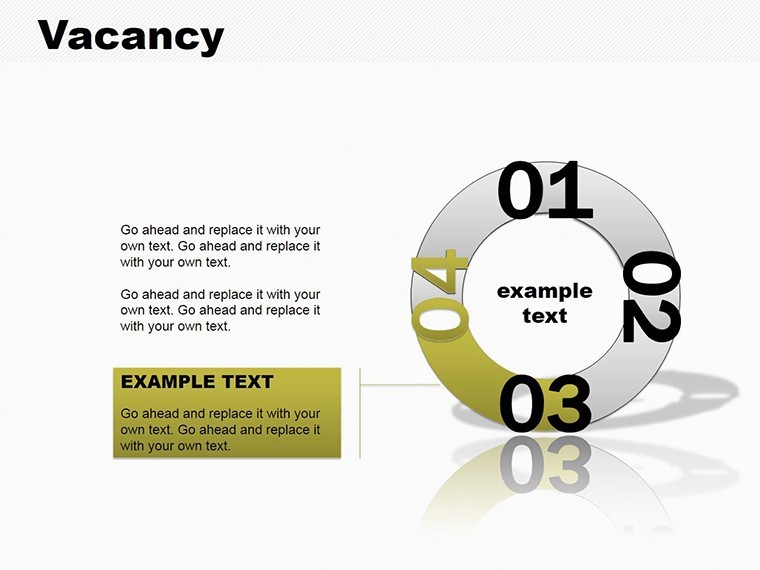
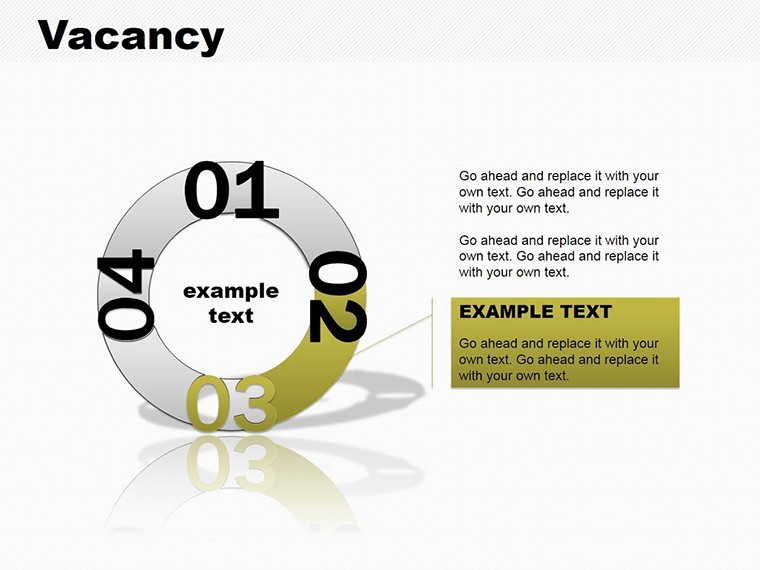
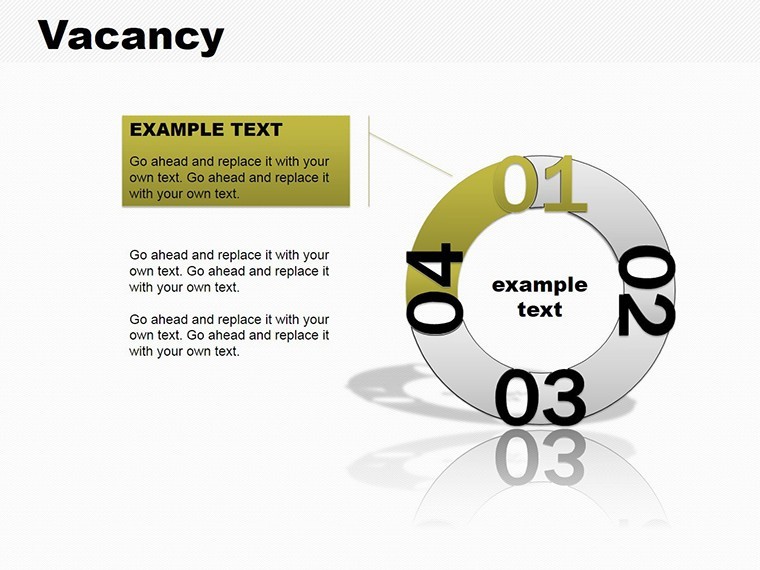
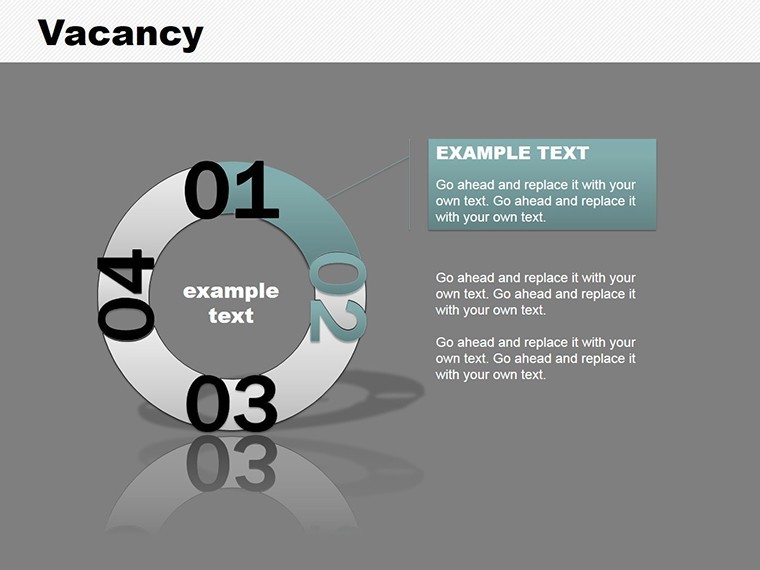
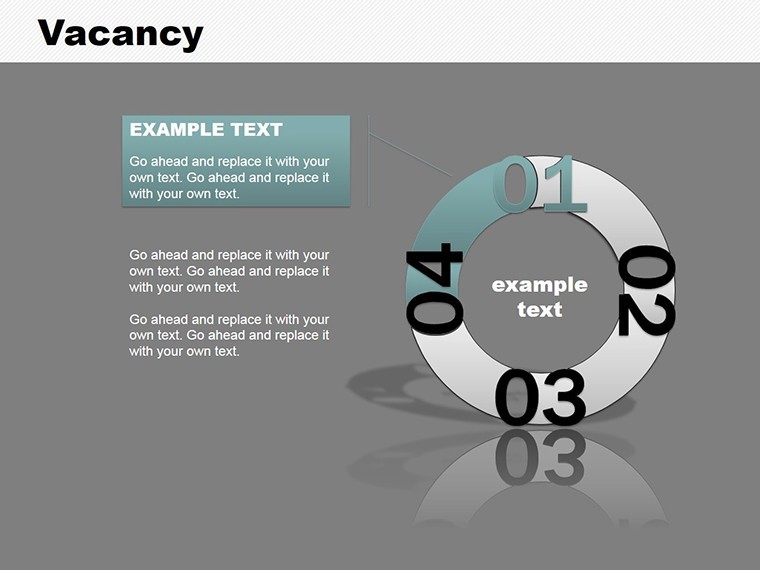
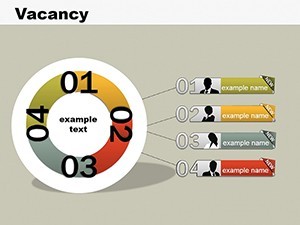
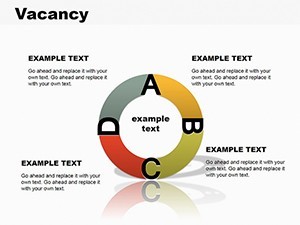
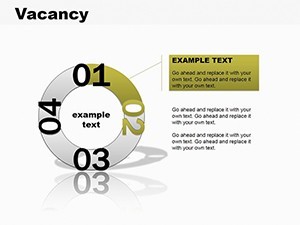
- Role Breakdowns (Slides 4-10): Detailed vacancy cards with donut charts for required vs. preferred skills - e.g., 70% AutoCAD proficiency in sunset oranges - plus SWOT matrices for each position.
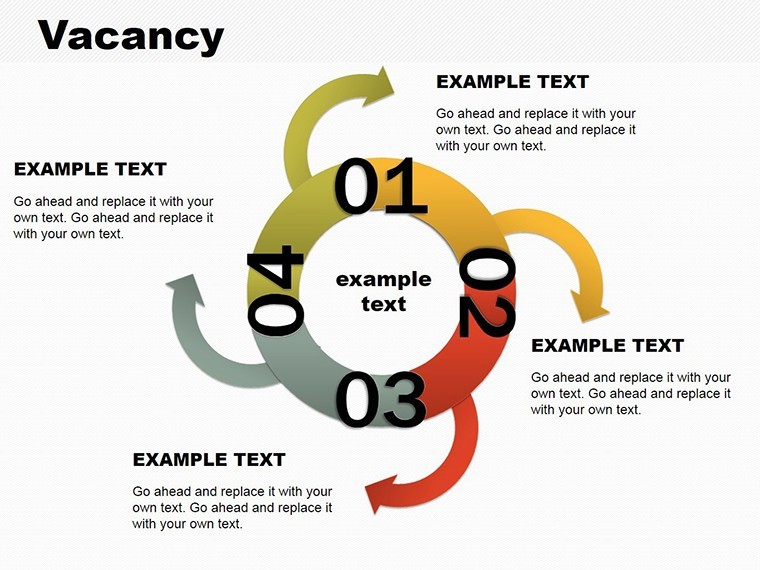
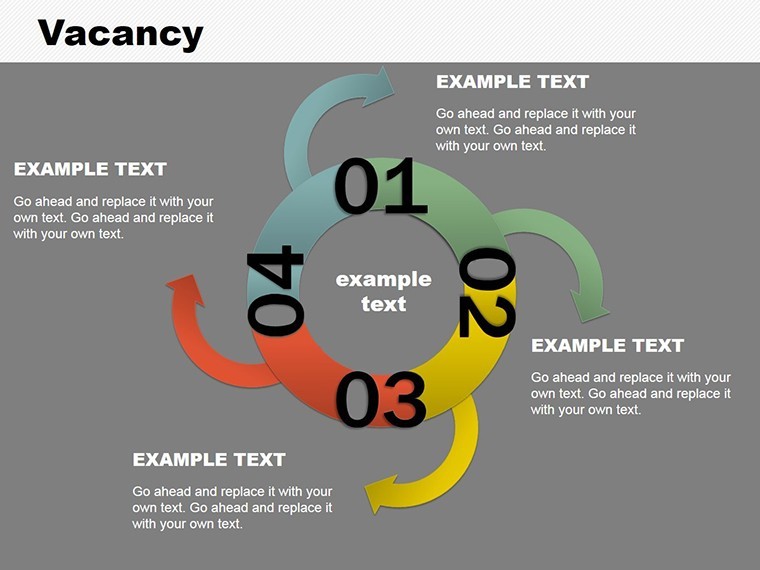
- Funnel and Metrics (Slides 11-15): Sankey flows for sourcing channels (LinkedIn in deep indigos, referrals in warm golds), line graphs forecasting hiring waves tied to project phases.
- Action and Close (Slides 16-19): Gantt charts for recruitment timelines, call-to-action slides with QR codes to apply, and a summary infographic recapping ROI projections.
A real-world win: A mid-sized firm specializing in historic preservations used these charts in a quarterly review, visualizing a 25% faster fill rate post-implementation, crediting the template's clarity for executive buy-in on expanded sourcing budgets.
From Boardroom to Build Site: Proven Use Cases in Architecture HR
This template thrives in niche applications. For firm-wide talent audits, employ bubble charts sizing roles by urgency - large for senior architects amid booms - clustering by department for balanced growth views. In diversity initiatives, waterfall charts decompose hiring disparities, guiding targeted campaigns that enhance your firm's cultural blueprint.
Versus vanilla Excel dumps, this elevates discourse: Animations reveal cascading impacts of unfilled roles on project delays, per PMI studies showing 20% efficiency gains from visualized planning. Sync with ATS like Workday for auto-pulls, or layer in Revit exports for role-specific tech stacks, bridging HR and design silos effortlessly.
Pro tips: Customize with firm lore - icon sets evoking iconic structures like the Guggenheim for innovation roles - and test readability in 10pt font for crowded conference rooms. For global teams, multilingual placeholders keep it versatile.
Secure Your Dream Team - Download and Deploy Now
Why wait for vacancies to echo? Grab the Professional Vacancy Charts Keynote Template today, craft pitches that hire heroes, and watch your firm flourish. Your next great addition starts with one stunning slide.
Frequently Asked Questions
Is this template suitable for non-HR users in architecture?
Yes, principals and project leads use it for staffing forecasts in proposals.
How do I integrate live data from recruitment software?
Via Keynote's data import features or embedded links to tools like BambooHR.
Are animations included for the charts?
Pre-set entrance effects for funnels and builds, fully tweakable.
What's the resolution for exported files?
High-res 300 DPI PDFs, ideal for print collateral.
Can I reskin the icons for my brand?
100% - SVG-based for infinite scalability and recoloring.
Does it cover remote hiring trends?
Yes, dedicated slides for virtual interview metrics and hybrid role visualizations.