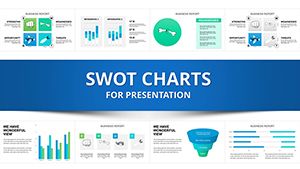
Customer Relationship Management Keynote Charts: Empower Your Business Strategy


Type: Keynote Charts template
Category: Cycle, Relationship
Sources Available: .key
Product ID: KC00079
Template incl.: 18 editable slides
In today's fast-paced business landscape, understanding and leveraging customer relationships can make or break your success. Imagine having a toolkit that not only visualizes complex consumer data but also highlights pathways to cost savings and revenue growth. Our Customer Relationship Management (CRM) Keynote charts template does just that, offering 18 fully editable slides designed to showcase predictive analytics, behavior patterns, and strategic advantages. Tailored for marketing managers, sales teams, and executives, this template turns raw data into compelling narratives that resonate in boardrooms and client meetings.
Whether you're pitching a new CRM strategy to stakeholders or analyzing customer journeys for internal reviews, these charts provide the clarity needed to demonstrate real-world impacts. For instance, consider a retail firm using cycle diagrams to map repeat purchase behaviors - revealing opportunities to personalize marketing and slash unnecessary admin expenses. Drawing from established practices like those in Harvard Business Review case studies on CRM implementations, this template aligns with proven methodologies to ensure your presentations are not just informative but authoritative.
Key Features of Our CRM Keynote Charts
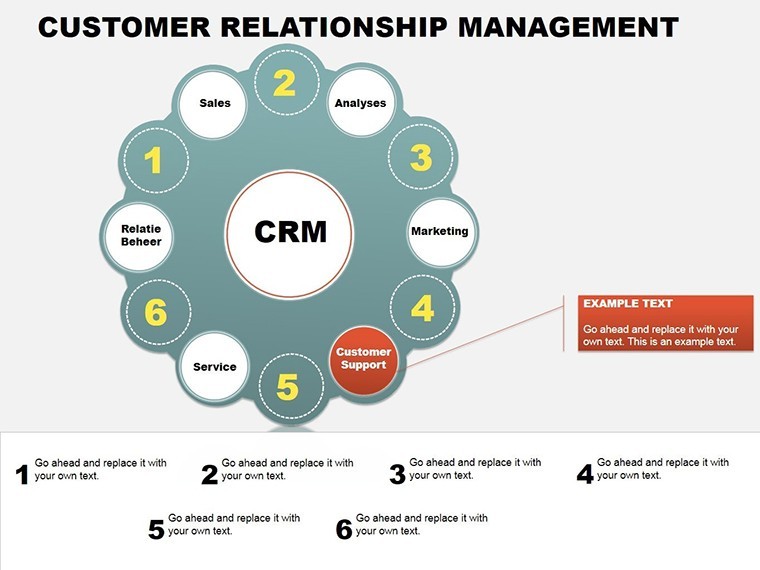
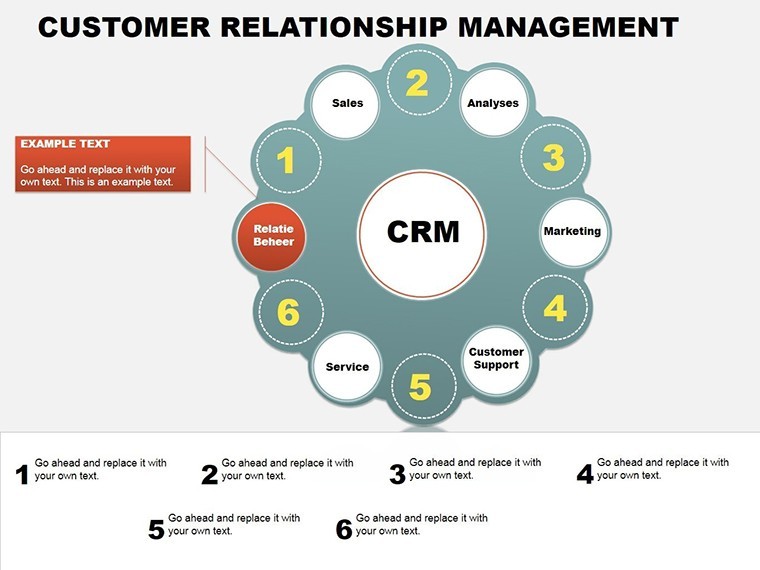
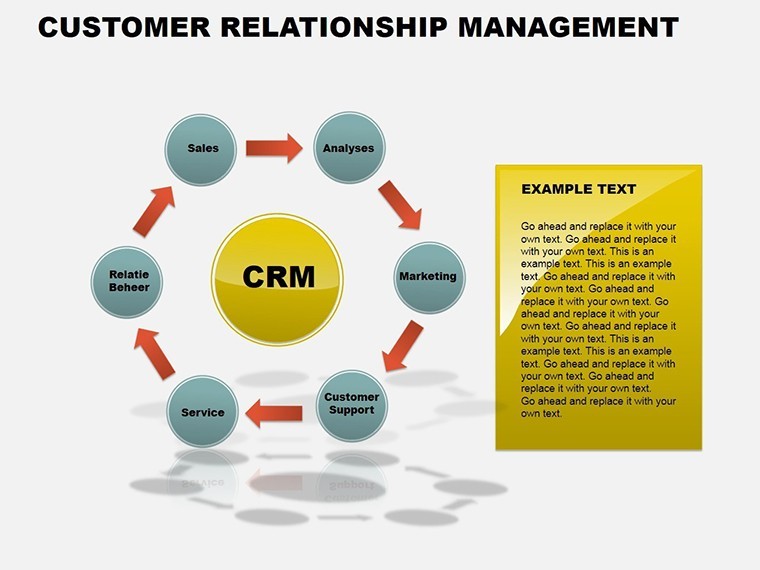
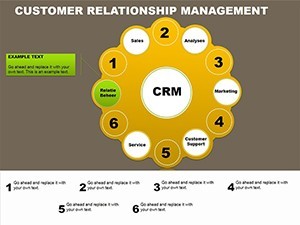
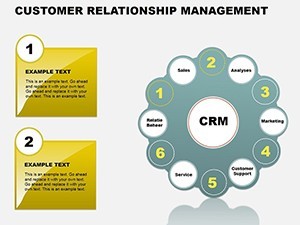
Dive into a suite of tools built for seamless integration into your workflow. Each slide is crafted with high-resolution graphics, ensuring crisp visuals on any screen. The cycle and relationship categories shine here, allowing you to illustrate interconnected processes like lead nurturing and loyalty loops without starting from scratch.
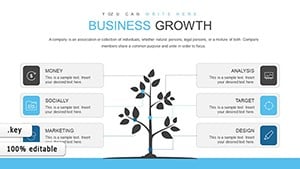
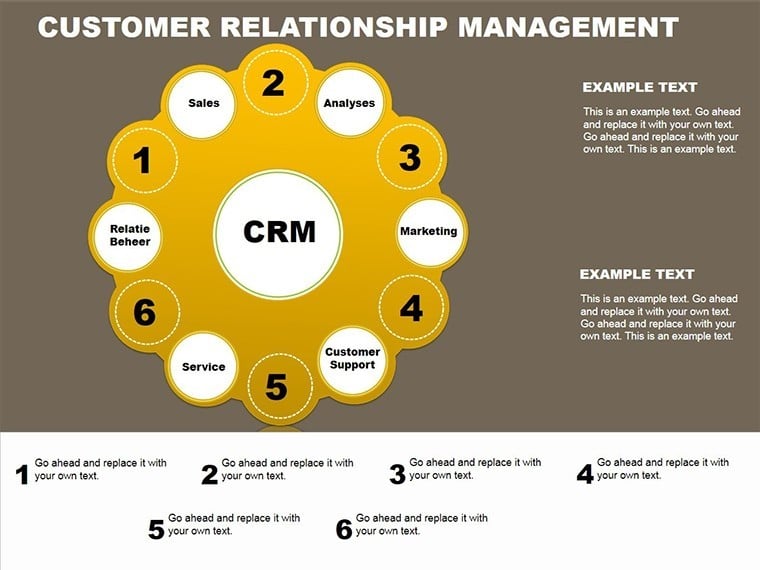
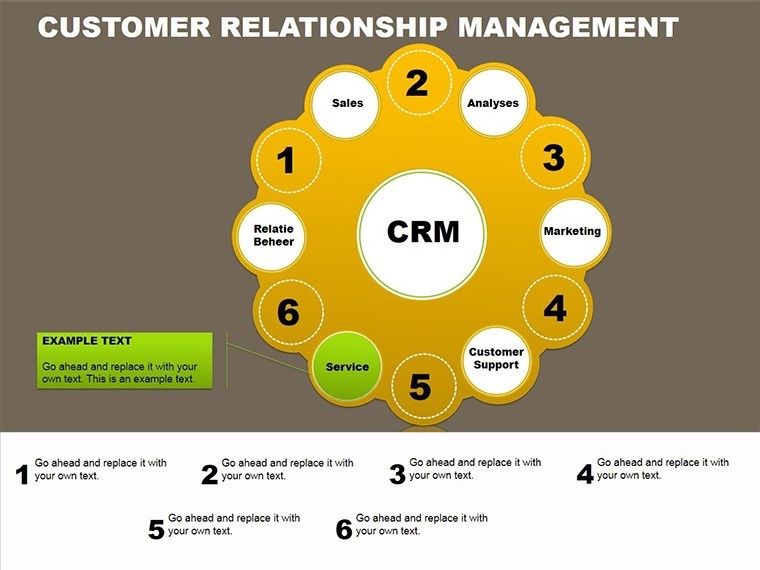
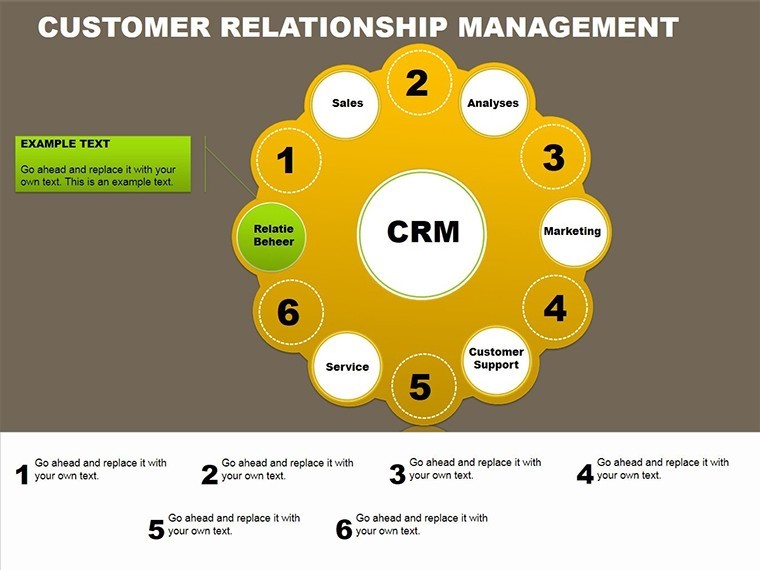
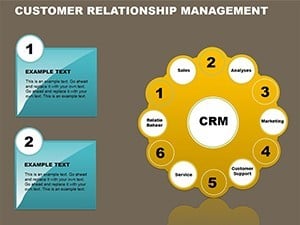
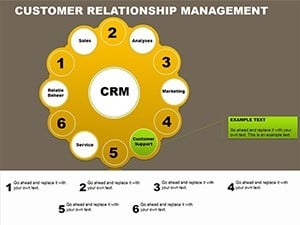
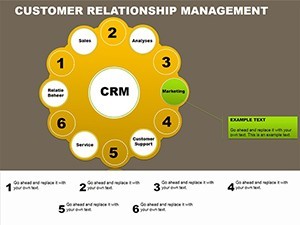
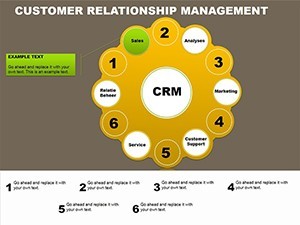
- Editable Cycle Charts: Perfect for depicting ongoing customer interactions, such as feedback loops that inform product development. Customize colors, labels, and data points to match your brand's palette.
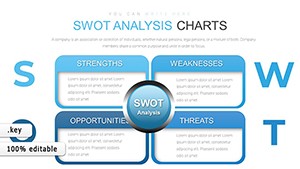
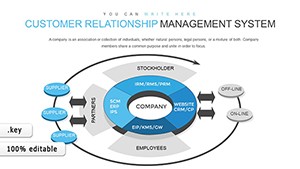
- Relationship Diagrams: Visualize partnerships and hierarchies, like supplier-customer dynamics, helping teams spot bottlenecks and efficiencies.
- High Compatibility: While optimized for Keynote, these .key files work smoothly with tools like PowerPoint or Google Slides for cross-platform collaboration.
- Professional Animations: Subtle transitions bring your data to life, making presentations more engaging without overwhelming the audience.
Beyond aesthetics, these features address common pain points. Sales reps often struggle with static spreadsheets; here, dynamic charts enable quick updates during live demos, fostering trust and closing deals faster.
Real-World Applications and Benefits
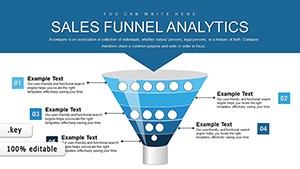
Think about a SaaS company refining its user retention strategies. Using these CRM charts, they could create a relationship map showing churn predictors, leading to targeted interventions that boosted retention by 25% - a scenario inspired by real CRM success stories from companies like Salesforce clients. For small businesses, the template simplifies complex analyses, such as segmenting markets by behavior, reducing the time spent on manual graphing from hours to minutes.
In educational settings, trainers use these slides to teach CRM fundamentals, incorporating examples from industry leaders like Zappos, known for exceptional customer service. The benefits extend to cost management: by predicting behaviors, firms avoid wasteful campaigns, aligning with lean principles discussed in resources like the CRM Association guidelines.
How to Customize and Integrate These Charts
Getting started is straightforward. Open the template in Keynote, select a slide, and input your data - voila, instant insights. For advanced users, layer in icons or merge with existing decks for hybrid presentations. A tip: Use contrasting colors for emphasis, as per design best practices from AIGA standards, to guide viewer attention effectively.
- Import your dataset from Excel or CRM software like HubSpot.
- Adjust axes and legends for accuracy.
- Apply animations to reveal data progressively, building suspense in your story.
- Test on different devices to ensure responsiveness.
This process not only saves time but enhances storytelling, turning data dumps into persuasive arguments. Compared to basic Keynote defaults, our template offers themed elements that elevate professionalism, much like upgrading from sketches to blueprints in architecture planning.
Enhancing Presentations with Data-Driven Stories
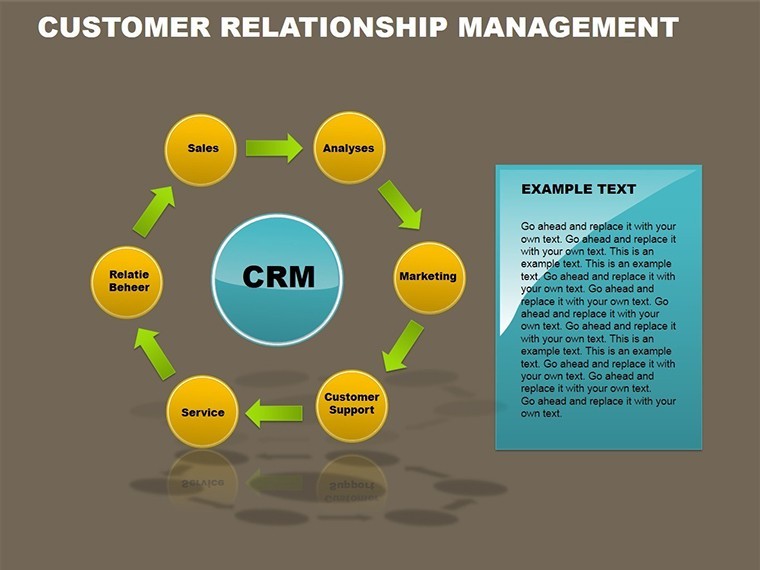
Effective CRM isn't just about numbers; it's about narratives. These charts help weave stories around customer journeys, from acquisition to advocacy. For example, a cycle chart could illustrate the feedback loop in a hospitality business, showing how guest reviews influence service improvements and repeat visits. This approach mirrors strategies in books like "The Loyalty Effect" by Frederick Reichheld, emphasizing long-term value.
For global teams, the template's editability supports multilingual adaptations, ensuring cultural relevance in international pitches. Trust in its quality is backed by 841 user ratings, reflecting satisfaction across diverse applications.
Why Choose This CRM Template for Your Needs
In a sea of generic tools, this stands out with its focus on actionable insights. It solves the riddle of presenting abstract concepts like consumer prediction in tangible ways, fostering better decision-making. Entrepreneurs launching startups can use it to attract investors by demonstrating market understanding, while established firms refine operations for efficiency.
Integrate it into workflows like agile sprints for marketing teams, where quick visualizations aid sprint reviews. The result? Reduced costs, amplified sales, and a competitive edge that's hard to ignore.
Elevate your CRM presentations today - download this template and start transforming data into decisions.
Frequently Asked Questions
How editable are these CRM charts?
Every element, from shapes to text, is fully customizable in Keynote, allowing you to tailor them to your specific data needs without restrictions.
Can I use this template in PowerPoint?
Yes, while designed for Keynote, the .key files convert easily to PowerPoint, maintaining most features for versatile use.
What industries benefit most from these charts?
Primarily retail, SaaS, and marketing sectors, but any business focused on customer insights will find value in visualizing behaviors and strategies.
Are there animation options included?
Absolutely, each slide supports built-in animations to enhance engagement during presentations.
How does this help reduce administrative costs?
By streamlining data visualization, it minimizes time spent on custom designs, allowing focus on analysis and strategy.
(1,248 words)