Triangular Pyramid Keynote Charts: Master Data Visualization
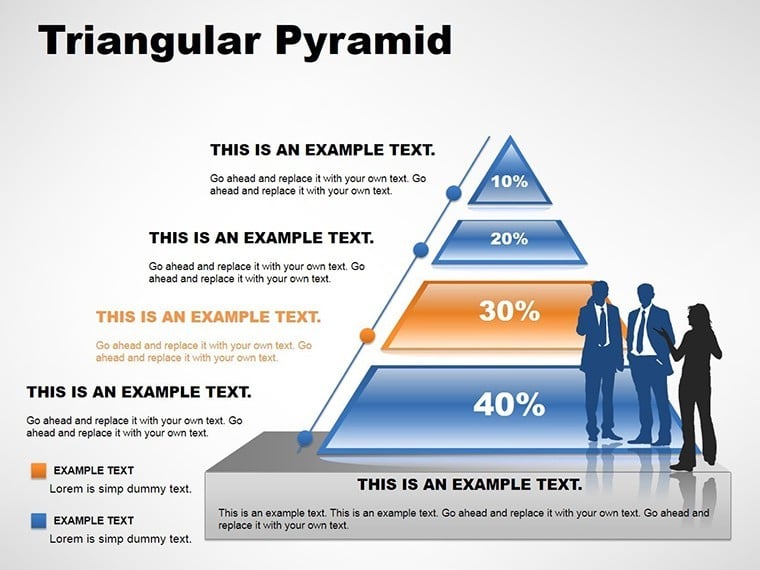


Harness the power of structured visuals with our Triangular Pyramid Keynote Charts template, featuring 8 editable slides for presenting percentages, production stats, or workflow hierarchies. Suited for analysts, project managers, and educators, this template simplifies complex data into pyramid forms, making insights climb to the top. From tracking project milestones to displaying sales funnels, it's your go-to for clear, impactful communication.
Think of a pyramid where base layers show broad metrics, tapering to key outcomes - ideal for AAR reports or KPI dashboards. Compatible with Keynote in .key and .kth, customization is straightforward, aligning with design standards from sources like Pyramid Principle by Barbara Minto.
Standout Features for Precise Presentations
Pyramids integrate with tables for hybrid views, offering depth in data display. Each slide is fully scalable, perfect for detailed examinations.
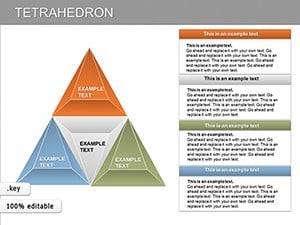
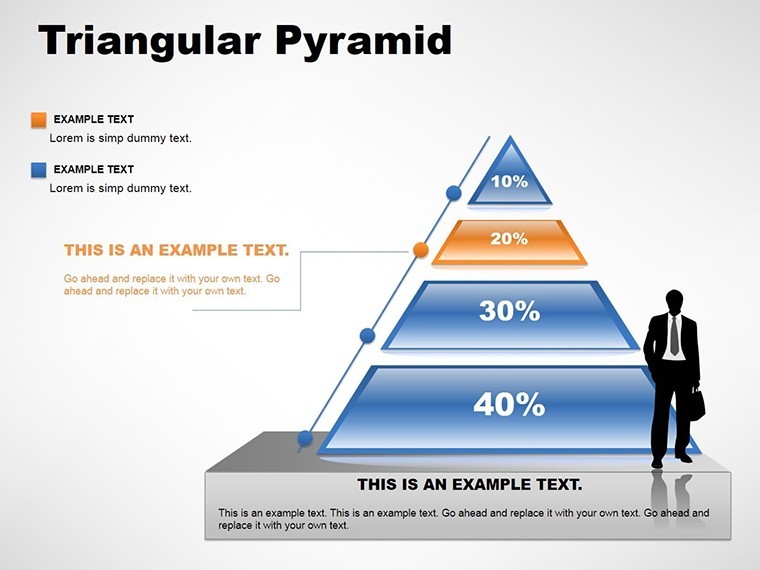
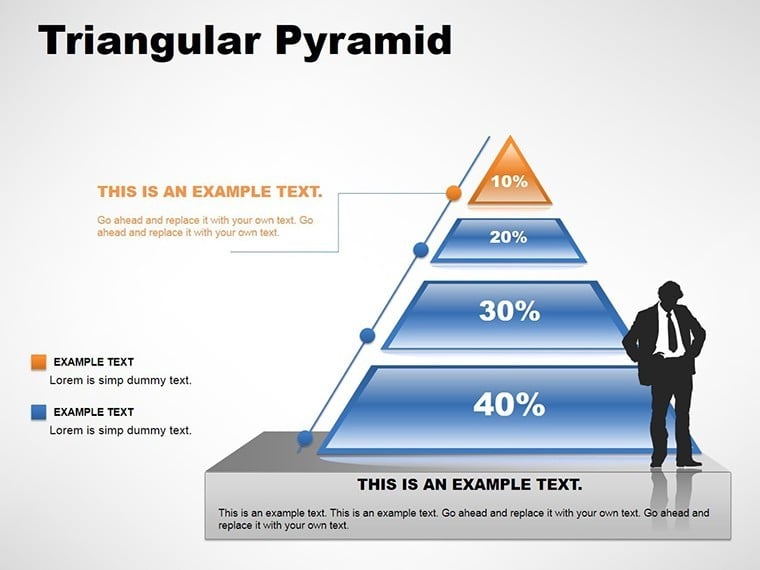
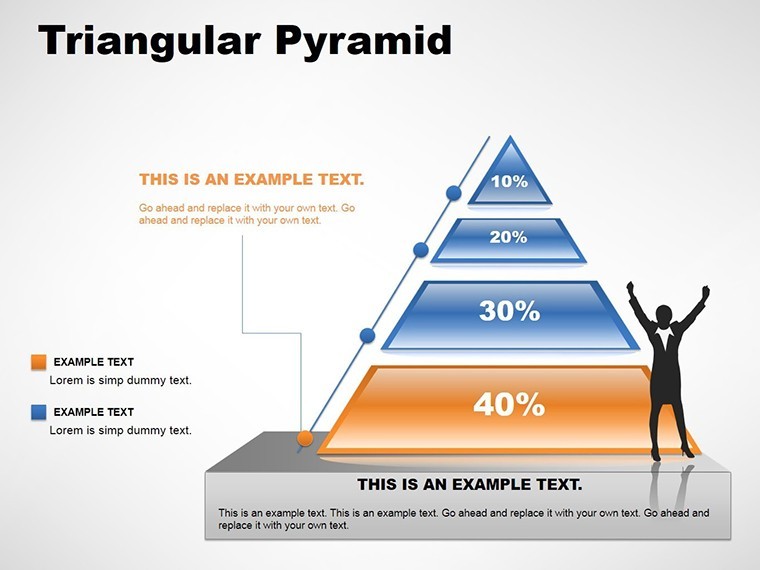
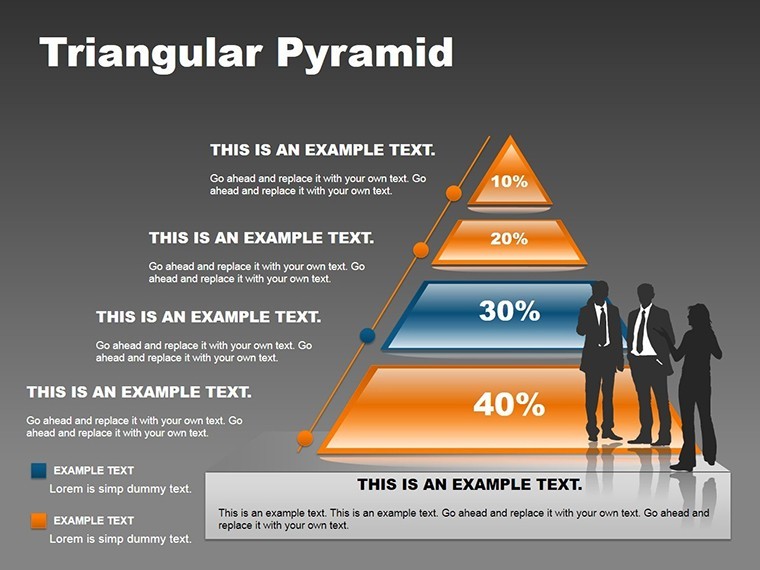
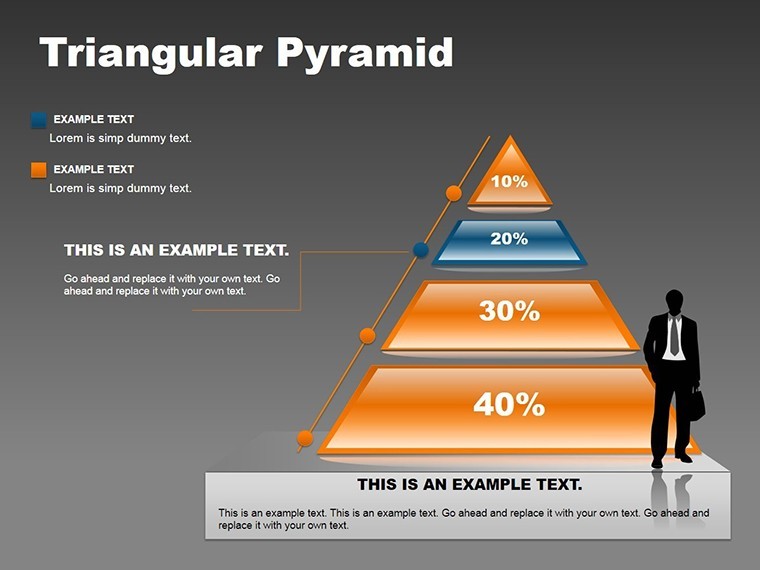
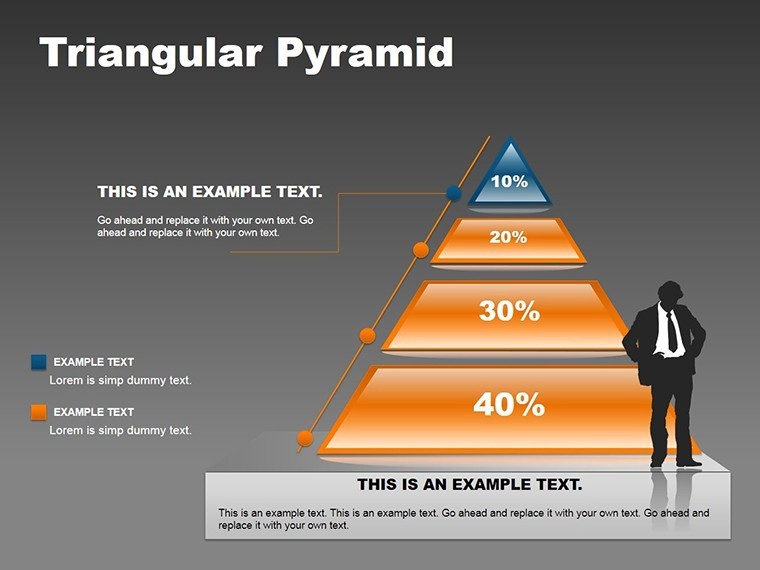
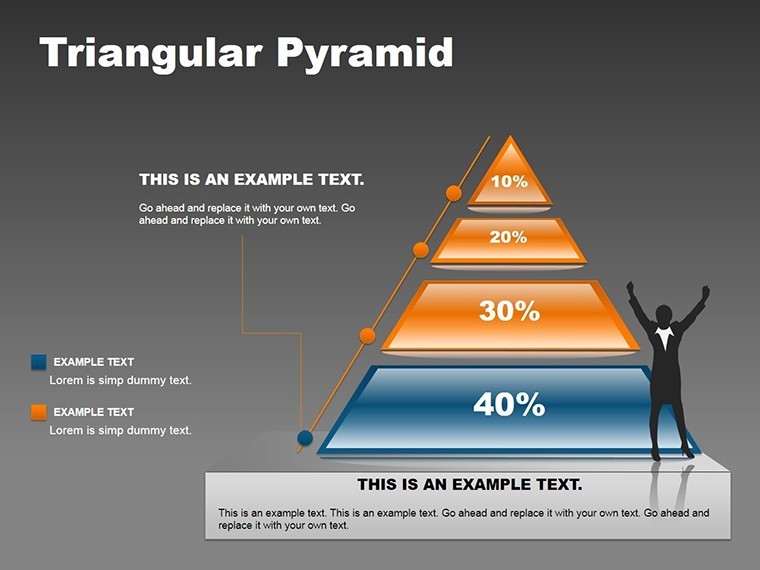
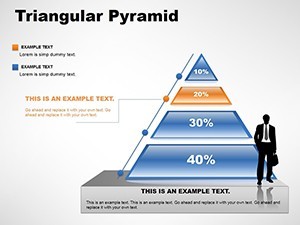
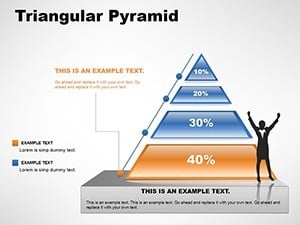
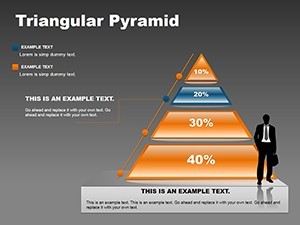
- 8 Specialized Slides: From simple triangles to multi-level pyramids.
- Editable Layers: Adjust heights, colors, and labels.
- Table Integration: Combine with data grids for comprehensive views.
- Statistical Focus: Optimized for percentages and hierarchies.
- High-Quality Vectors: Crisp visuals everywhere.
Enhances retention, as visuals aid memory per cognitive studies.
Applications in Professional Scenarios
For project managers, pyramids show phase completions, aiding in agile reviews. A construction firm used similar for progress tracking, cutting meeting times by 20%.
In sales, funnel pyramids illustrate conversion rates, driving strategy tweaks.
Educators can teach hierarchies, like organizational structures or food chains.
Customization Steps for Efficiency
- Launch in Keynote and select pyramid slide.
- Enter data into tiers.
- Customize via format panel.
- Add effects for emphasis.
- Deliver with confidence.
Links well with Excel for data pulls.
Better Than Built-In Tools
Offers specialized pyramid designs with expert backing for reliable use.
Ascend your data game - grab this template and peak performance.
Frequently Asked Questions
How many levels per pyramid?
Up to 5, expandable.
Works on iOS Keynote?
Yes, cross-platform.
Suitable for statistics?
Perfectly, with percentage tools.
Can I merge with tables?
Yes, for enriched visuals.
Refund policy?
Satisfaction guaranteed.