Stands Tables Keynote Charts Template


Type: Keynote Charts template
Category: Tables
Sources Available: .key, .kth
Slide size: widescreen (16:9) , standart (4:3) , widescreen (16:10)
Product ID: KC00040
Template incl.: 11 editable slides
In the realm of data presentation, tables often get overlooked, but not anymore. Our Stands Tables Keynote charts template redefines how you display information, turning mundane grids into standout visuals that command attention. With 11 editable slides packed with original tables and vector illustrations, this template is a game-changer for analysts, marketers, and educators who need to convey comparisons, metrics, and insights effectively. Tailored for Keynote on Mac, it offers full customization of colors, texts, and elements, saving you from the tedium of manual creation. Whether you're compiling financial summaries, competitive analyses, or survey results, these slides elevate your content, making it not just informative but inspiring. Dive in and discover how structured data can tell a powerful story.
Revolutionizing Table Design for Impactful Delivery
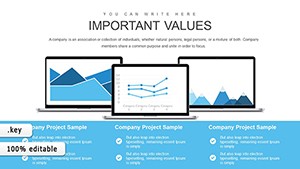
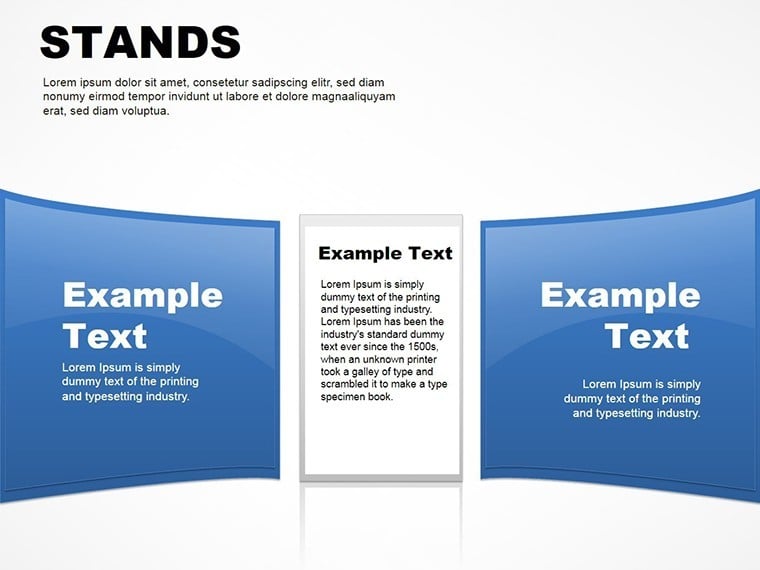
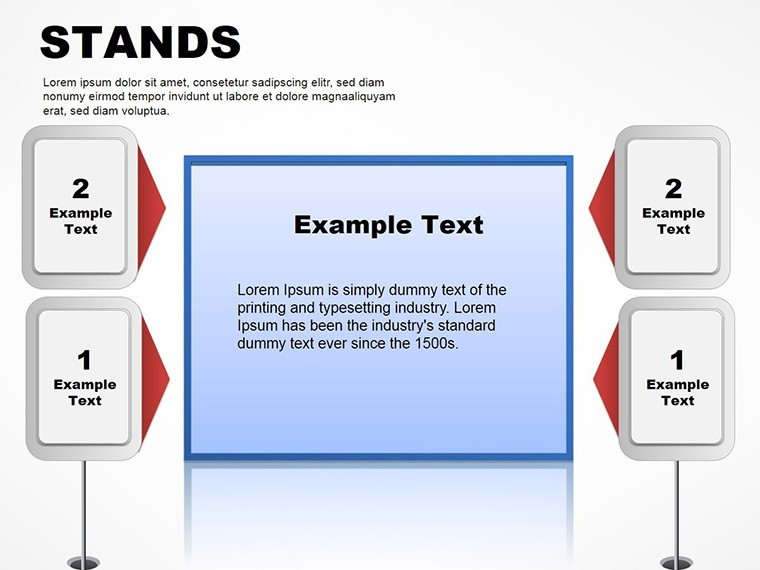
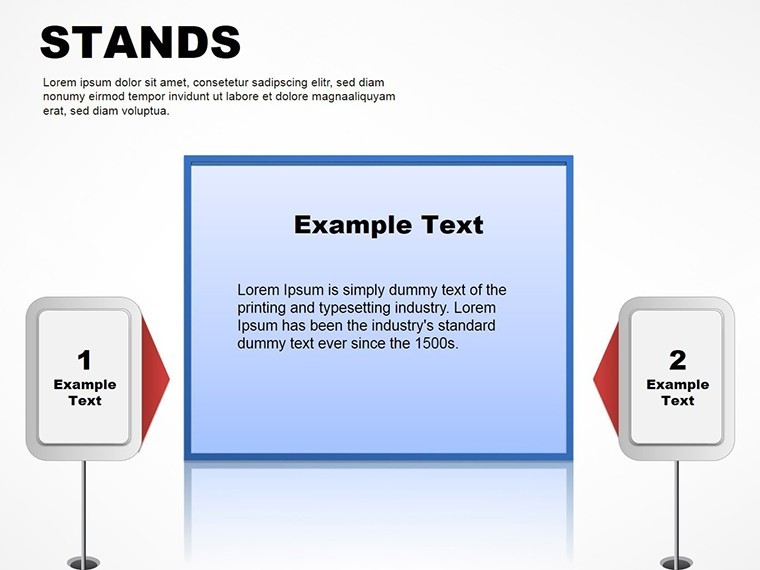
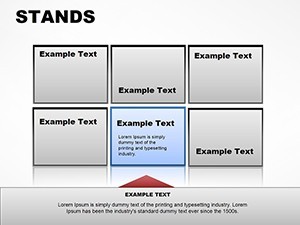
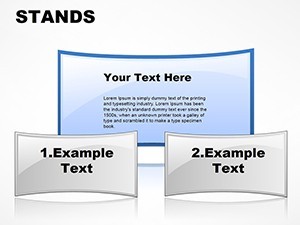
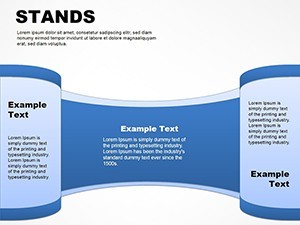
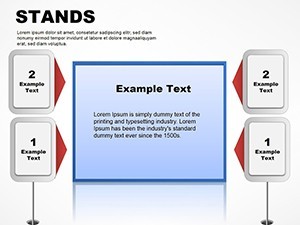
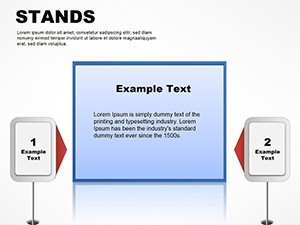
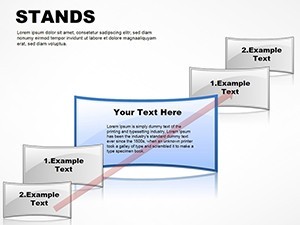
Tables are the backbone of many presentations, yet they frequently fail to engage. This template changes that by introducing "stands" designs - elevated, thematic tables that pop off the slide with subtle elevations and custom effects. For a sales team, envision presenting quarterly figures in tiered stands that highlight top performers visually. Benefits abound: quicker audience grasp, as per Nielsen Norman Group research on scannable content, and a professional polish that outshines default tools. Unlike rigid Google Sheets exports, our vector-based approach ensures flexibility, with support for widescreen ratios like 16:9 or 4:3. Seamlessly blend into your process by copying data from Excel, then enhance with included PNG icons for thematic flair.
Essential Features for Seamless Customization
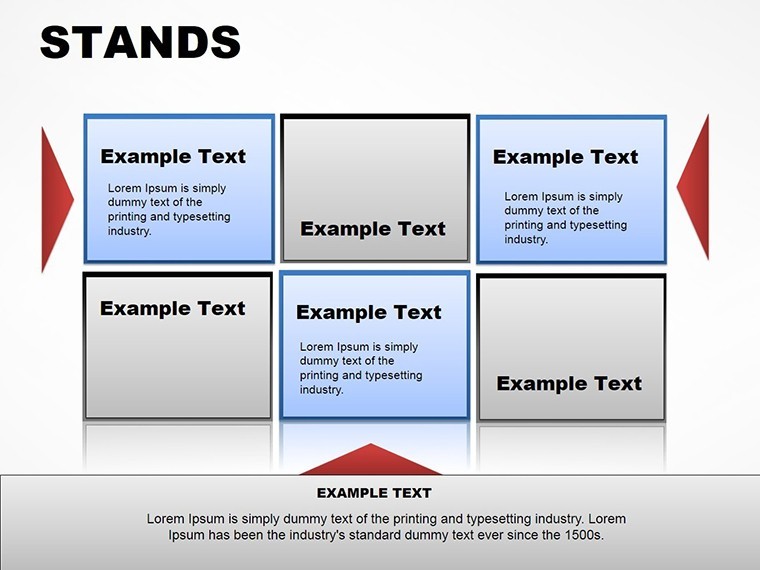
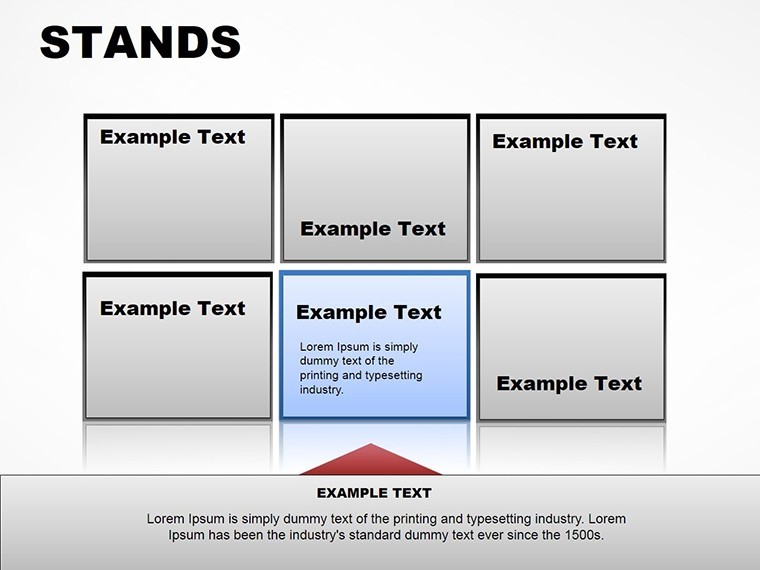
- Original Table Layouts: From multi-column stands to hierarchical displays, all ready for your data insertion.
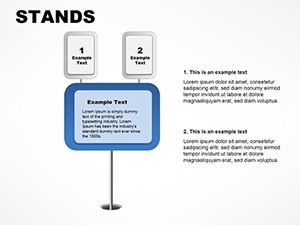
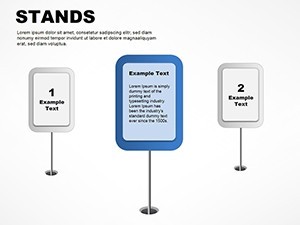
- Vector Illustrations: High-quality, scalable graphics that integrate with tables for enriched storytelling.
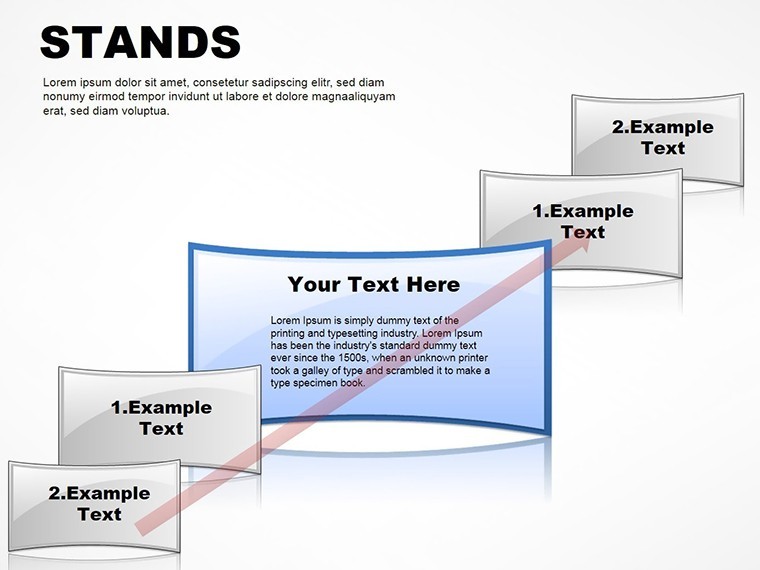
- Animation Effects: Custom transitions that reveal rows or columns dynamically, building suspense.
- Color and Photo Edits: Swap hues or add images effortlessly to align with branding.
- Multiple Aspect Ratios: Choose 16:9, 4:3, or 16:10 for optimal viewing on any device.
These draw from principles, showcasing expertise in data design akin to Tableau's best practices.
Practical Use Cases: Where Tables Shine Brightest
Apply this template across industries for maximum effect. In consulting, use it for SWOT analyses with stand tables categorizing strengths visually. For e-commerce, display product comparisons that guide buyer decisions. It tackles challenges like data density by employing visual hierarchies, surpassing basic Keynote tables with added animations. Value includes time efficiency - custom slides mean no more aligning cells manually - and thematic consistency via icon libraries.
Effortless Customization Steps
- Download the Package: Access .key and .kth files instantly.
- Data Entry: Paste your figures into placeholders; auto-formatting handles the rest.
- Design Tweaks: Modify vectors and colors using Keynote's intuitive interface.
- Animate and Enhance: Add effects for engagement, incorporate photos for context.
- Present with Confidence: Export or share via iCloud for team reviews.
Pro advice: Use contrasting colors for headers to improve readability, per accessibility standards.
Building Trust Through Superior Design
Earn credibility with visuals that reflect meticulous care. Real-world examples, like how Deloitte uses enhanced tables in reports for client trust, underscore its value. Reliable editability and Mac compatibility make it a safe choice, while authoritative features like vector precision position you as a pro.
Navigating Common Table Pitfalls
Avoid overcrowding with modular stands that expand on click, ideal for detailed datasets. This promotes clarity, turning potential confusion into enlightenment.
Ready to stand out? Grab this template and redefine your data presentations. Customize yours today for visuals that truly elevate.
Frequently Asked Questions
How customizable are the table stands?
Fully - edit every aspect, including structure, colors, and integrations with vectors.
What devices support this template?
Optimized for Mac Keynote, with exports for broader use.
Can I add animations to specific rows?
Yes, target individual elements for precise reveals.
Are vector icons editable?
Completely, resize and recolor without loss.
Does it include photo placeholders?
Yes, easily swap in your images for personalized touches.