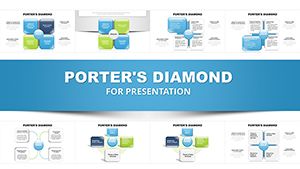
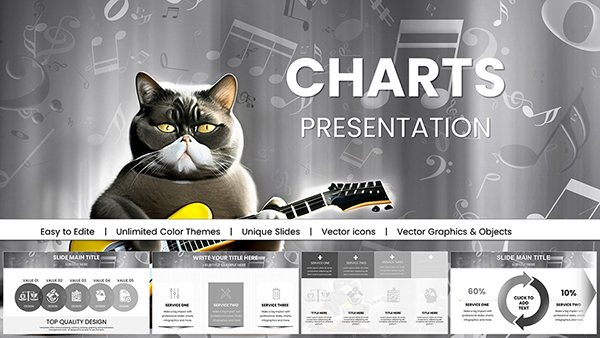
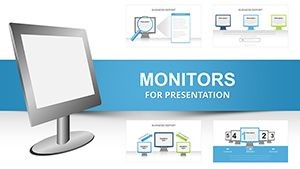
Pro IT Keynote Charts: Architect Your Tech Narratives with Flair


Type: Keynote Charts template
Category: Illustrations
Sources Available: .key
Product ID: KC00018
Template incl.: 29 editable slides
Step into the command center of IT presentations, where tangled networks untangle into elegant flows and cybersecurity threats morph into fortified diagrams that command respect. The Professional IT Keynote Charts template delivers exactly that: 29 meticulously crafted, editable slides that empower IT managers, developers, and consultants to demystify tech complexities with contemporary polish. Whether you're briefing on cloud migrations, dissecting data pipelines, or rallying teams around project roadmaps, this toolkit turns jargon-heavy updates into sleek, stakeholder-ready spectacles that drive alignment and applause.
Rooted in the demands of the IT sector, these charts transcend generic templates by embedding domain-specific smarts - like server icons for infrastructure stacks or lock motifs for access controls - into Keynote's robust framework. As .key files, they sync effortlessly with your Mac ecosystem, supporting drag-and-drop data from tools like Jira or AWS consoles. This isn't about flashy effects; it's strategic visualization that aligns with ITIL standards, ensuring your slides not only look pro but perform like one - scalable, secure, and story-driven for the high-stakes world of tech delivery.
Standout Features: The IT Edge in Every Slide
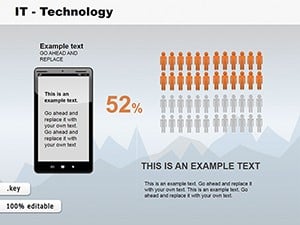
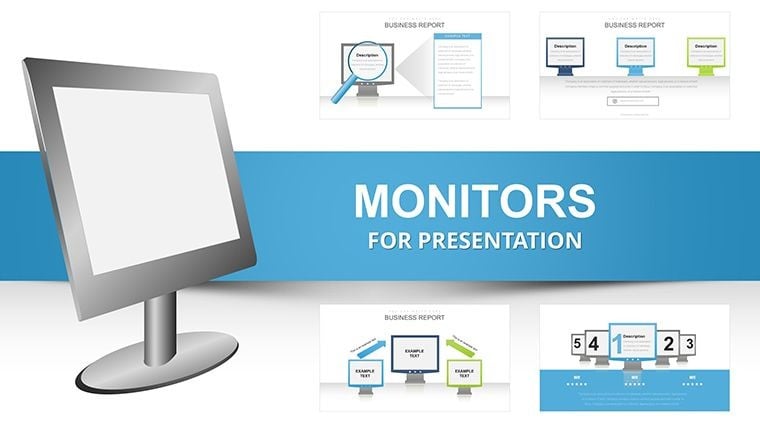
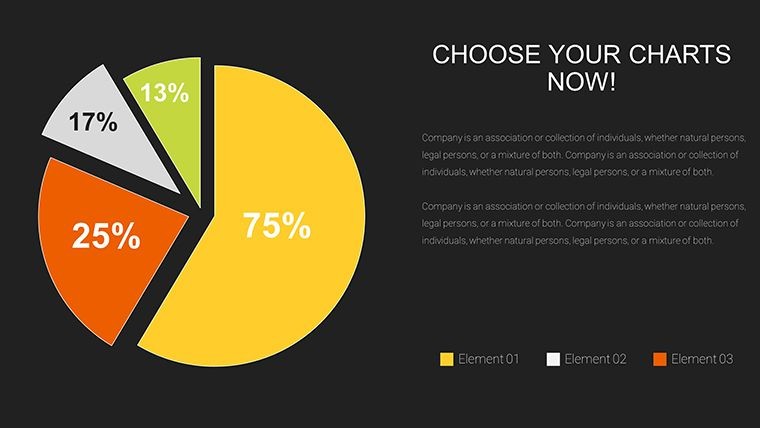
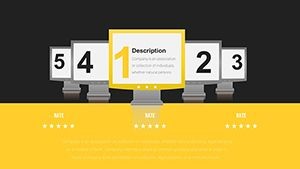
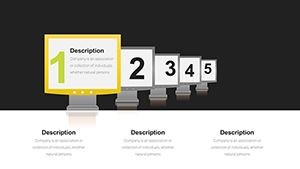
Powering these 29 slides is a suite of features fine-tuned for tech pros, from customizable infographics that flowchart DevOps pipelines to dynamic charts tracking uptime metrics with real-time relevance.
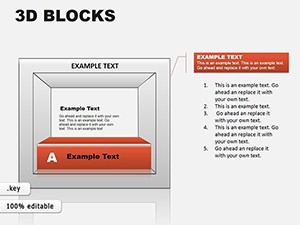
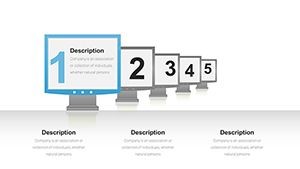
- Tech-Tailored Editability: Reshape bar charts for bandwidth allocations or tweak node connections in network diagrams, all via intuitive Keynote handles that preserve logical flows.
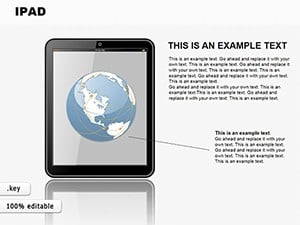
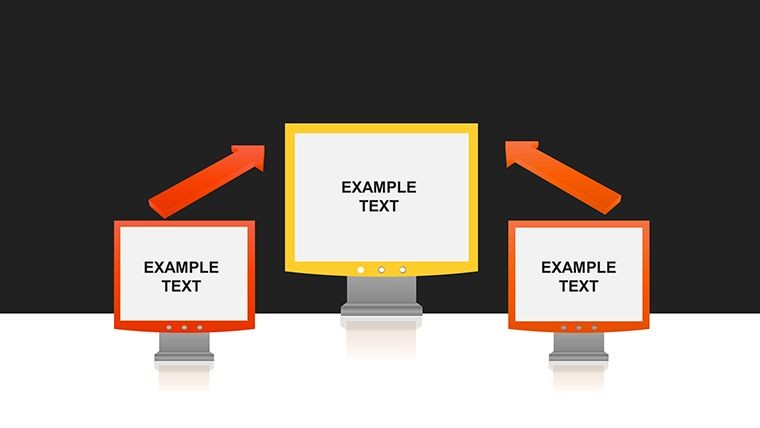
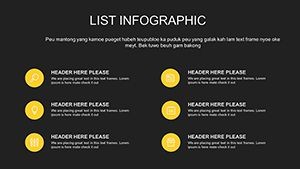
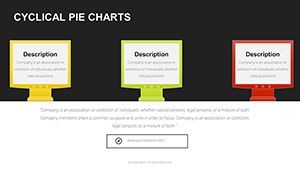
- Infographic Arsenal: 40+ IT-themed elements, including circuit-board timelines and binary-code pies, to encode processes visually without overwhelming the viewer.
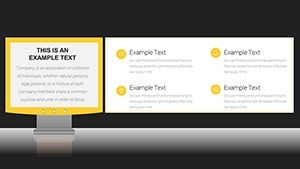
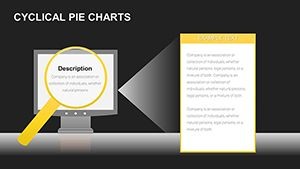
- Sleek, Scalable Layouts: Responsive grids that adapt to widescreen briefs or mobile reviews, with dark-mode variants for late-night coding sessions turned presentations.
- Brand Sync Simplicity: One-click color schemes to mirror your org's palette, ensuring compliance with branding guidelines while amplifying professionalism.
These align with authoritative sources like CIS benchmarks for secure viz practices. A network engineer at a SaaS giant, for instance, harnessed these for a firewall audit deck, using radial charts to radiate vulnerability radii - securing budget approvals with visuals that visualized risks palpably.
Deployment Guide: From Download to Demo-Ready
Integration is as plug-and-play as a USB-C dock. Launch the template, pinpoint a slide like the hierarchical org chart for team structures. Step one: Feed in your LDAP exports, and watch hierarchies bloom into connected clusters.
- Configure Connections: Hyperlink nodes to appendices, enabling deep dives into API endpoints during Q&A.
- Infuse Interactivity: Add Keynote transitions to simulate data flows, like cascading waterfalls for ETL processes.
- Secure and Share: Embed password-protected sections for sensitive stats, exporting to encrypted PDFs for compliance-heavy shares.
- Optimize Output: Compress for email blasts without losing crisp vector edges, ready for global team syncs.
Versus clunky Lucidchart embeds, this native speed slashes prep from days to hours, letting you iterate on feedback loops swiftly.
IT Impact Zones: Use Cases That Code Success
In cybersecurity briefs, deploy Venn diagrams with shield overlays to intersect threat vectors, clarifying overlap defenses for CISOs. For cloud computing pitches, Sankey flows trace resource migrations, quantifying cost savings in rivers of revenue that sway procurement.
Spotlight story: A dev lead visualized sprint velocities with Gantt variants, the template's polish turning burndown charts into burnout preventers - boosting velocity 20% via transparent tracking. From project management war rooms to consultant client cons, these applications fuse informational depth with commercial punch, closing deals with data that dazzles.
Elite Over Everyday: The Pro IT Advantage
Everyday charts falter in tech's nuance - lacking icons for qubits or scales for petabytes. This template's 29 slides counter with bespoke depth, enhancing persuasion per Gartner insights on viz ROI. It's the bespoke suit to off-the-rack, fitting IT's contours perfectly for standout sessions.
Tech Tips: Level Up Your IT Viz Game
Insider advice: Use hex bins for geospatial network plots to densify coverage insights, and integrate Zapier hooks for live metric feeds. Adhere to WCAG for alt-text on icons, fostering inclusive tech talks. These elevate from good to governance-grade.
Forge ahead in IT's frontier? Acquire the Professional IT Keynote Charts today and chart courses to commendation. Your tech tales deserve the pro touch.
Frequently Asked Questions
What IT topics do these Keynote charts best support?
From cybersecurity flows to cloud analytics and project timelines, the 29 slides cover core IT domains with tailored infographics.
How customizable are the charts for brand alignment?
Fully - adjust colors, fonts, and layouts effortlessly in Keynote to reflect your company's identity without design compromises.
Can developers use this for code review presentations?
Yes, with flowchart and timeline slides that map commit histories and bug funnels graphically for team retros.
Are there built-in animations for dynamic IT demos?
Indeed, subtle builds and paths simulate processes like packet routing, customizable to your demo's tempo.
Does the template support data imports from IT tools?
Seamlessly - pull from CSV, JSON, or tables in Jira/Tableau for auto-updating visuals that stay current.
What makes these charts trustworthy for stakeholder reports?
Vector precision and ITIL-aligned designs ensure accuracy and professionalism, backed by expert-vetted elements.