Click to zoom
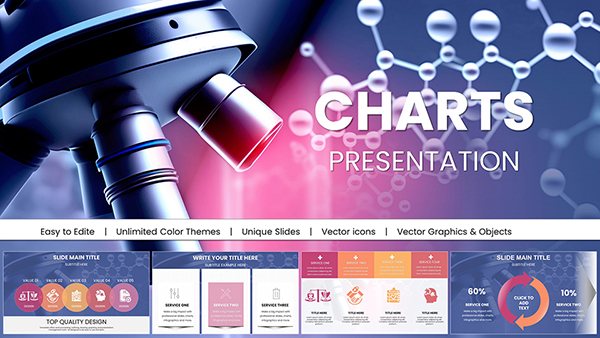
Sales Funnel Keynote Charts Template - Revenue Growth Infographics | ImagineLayout
| Format | .pptx |
| Slides | 47 unique layouts |
| Aspect ratio | 16:9 |
| Compatibility | PowerPoint |
| Animated | No |
| Language | English |
| License | Commercial |
| File size | — |
| Version | v1.0 |
| Last updated | February 2026 |
What's inside
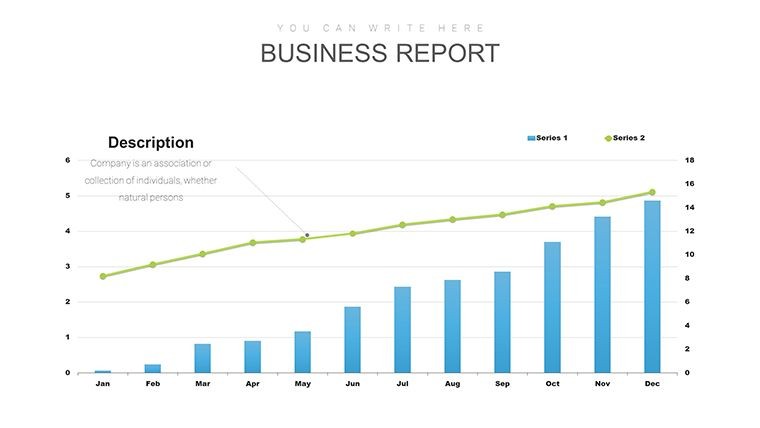
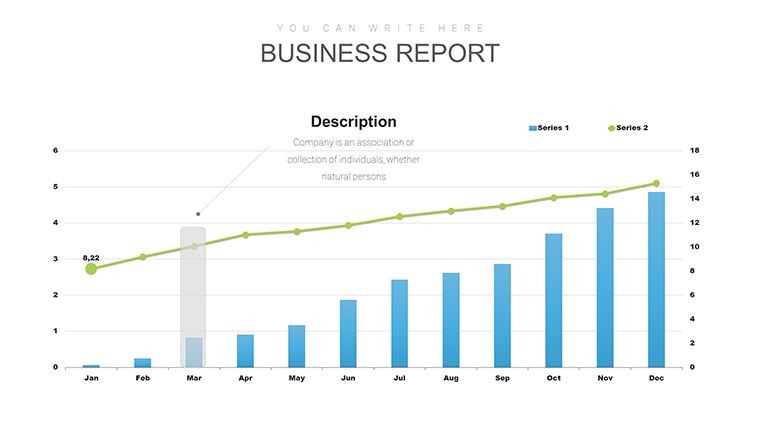
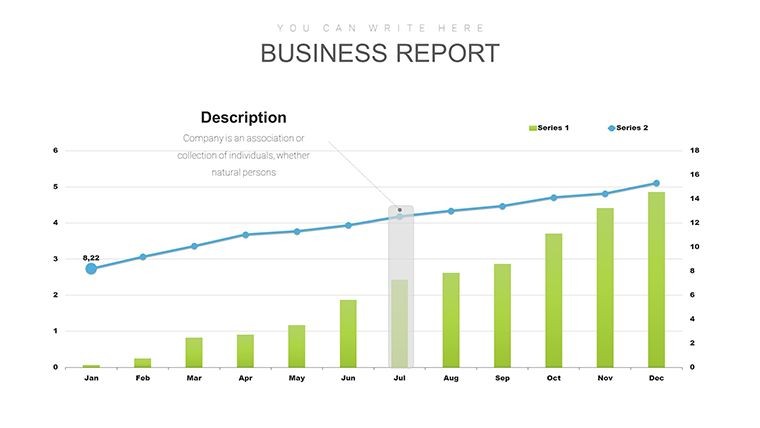
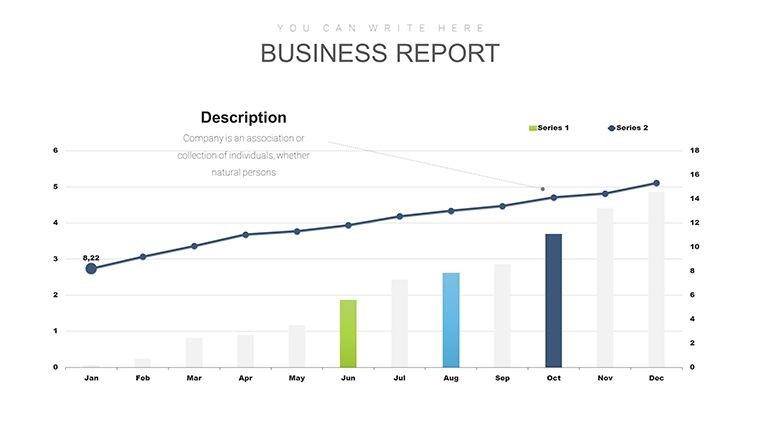
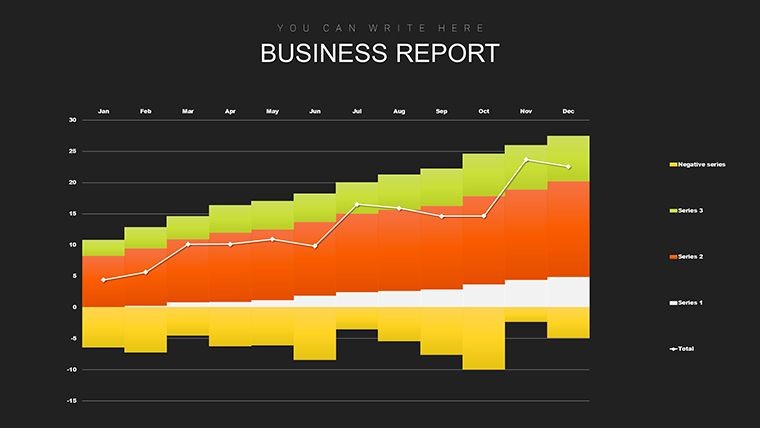
Download the Sales Funnel Keynote Charts Template with 47 fully editable slides including bars, lines, pies, funnels, pyramid stacks and forecast lines. Visualize revenue revolutions and pipeline data with dynamic imports. Instant .key download at $12.00 for professional sales presentations.
What's Included
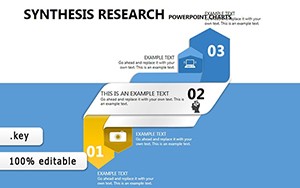
The Sales Funnel Keynote Charts Template includes 47 meticulously crafted editable slides in .key format. Structured around sales pipeline stages, the set features Baseline Bars (Slides 1-10), Infographic Funnels (Slides 11-30) and Forecast Frontiers (Slides 31-47). You also receive dynamic data import support and infographic overlays with icons, annotations and labels. Priced at $12.00 with product ID KC00015, the file is ready for immediate use in Keynote. All elements are vector-based and grouped for fast editing.
Slide Structure Details
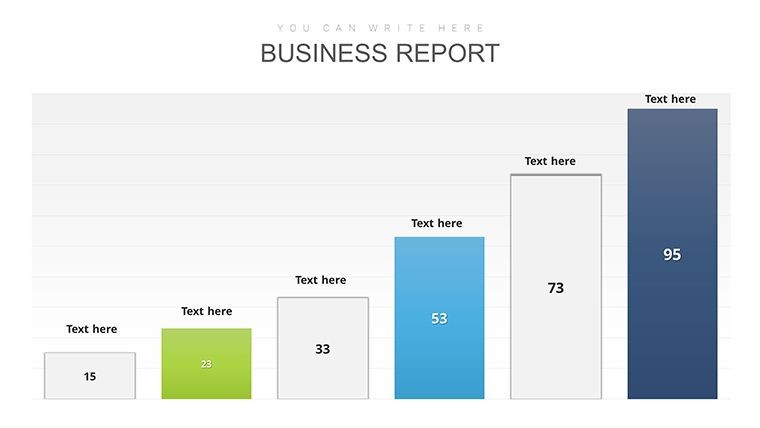
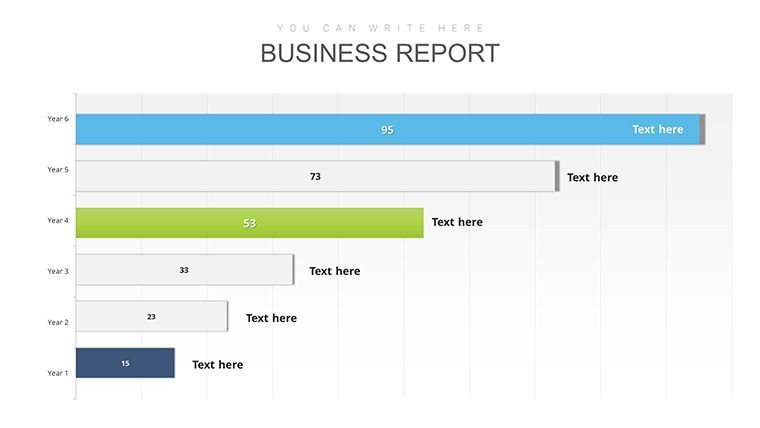
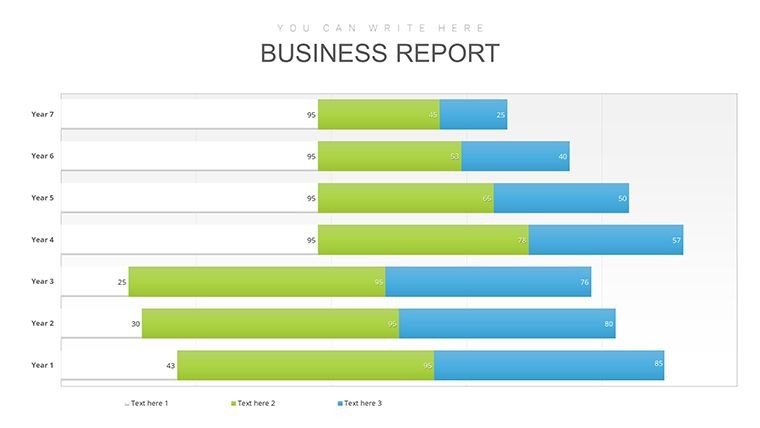
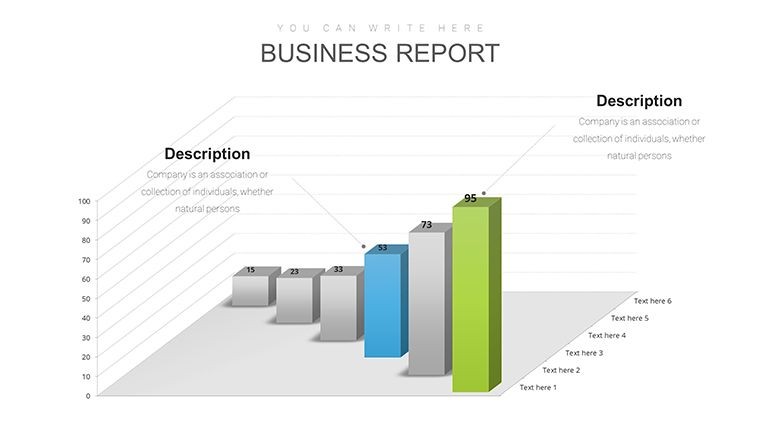
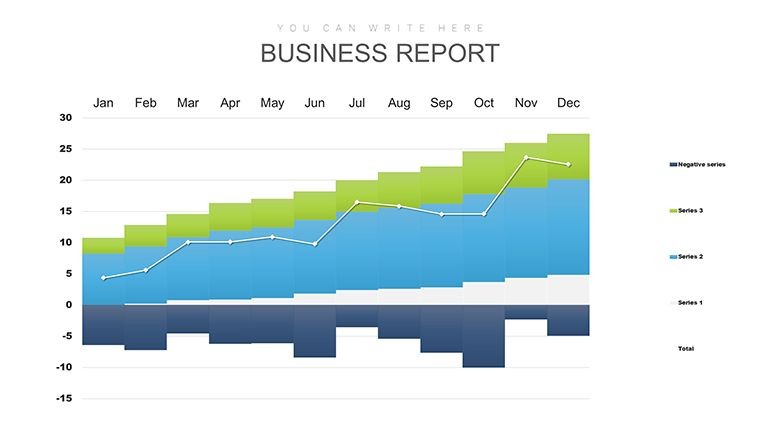
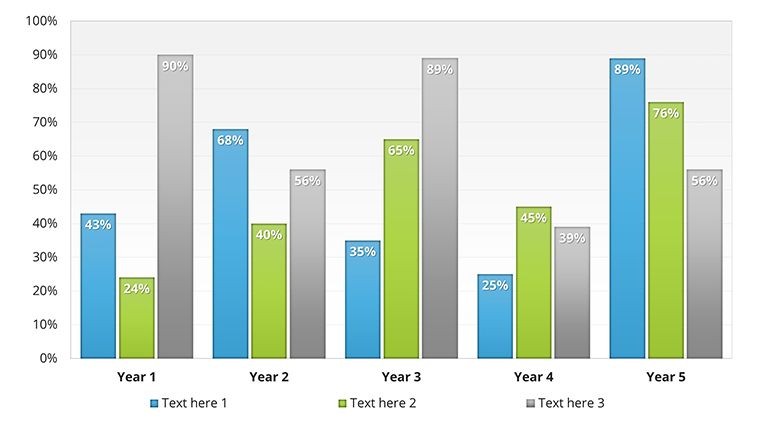
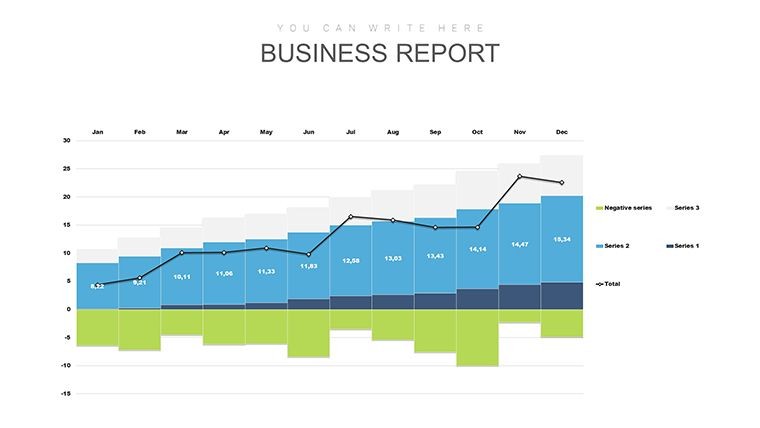
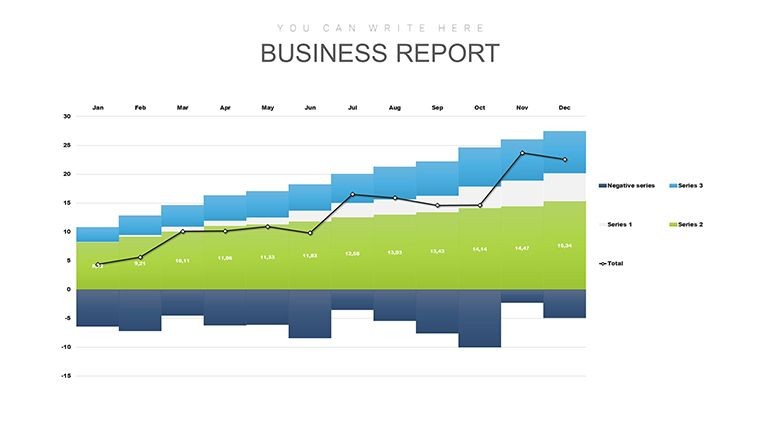
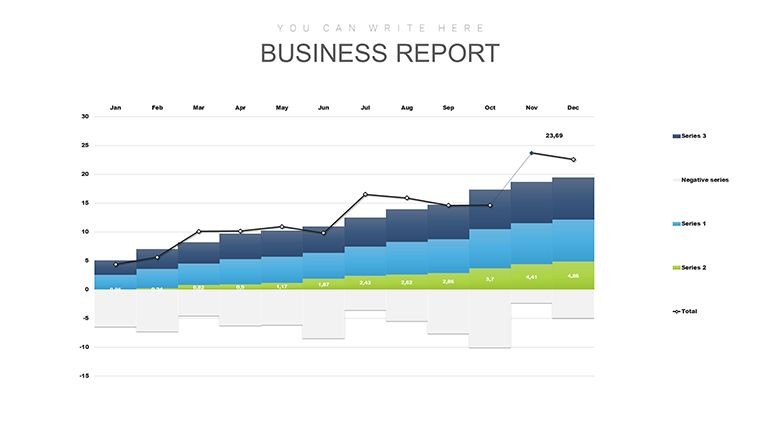
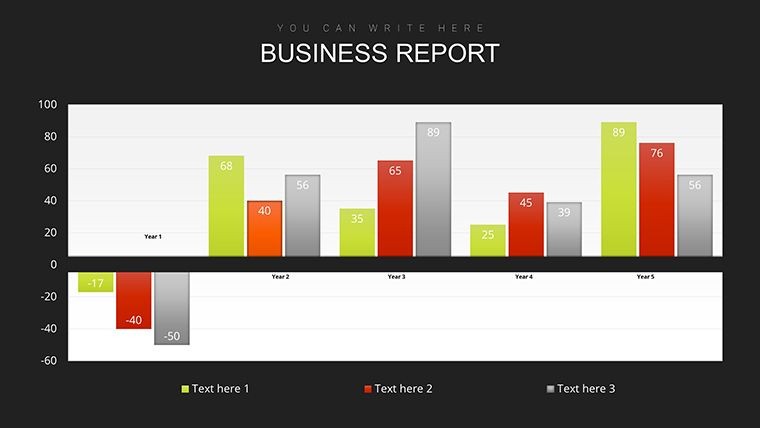
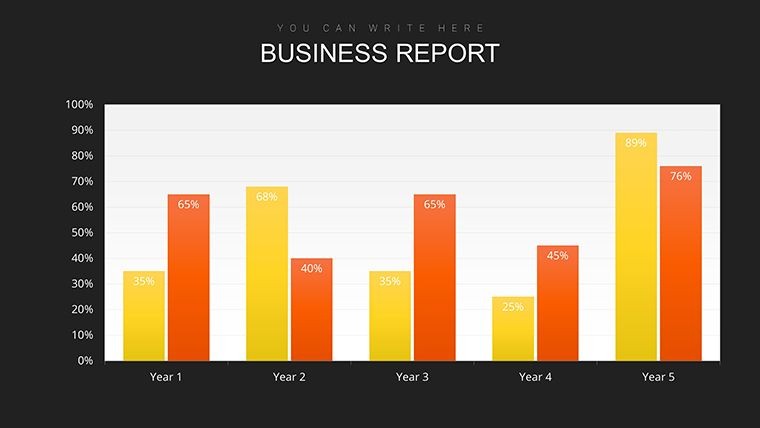
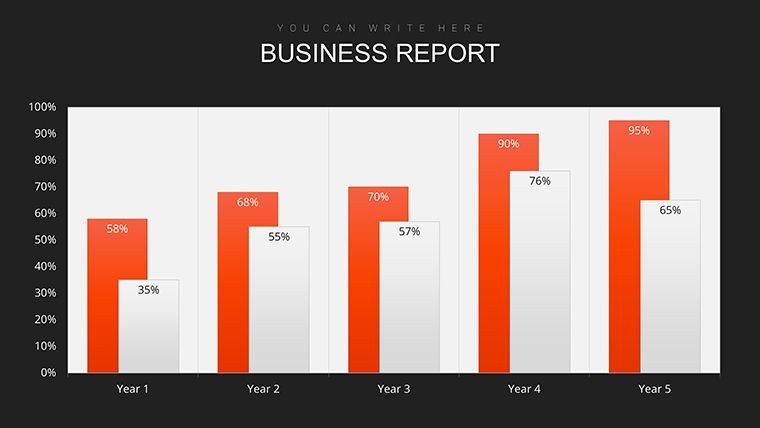
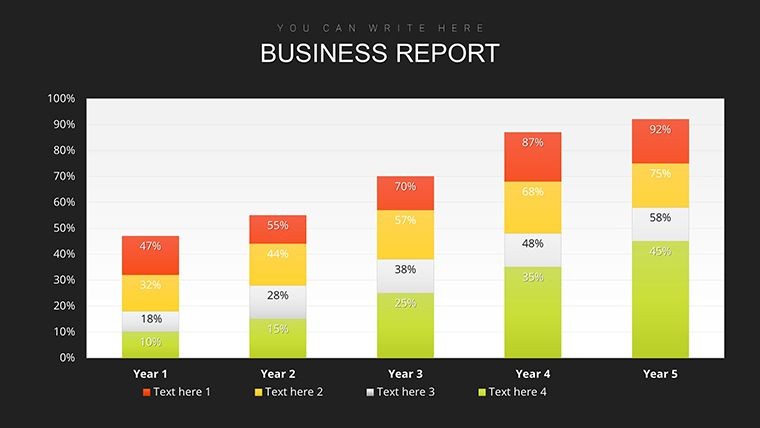
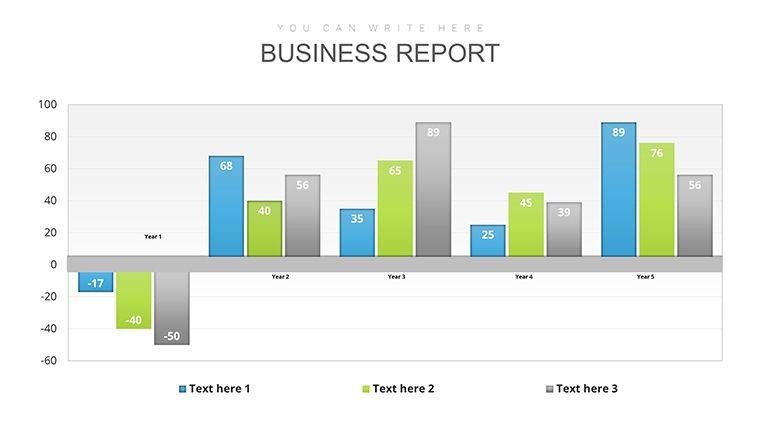
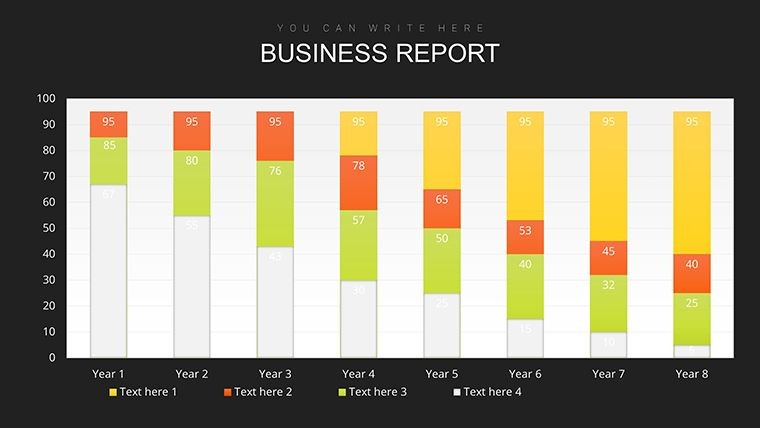
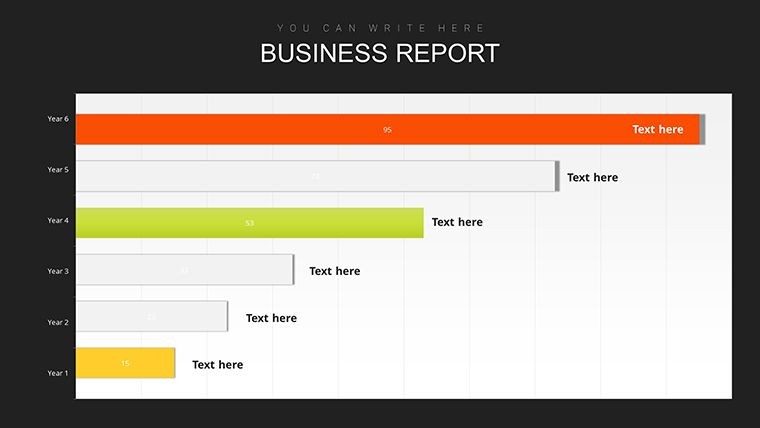
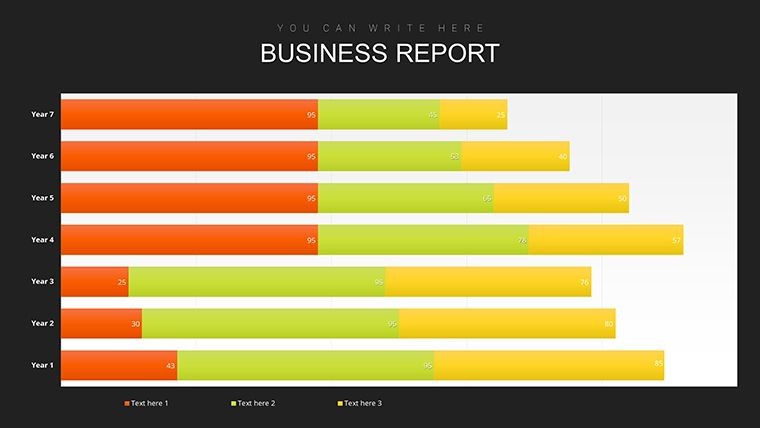
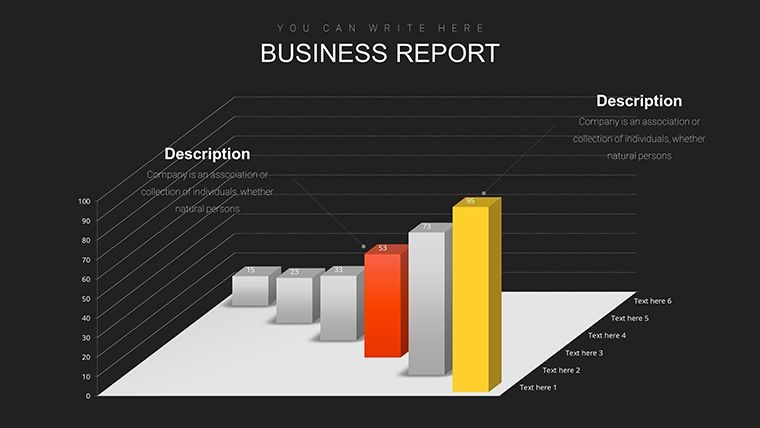
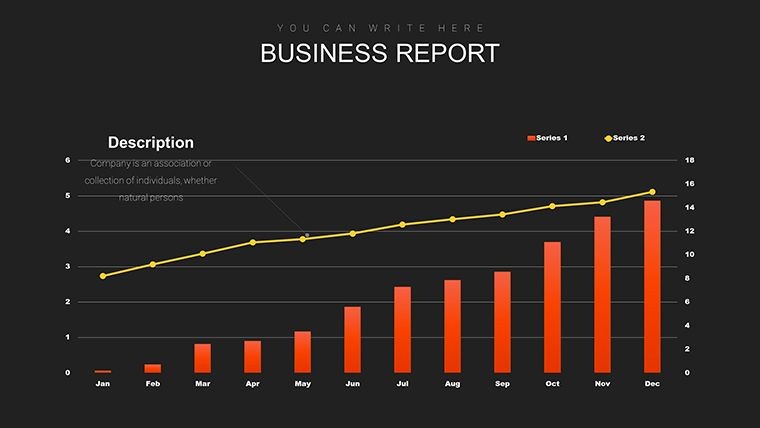
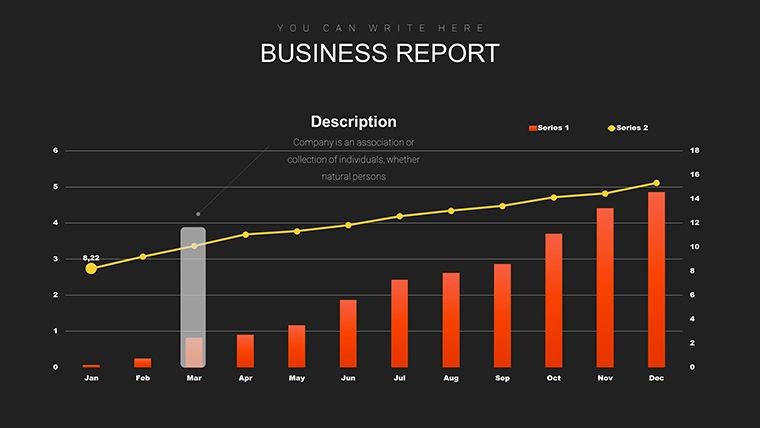
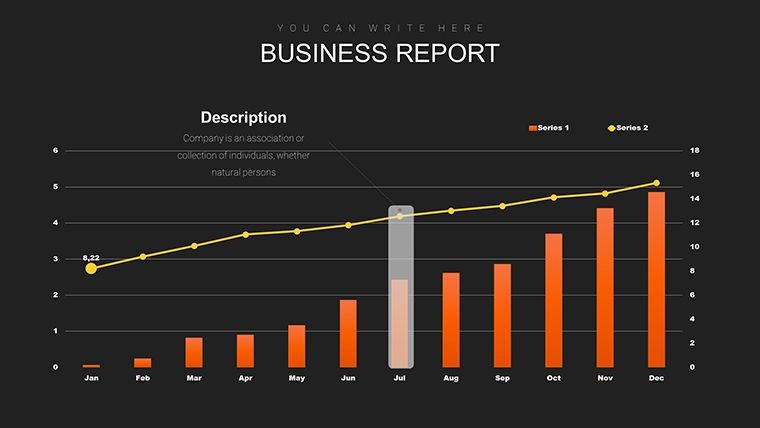
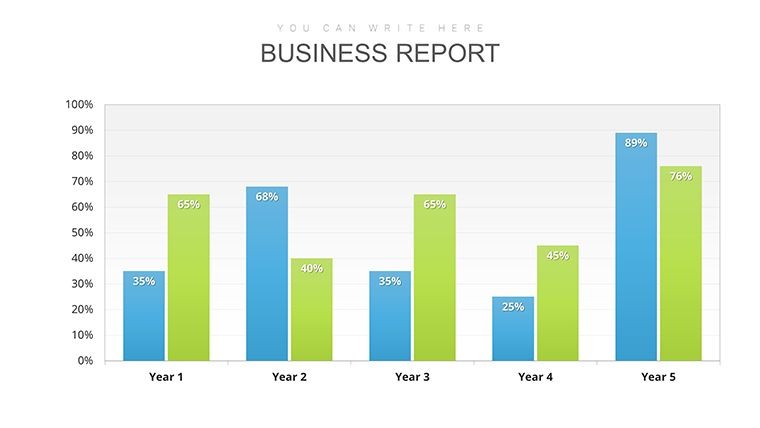
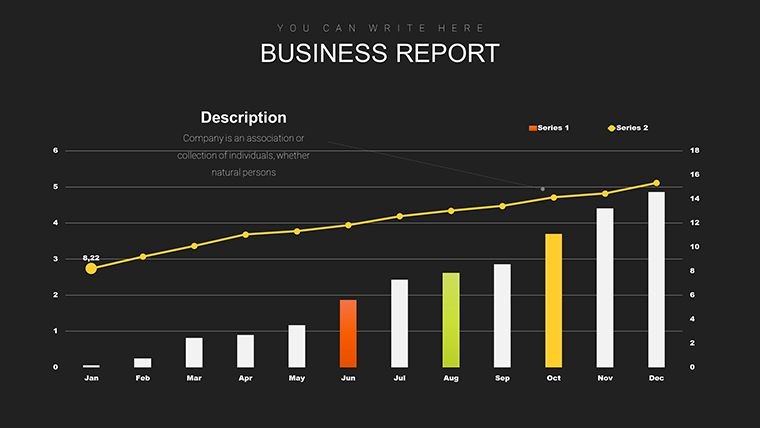
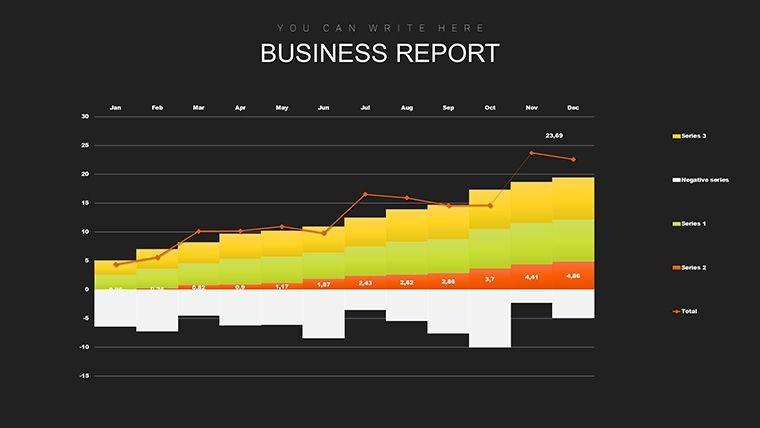
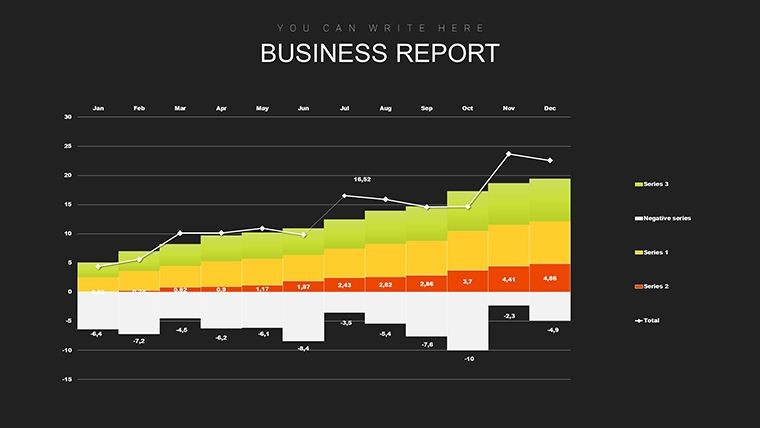
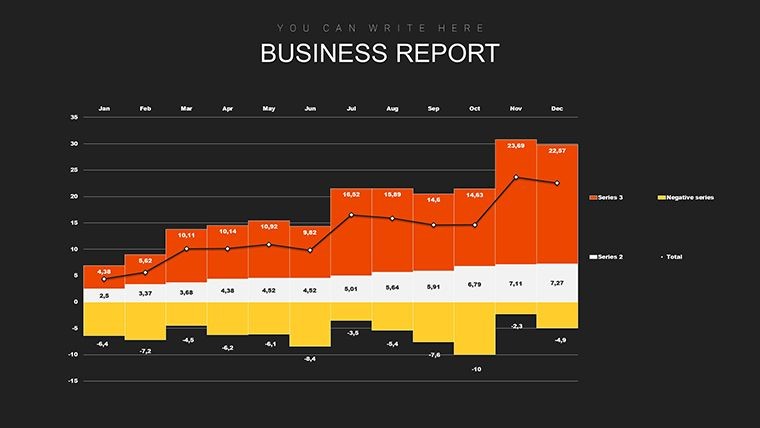
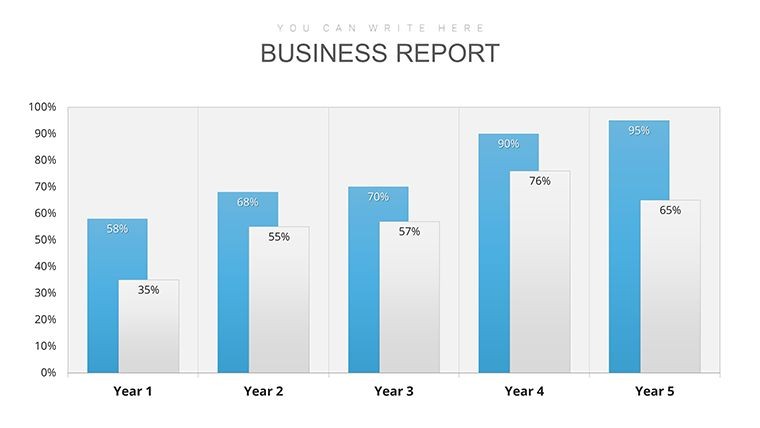
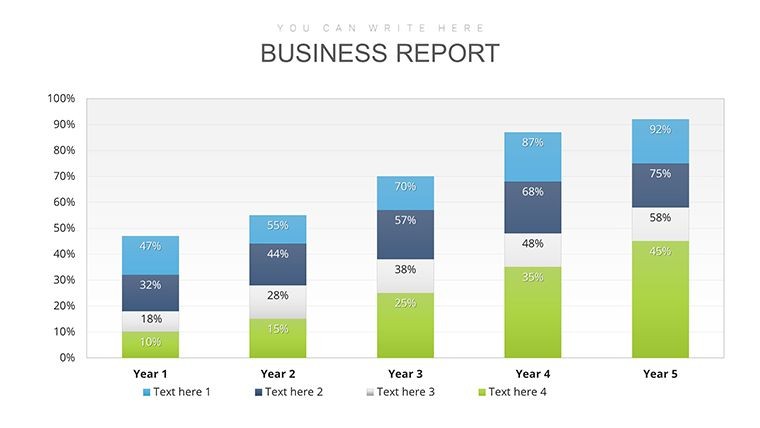
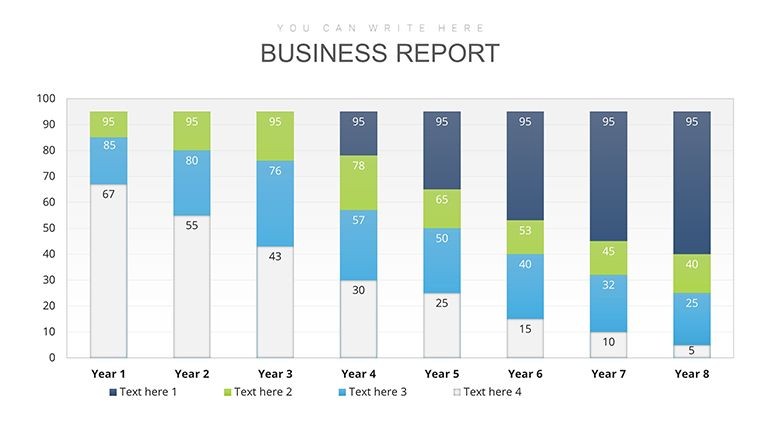
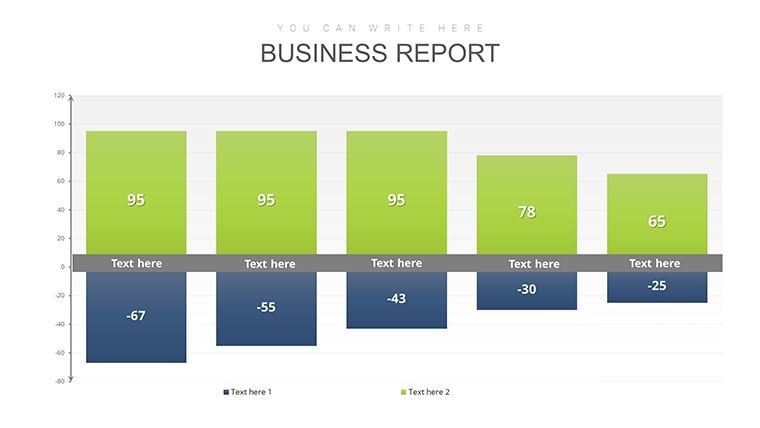
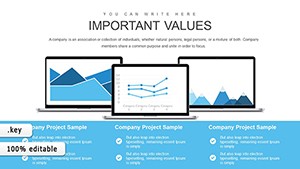
Slides 1-10 deliver core bar and line graphs for quarterly snapshots. Slides 11-30 focus on funnel flows for pipeline analysis while Slides 31-47 introduce advanced hybrids including pyramid stacks, scatter plots, stacked areas and forecast lines with confidence bands. This organization lets you build a complete revenue story from lead generation through close.
Key Features
Fully editable graphs support direct data replacement and automatic scaling. Infographic overlays allow independent adjustment of icons, labels and annotations separate from base charts. Dynamic data imports pull live numbers from Excel or Google Sheets for real-time updates. Branded transitions such as fade-ins and zooms add polish without extra effort. The modern layout style uses Keynote’s built-in chart engine for brand harmony across all 47 slides.
Chart Types Included
Available visuals include horizontal and vertical bars, lines, pies, funnels, stacked areas, scatter plots, pyramid stacks and forecast lines with confidence bands. Each type appears in multiple variations so you match the exact metric to the best visual format.
Professional Use Cases
A fintech startup founder used Slide 30’s infographic funnel to present transaction volume growth during an investor pitch, resulting in secured Series A funding within two weeks. In another scenario a sales manager at a consulting firm applied Slides 11-30 funnel flows to demonstrate phase efficiencies in a QBR, leading the board to approve additional headcount for the sales team. These examples show how the structured slide groups turn complex revenue data into clear narratives that drive decisions.
Workflow Example
Download the .key file, open in Keynote, import your CRM data via Excel link, replace placeholders on the relevant slide group, apply branded transitions and export as PDF. The entire deck is presentation-ready in under 30 minutes.
How to Customize
Select any slide and click chart series to update values or recolor for emphasis. Infographic overlays edit independently so you can add or remove annotations without affecting the base graph. Dynamic import settings keep data linked for automatic refreshes. You can duplicate slides from any group to expand sections or hide unused forecast lines. The vector shapes remain crisp at any size or when printed.
Design Decisions
Layout choices place funnels and forecast bands in dedicated sections to guide the audience through the sales journey logically. Confidence bands on forecast lines visually communicate uncertainty ranges, helping stakeholders understand risk without extra explanation.
Why Choose This Template
This 47-slide set differentiates from the related 56-slide general sales infographic template by providing a focused narrative structure around revenue revolutions and pipeline stages rather than sheer quantity. Specific chart types such as pyramid stacks and forecast lines with confidence bands appear here but not in simpler collections. Priced at $12.00 with dynamic imports and branded transitions, it delivers higher impact for sales-specific decks while remaining fully editable in Keynote.
Ready to graph your revenue growth? Download this template today.
Frequently Asked Questions
How do I use dynamic data imports in this Sales Funnel Keynote Charts Template?Link your Excel or Google Sheets file in Keynote using the chart data editor on any of the 47 slides. Updates to the source file automatically refresh bars, funnels and forecast lines. This feature works on Slides 1-10 for baseline graphs and Slides 31-47 for confidence-band forecasts. You maintain control over which series pull live data versus static values. The process eliminates manual re-entry when quarterly numbers change.
Which slide groups should I use for a typical pipeline presentation?Start with Slides 1-10 baseline bars to show historical revenue. Move to Slides 11-30 infographic funnels for current pipeline health and conversion rates. Finish with Slides 31-47 forecast lines and pyramid stacks to project future growth. This flow matches the revenue revolution narrative and keeps the audience engaged through the full 47-slide set.
Are the charts fully editable and do they support animations?Every graph on the 47 slides allows complete editing of data, colors, labels and overlays. Built-in transitions such as fade-ins and zooms apply to individual elements or whole slides. You can adjust animation timing in the Keynote inspector. Vector construction ensures professional results even after heavy customization or export to PDF.
Is this template licensed for commercial client work?Yes, the one-time purchase at $12.00 includes full commercial rights for presentations delivered to clients or used internally. You may modify and deliver the customized 47-slide deck as part of paid consulting or sales services. The original .key file itself cannot be resold or shared as a template.
How does this differ from the related 56-slide sales infographic set?This template organizes its 47 slides around specific revenue and funnel stages with advanced charts like pyramid stacks and confidence-band forecasts. The related 56-slide version offers more general layouts without the dedicated pipeline narrative or dynamic import emphasis. Choose this one when your focus is structured sales growth storytelling.
What file format and compatibility does the template have?The download is a single native .key file compatible with current Keynote versions on Mac and iPad. Charts export cleanly to PDF or PowerPoint while retaining most animations. No additional software or fonts are required beyond standard Keynote installation.
Good for
- Project roadmaps and sprint plans
- Product launch timelines
- Quarterly or annual review decks
- Company history and milestone summaries
Licence
reviews
The sunburst chart for hierarchical data.
The rings show nested categories.
Used this for a file size breakdown.
Better than a pie for multiple levels.
FAQ
Will it work in Google Slides?
Are fonts embedded?
Can I use this for client work?
What's the refund policy?
Do you update the template after purchase?
Similar templates
See all Keynote Charts →
All 47 slides