Pyramid Charts Keynote Template - 57 Editable Slides | Instant Download


Envision turning complex organizational hierarchies or strategic plans into clear, compelling visuals. Our Pyramid Classic Keynote Charts template delivers exactly that with 57 editable slides designed for professionals who need to communicate depth without overwhelming details.
Benefits of Using This Template
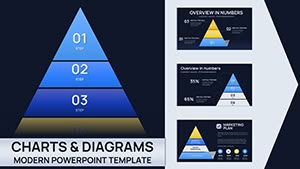
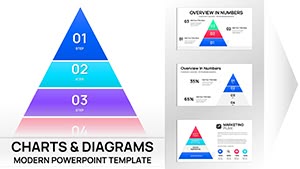
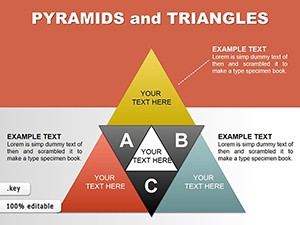
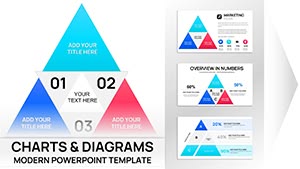
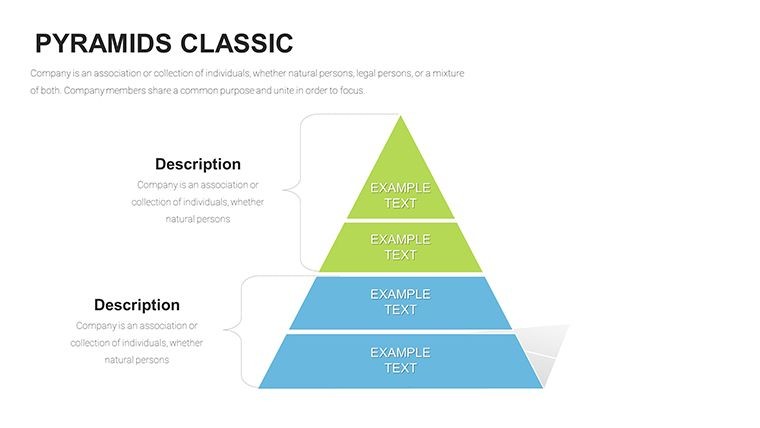
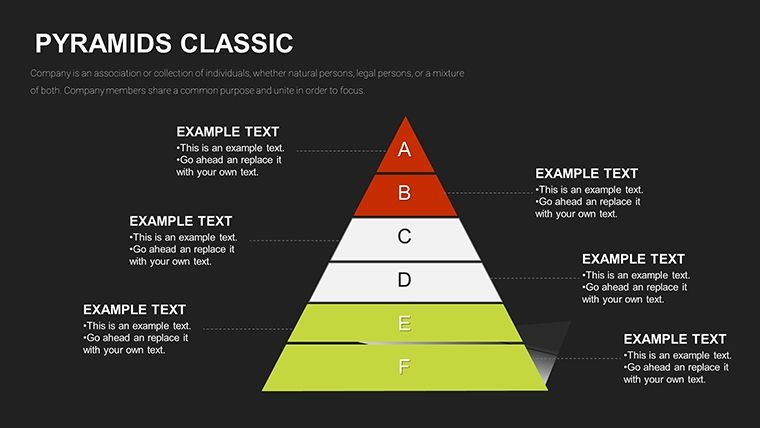
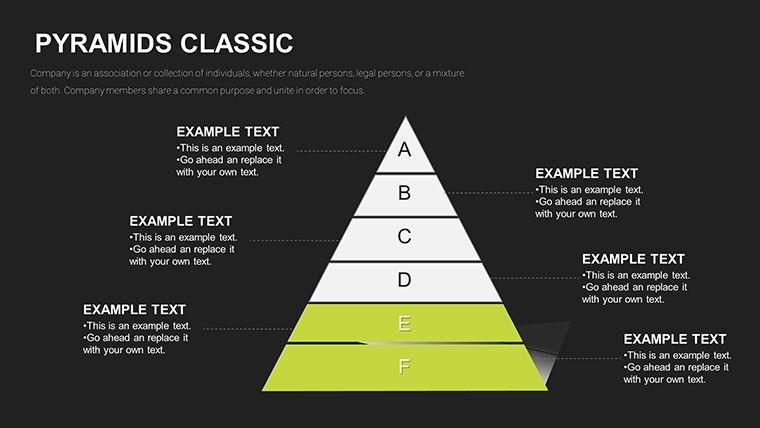
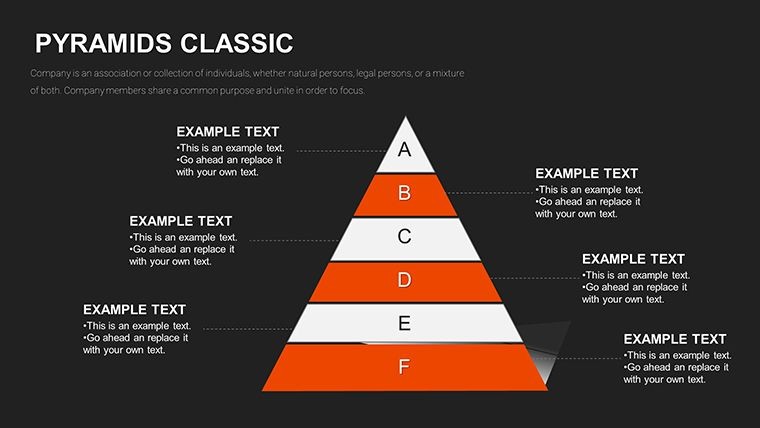
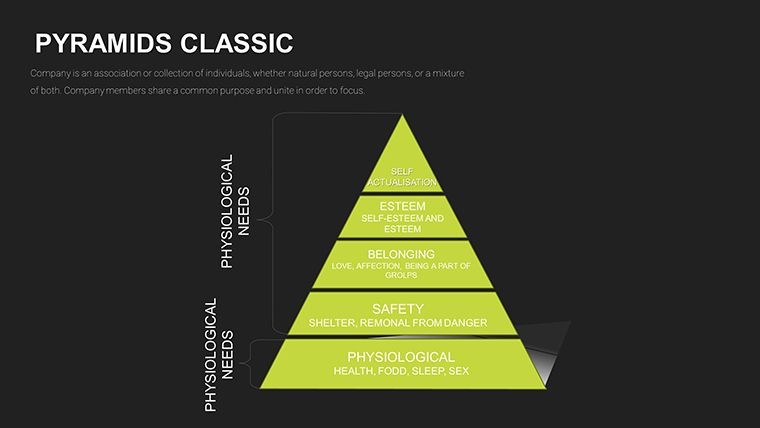
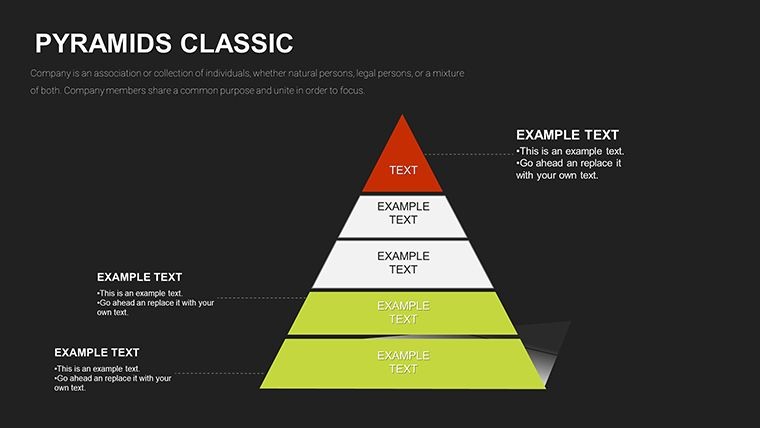
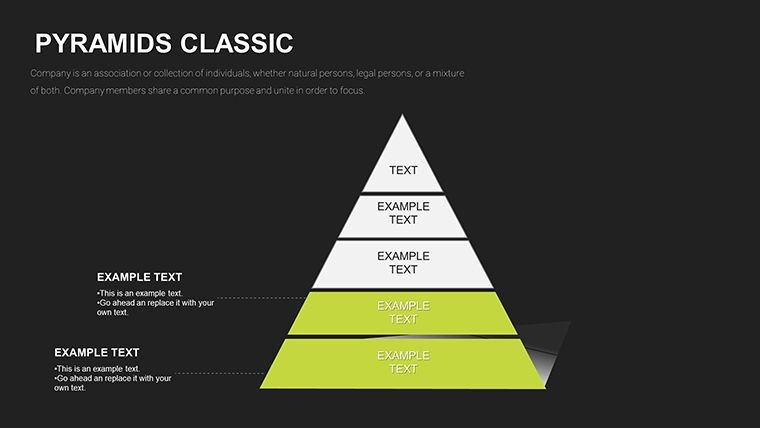
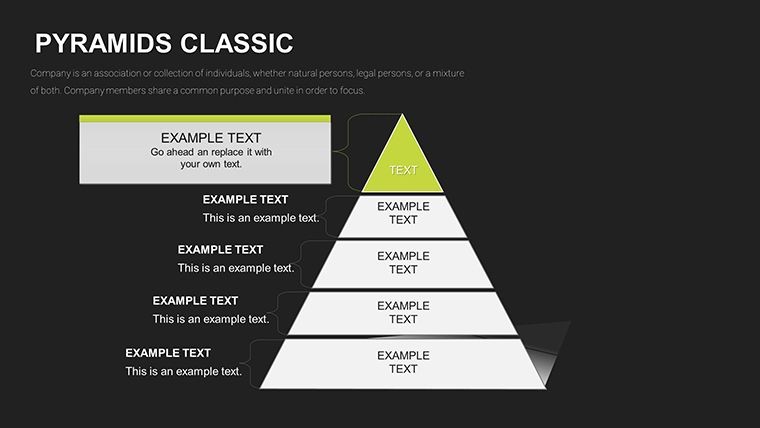
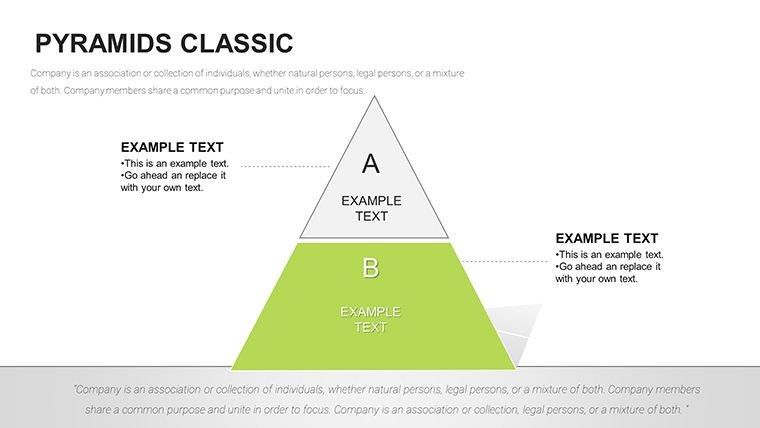
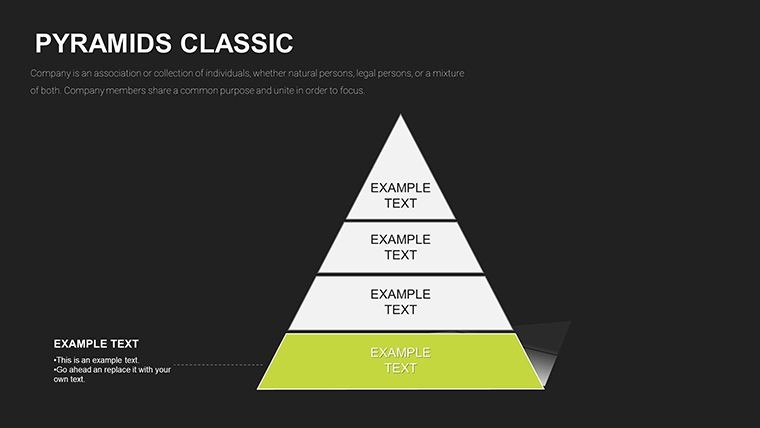
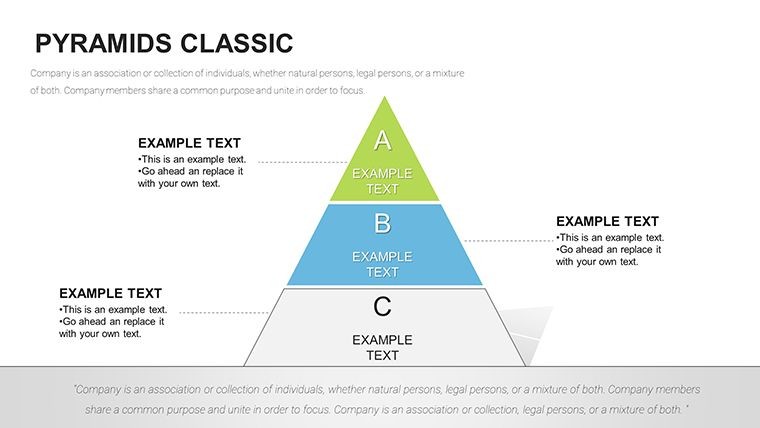
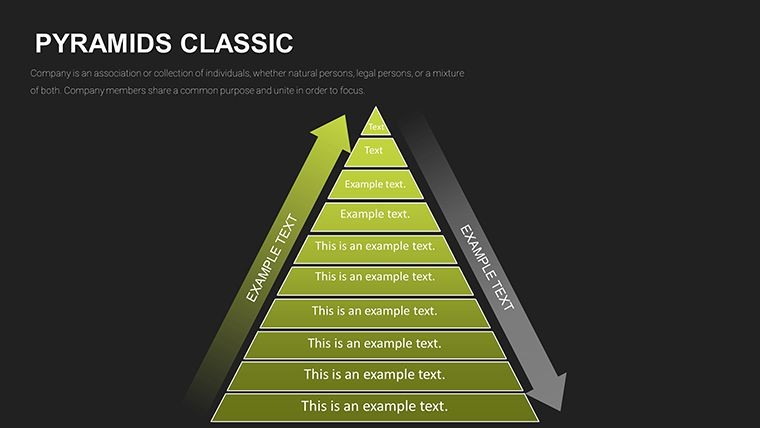
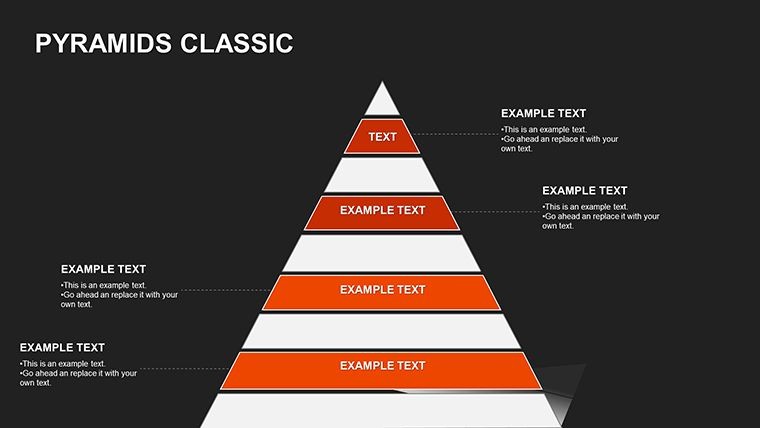
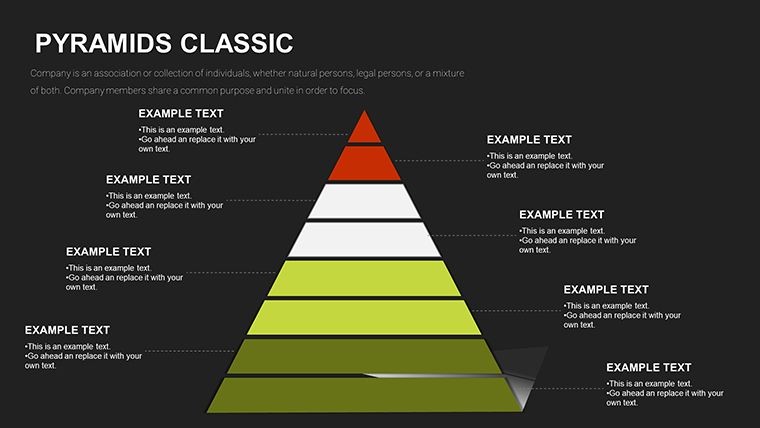
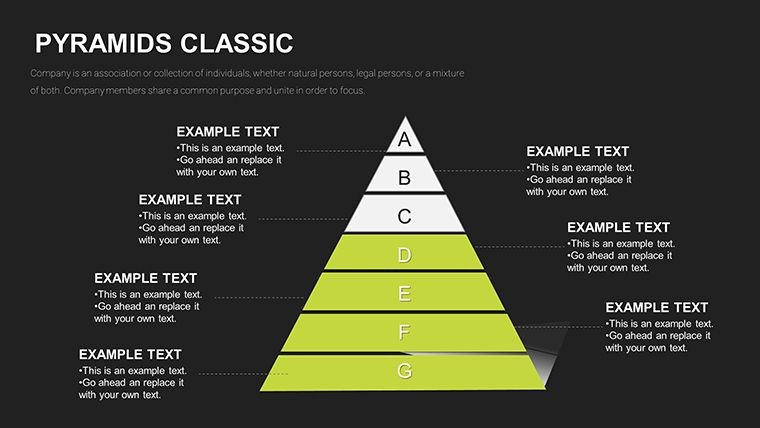
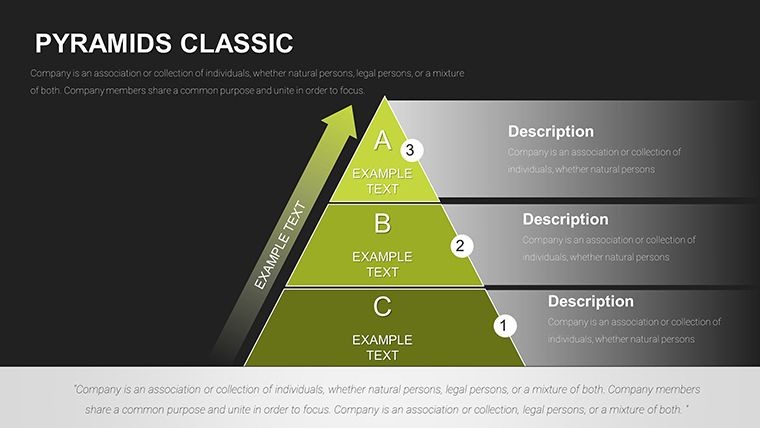
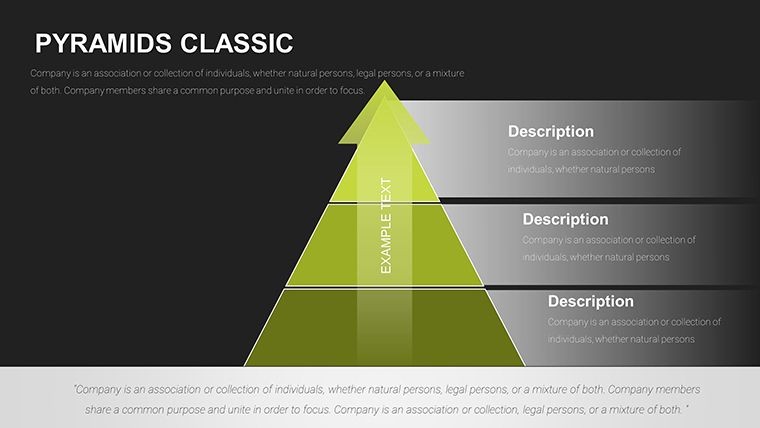
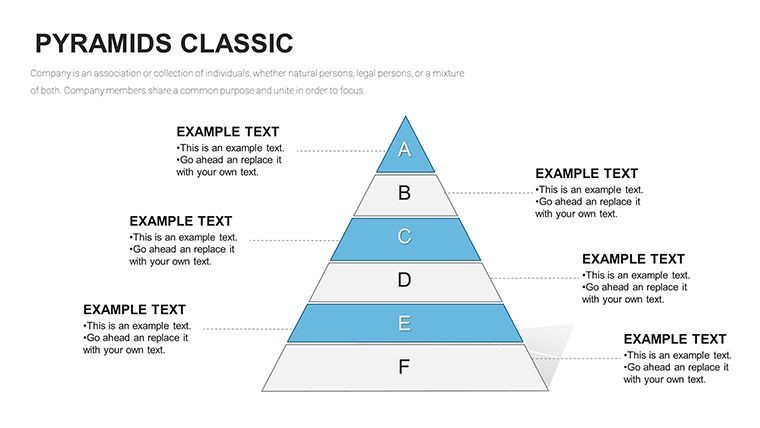
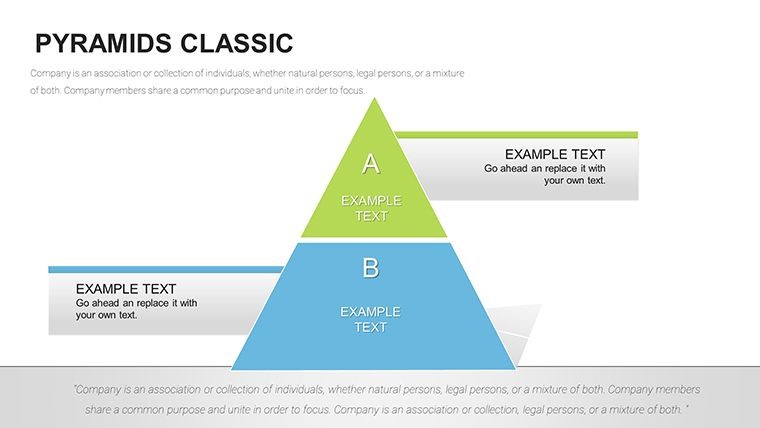
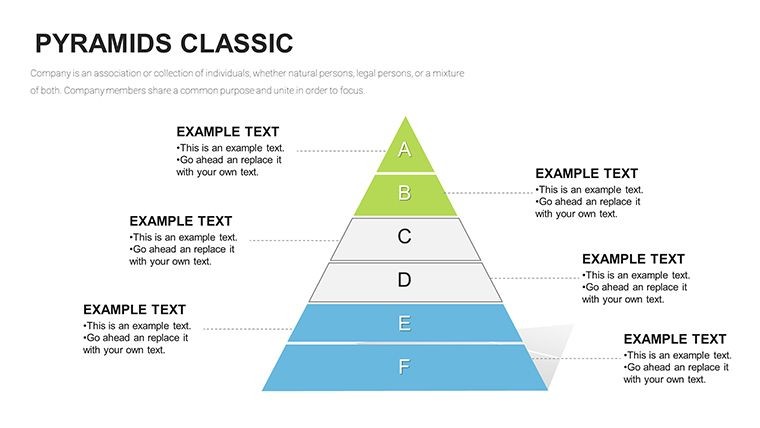
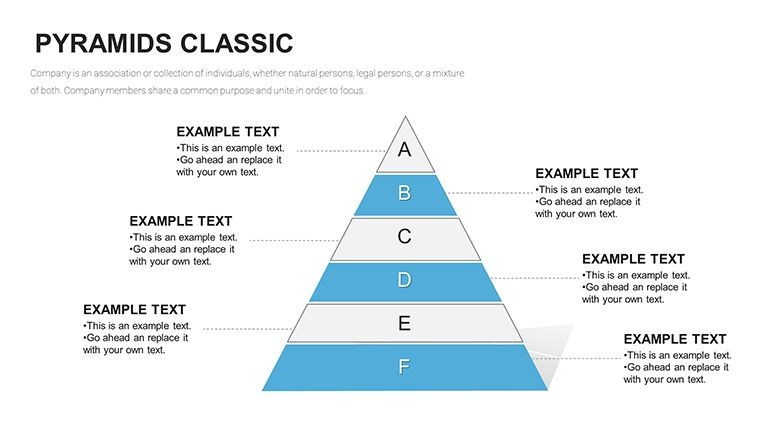
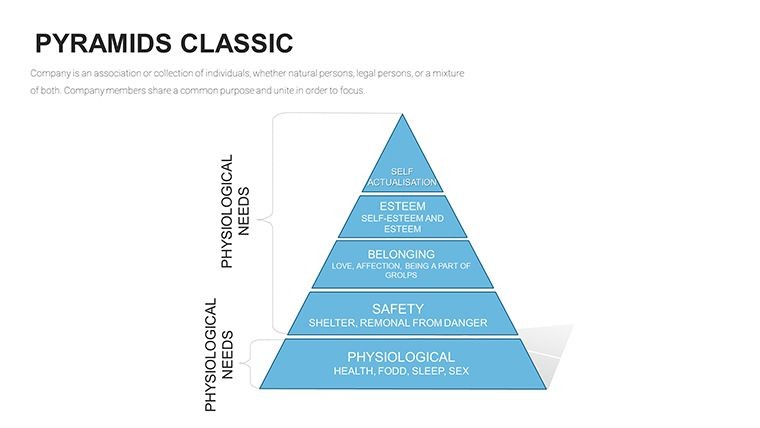
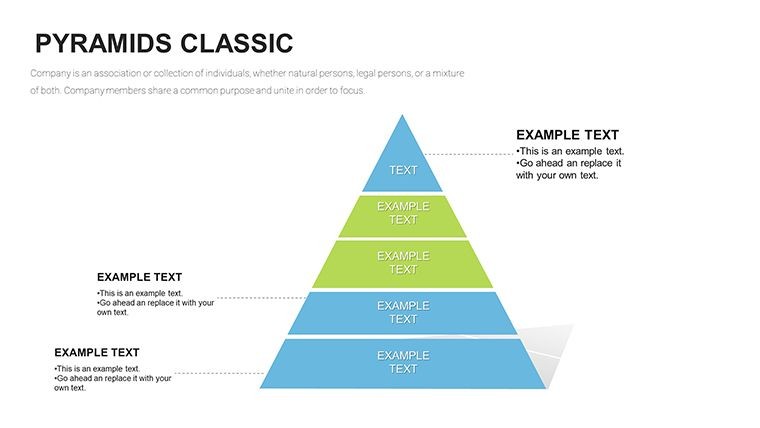
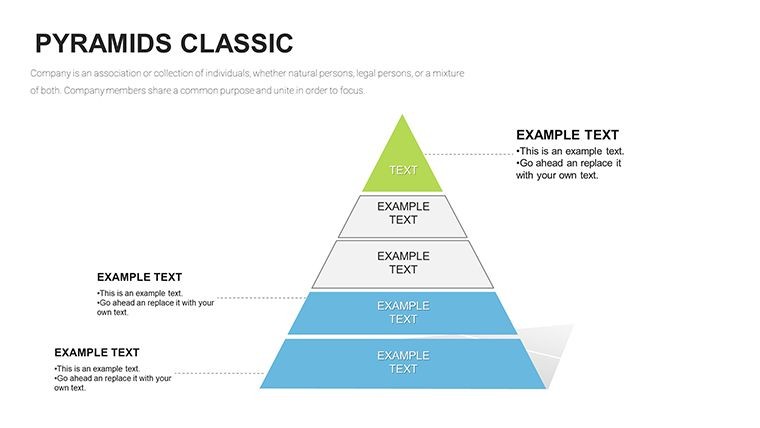
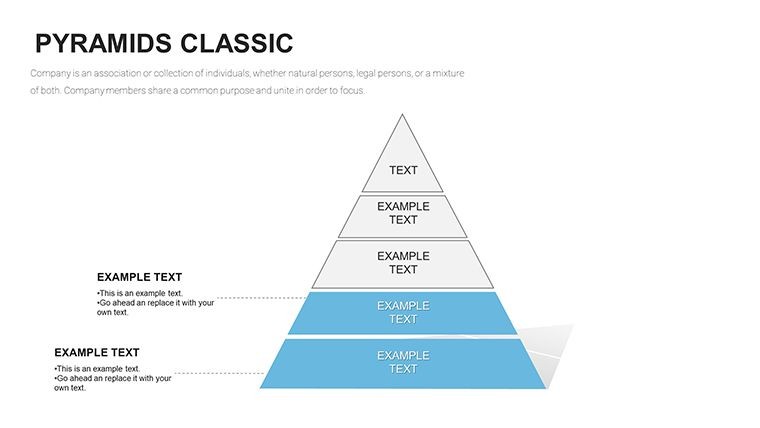
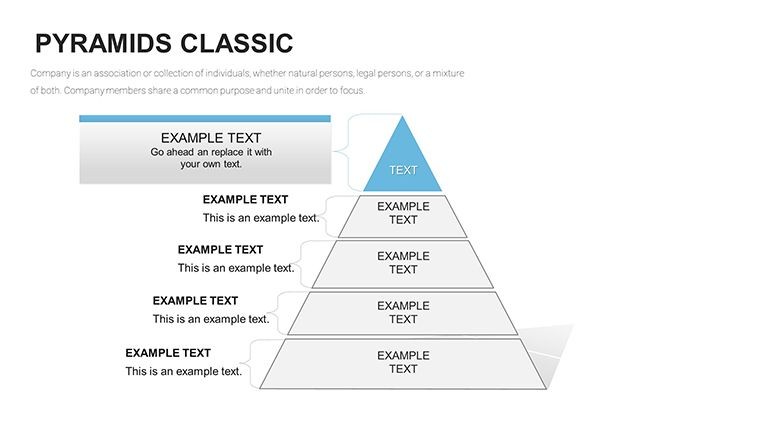
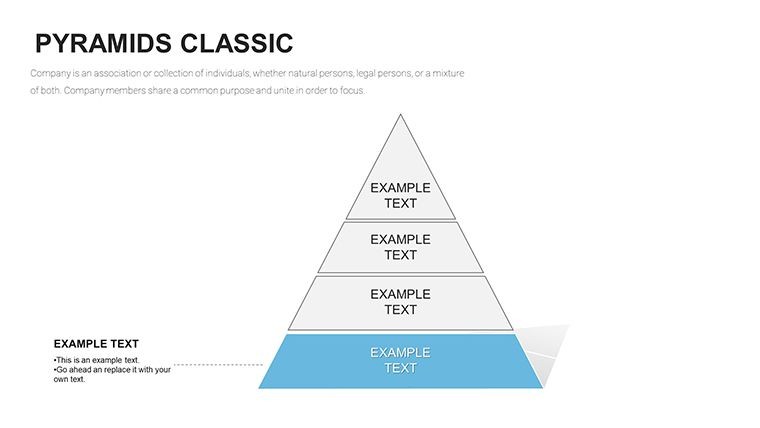
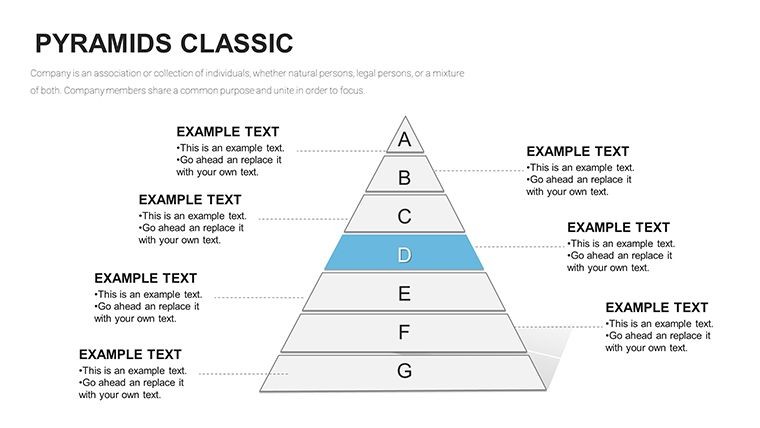
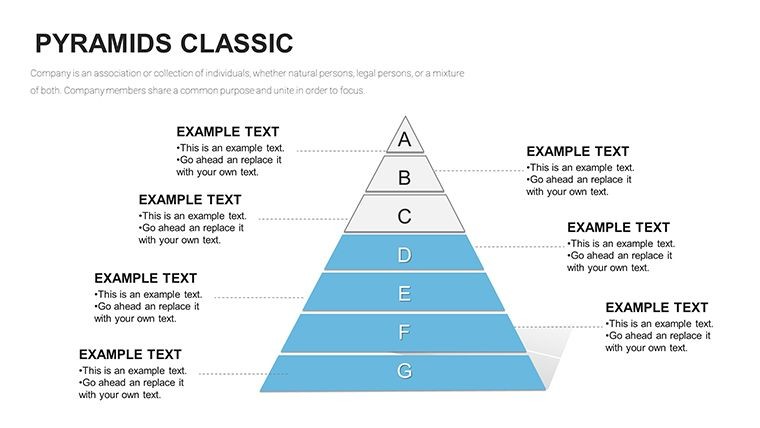
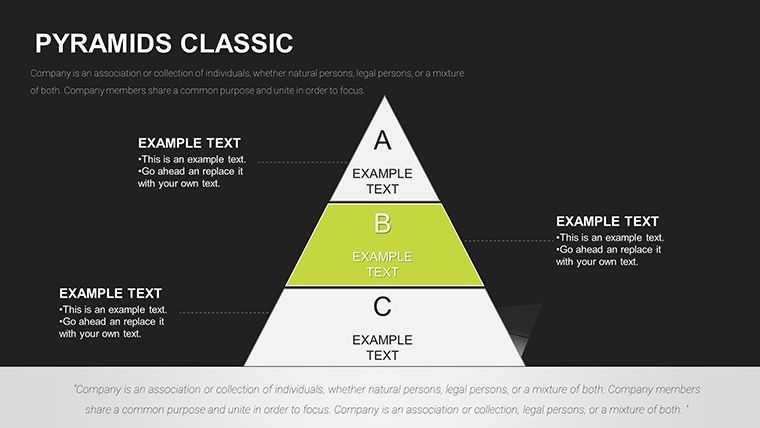
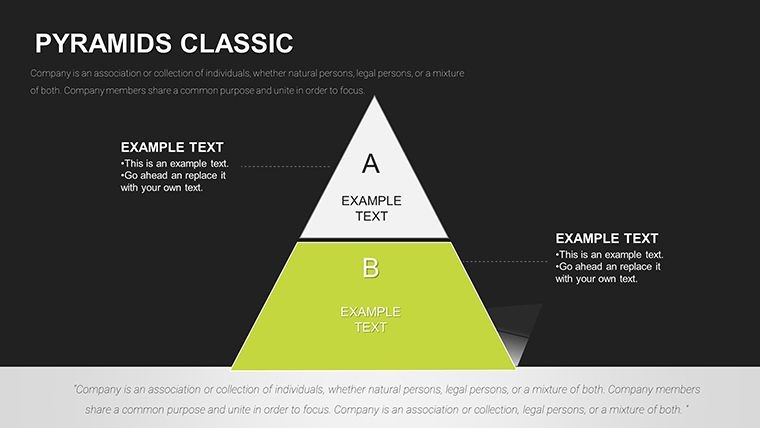
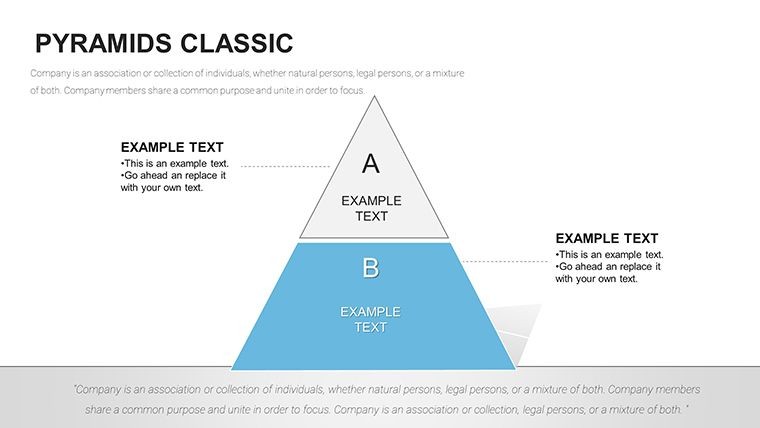
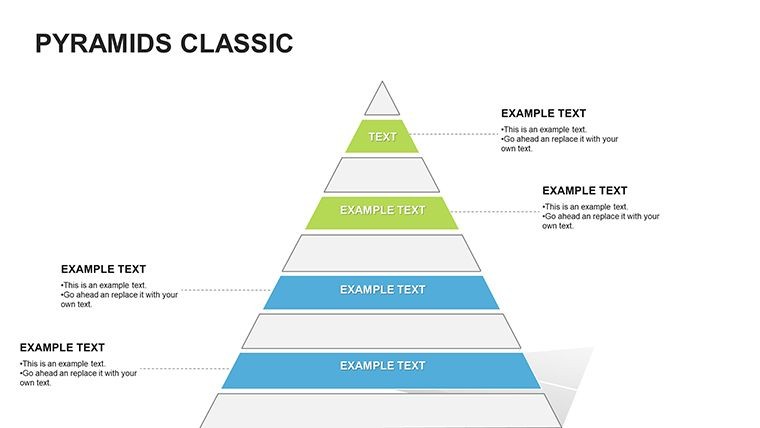
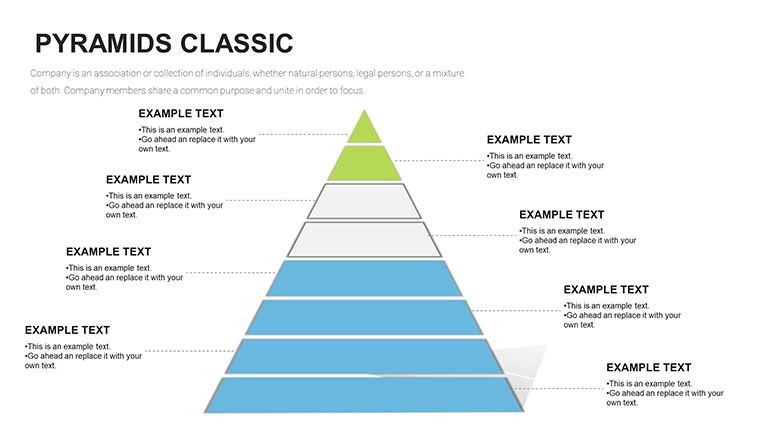
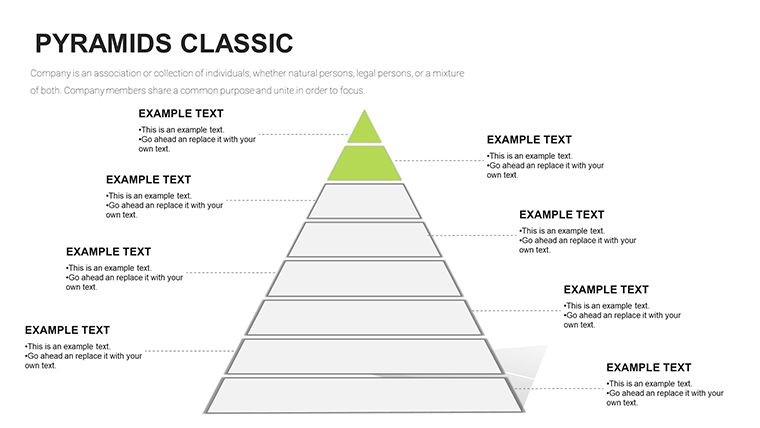
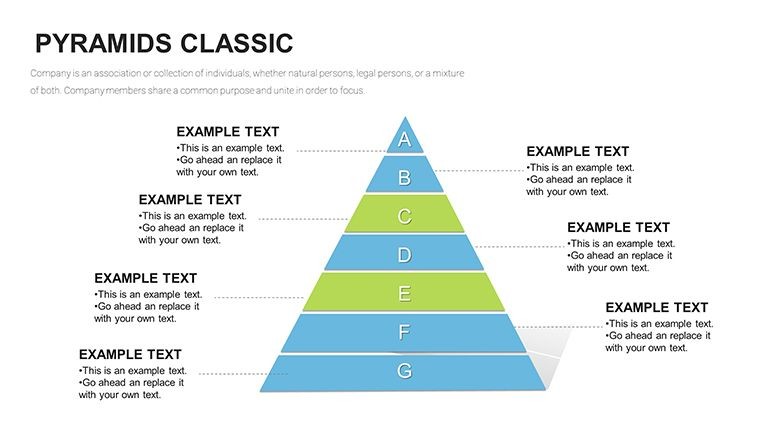
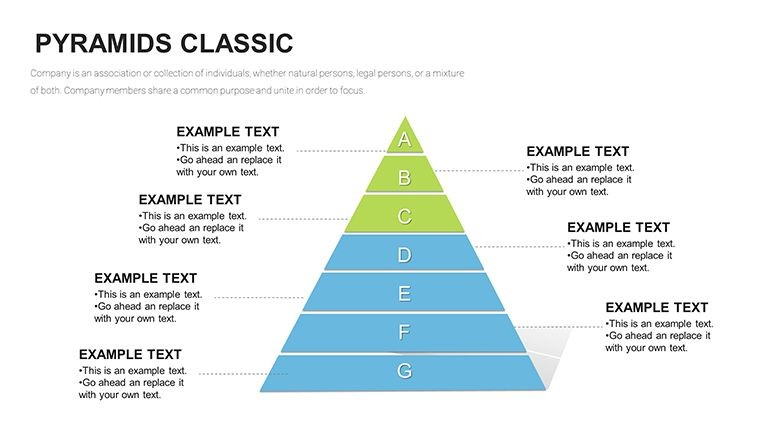
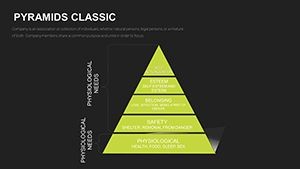
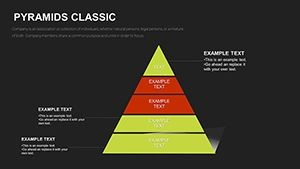
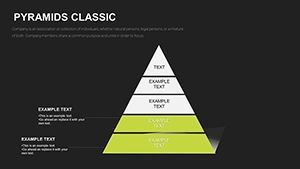
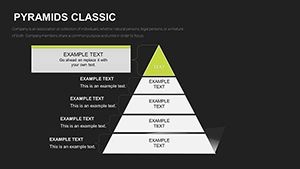
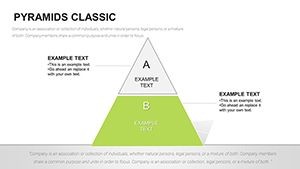
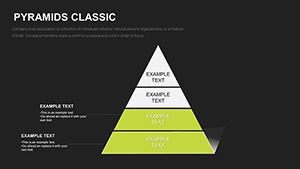
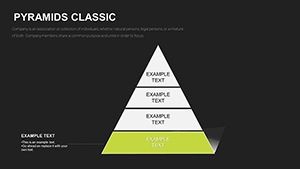
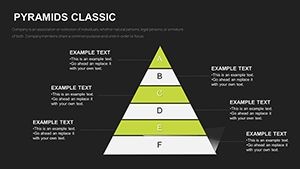
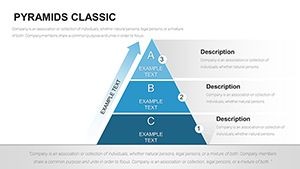
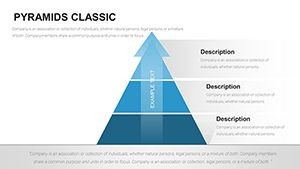
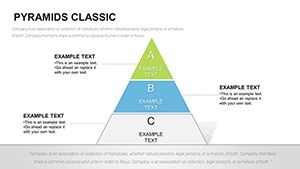
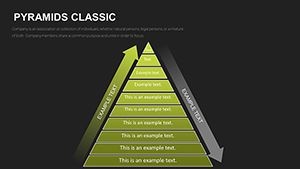
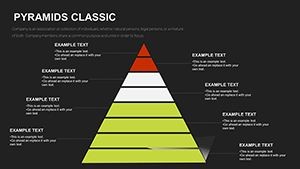
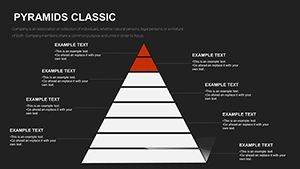
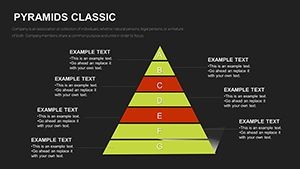
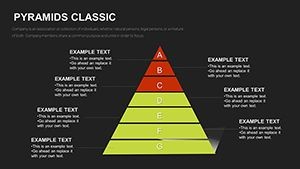
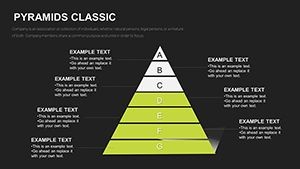
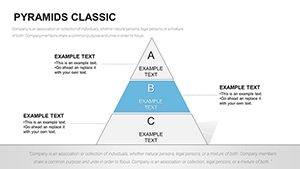
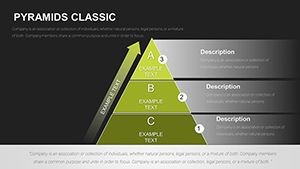
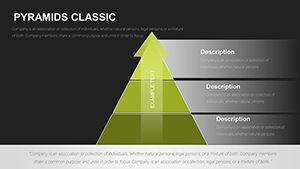
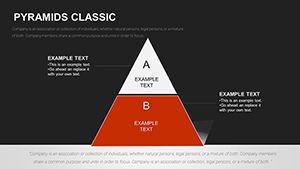
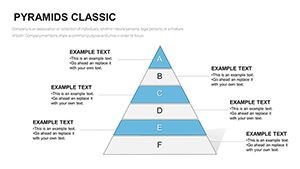
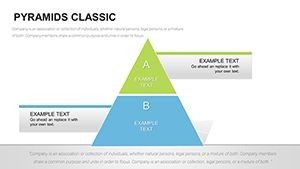
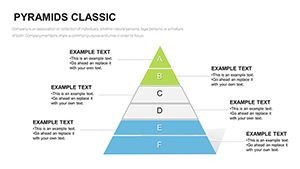
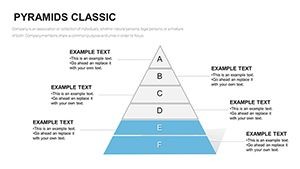
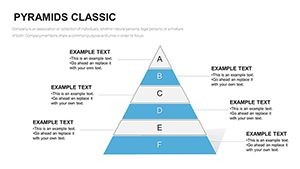
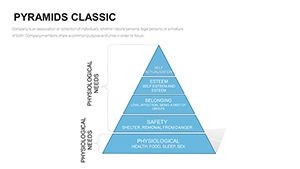
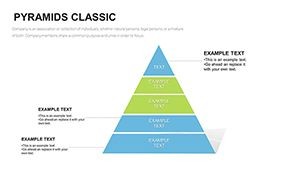
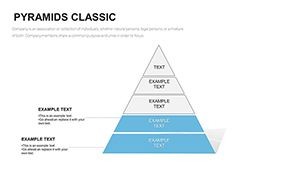
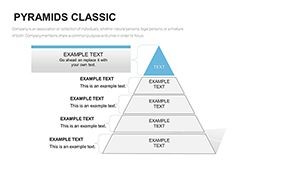
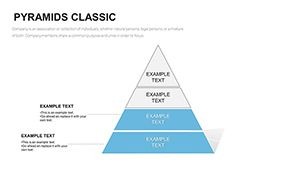
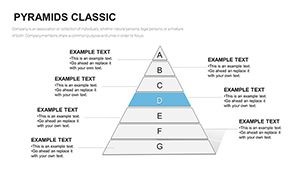
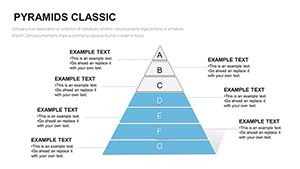
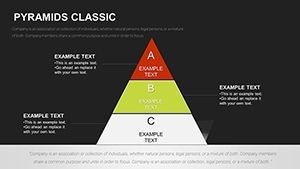
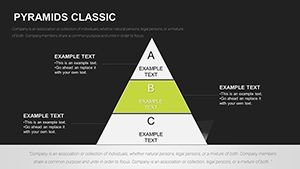
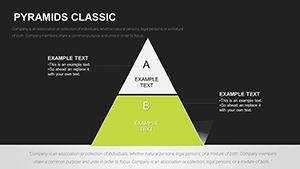
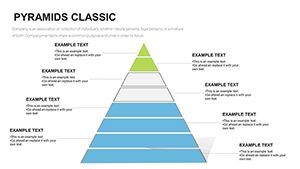
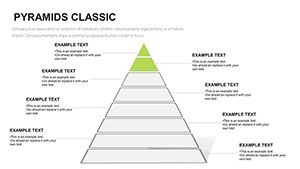
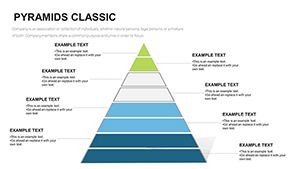
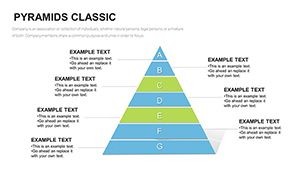
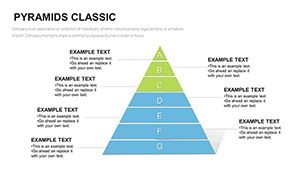
These pyramid charts excel at representing multi-level data, strategic frameworks, and hierarchical information in an intuitive format. The layered structure naturally draws attention to the most important elements at the top while providing context with the broader base. This makes them particularly effective for presentations involving business models, priority setting, or systems thinking.
With a variety of pyramid styles available, you can choose the best visualization to match your specific message and data set. The professional design ensures your presentations look sophisticated and well-prepared.
Users in consulting, corporate strategy, marketing, and education will appreciate how these visuals simplify communication of sophisticated concepts.
Key Features
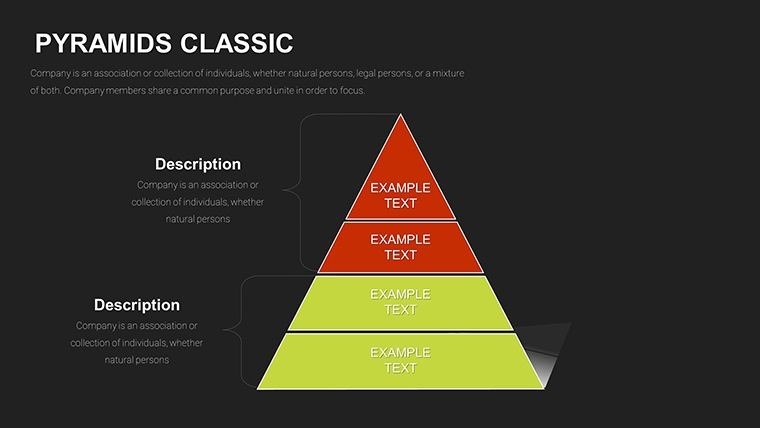
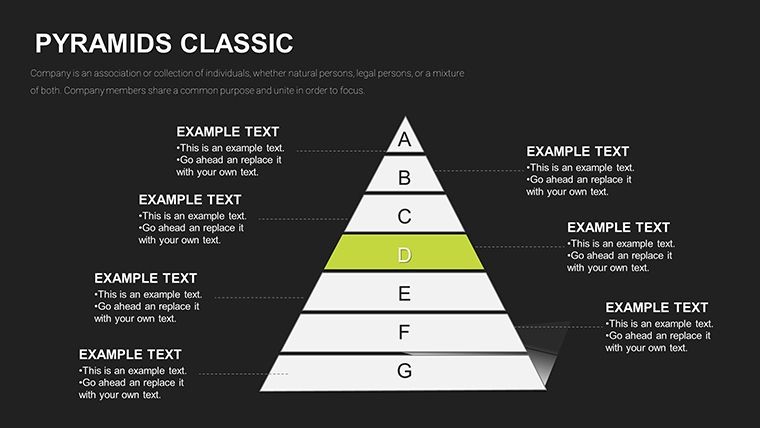
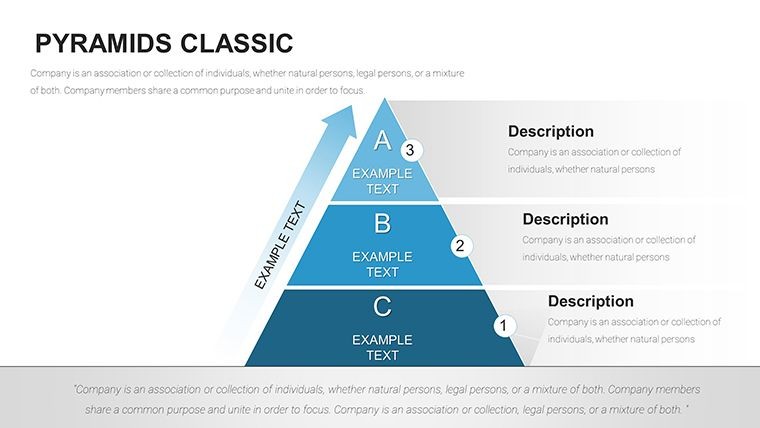
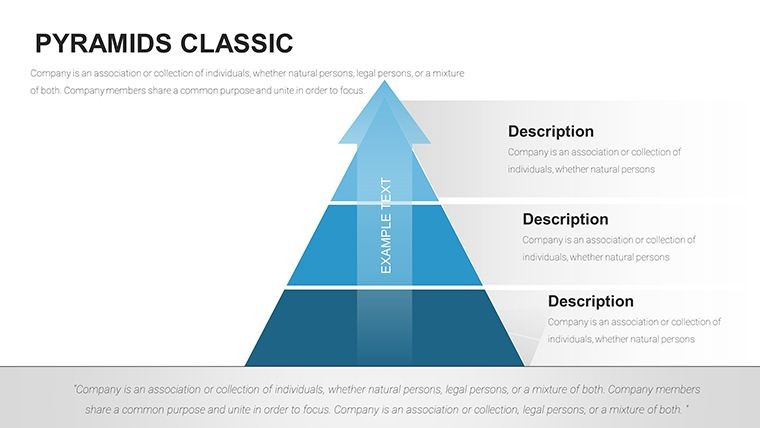
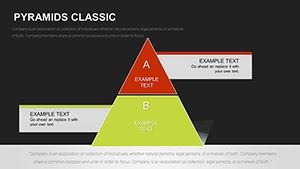
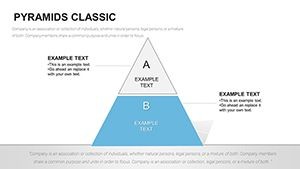
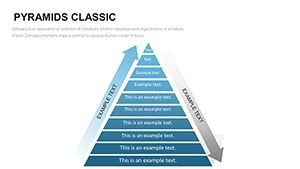
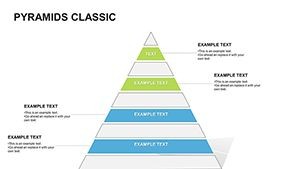
This template features 57 editable slides with diverse pyramid types including inverted, segmented, or stepped pyramids for varied data representation. It includes easy-to-edit placeholders for numbers, texts, and percentages, along with built-in icon libraries for business, education, and strategy themes.
High-contrast options and accessibility considerations are built-in to make your presentations inclusive. All elements are vector graphics for perfect scalability and editing flexibility.
How to Use
Download instantly and open in Keynote. Replace the sample data with your own content using simple click-and-edit. Customize the colors and icons to align with your brand using Keynote's native tools.
The templates are structured to allow quick assembly of complete chart sections or individual slides. Experiment with different pyramid variations to find the perfect fit for your narrative.
No advanced design skills required - these are made for busy professionals who need results fast.
Ideal Applications
Strategic Business Presentations
Illustrate corporate strategies, capability models, or value chains using the multi-style pyramid options available.
Consulting Deliverables
Present diagnostic findings, solution roadmaps, or maturity assessments with clarity and visual interest.
Educational Content
Teach frameworks, theories, or processes that benefit from hierarchical visualization.
Transform your data into compelling stories. Add this powerful Keynote template to your toolkit now.
Frequently Asked Questions
Is the Pyramid Charts Keynote Template fully editable?
Yes, all charts, text, colors, icons, and layouts are fully editable.
How many slides are included?
This template includes 57 editable slides with various pyramid chart designs.
What pyramid styles are available?
Includes inverted, segmented, stepped, and classic pyramid variations.
Does it include icons and additional elements?
Yes, built-in icon libraries for different themes are included.
Is the download instant?
Yes, you can download the files immediately after completing your purchase.