Project Tracking Keynote Charts - Editable | ImagineLayout


Type: Keynote Charts template
Category: Relationship, 3D
Sources Available: .key
Product ID: KC01109
Template incl.: 41 editable slides
What is a Keynote chart template? A Keynote chart template is a collection of ready-made editable data visualization slides in .key format for Apple Keynote that lets users create professional graphs for business presentations without manual design work.
Package Contents
41 editable slides come packaged in a single .key file designed for project tracking tasks.
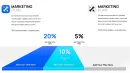
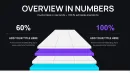
Chart layouts integrate into full decks where individual progress graphs support overall milestone summaries and status overviews in strategy meetings.
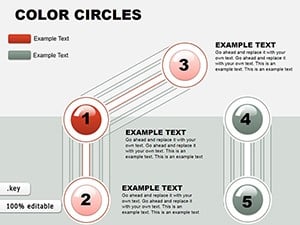
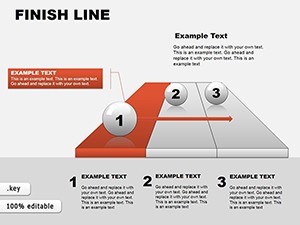
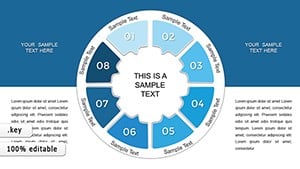
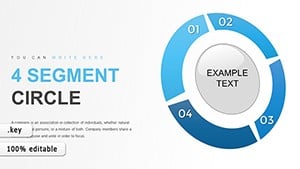
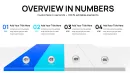
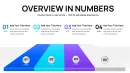
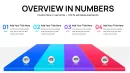
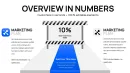
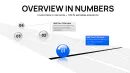
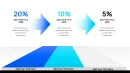
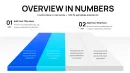
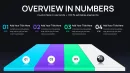
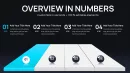
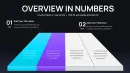
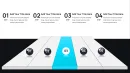
The finish line approach with its track line style sets this collection apart from abstract circle or relationship layouts by providing clear flow direction for deadline communication in comparable data visualization collections.
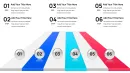
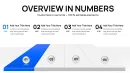
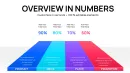
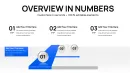
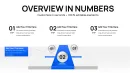
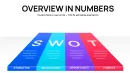
- 41 project tracking charts
- Editable shapes and icons
- Slide master color schemes
Key Specifications At a Glance
| Feature | Details |
|---|---|
| Slides / diagrams included | 41 charts for project tracking |
| Editable shapes | chart segments resize and recolor independently |
| Text placeholders | labels update without unlocking grouped elements |
| Color theme adjustments | compatible with Keynote slide master palette |
| Diagram connectors | arrows and lines adjustable in direction and weight |
| Icon layers | finish line icons replaceable without affecting layout |
| Export options | .key for editing, PDF for distribution |
| Aspect ratio | 16:9 widescreen |
Real Scenarios
A project manager at a software development company needed to present project tracking metrics in a board briefing.
The 41 slides enabled clear data visualization and cut deck preparation from 3 hours to 45 minutes.
A management consultant reused the template file across three client reports by swapping color schemes in consulting decks.
This supported adapted diagrams for five consecutive quarterly briefings without a designer.
Download and start editing immediately
From Download to Final Deck
Editing difficulty: Moderate
- Open the .key file in Keynote 12 or later (1 minute).
- Replace placeholder text and update chart data (5 minutes).
- Adjust color theme adjustments through the slide master (3 minutes).
- Customize diagram connectors and icon layers (2 minutes).
- Export the presentation for your business presentation (1 minute).
Professionals often combine this with other project focused charts for expanded options.
Why This Template, Not a Blank Slide
Creating equivalent charts from scratch demands 4 hours and high design skill level.
This template reduces the task to 20 minutes at moderate skill.
Manual efforts typically result in mismatched visual hierarchy and weak information spacing that slow audience comprehension.
The finish line charts rely on zone segmentation where color contrast highlights completion levels before labels are read in investor decks alongside relationship data charts.
- Time required manually: 4+ hours
- Skill level needed from zero: advanced
- Typical problems: inconsistent flow direction and layout composition
Download and start editing immediately
How do you adapt the template to your brand? Use the slide master for global color theme adjustments in under 10 minutes.
- Open slide master view.
- Modify the color palette.
- Apply to all slides.
- Override individual elements if needed.
What Keynote versions does this template support?
The template opens in Keynote 12 and later on macOS. Earlier versions may not support all editable shapes or master features fully. Test the file in your installed version before full editing sessions. If issues arise update to the current Keynote release for full compatibility with all chart elements.
How do I change the color scheme in these Keynote charts?
Open the file and switch to slide master view. Update the color theme adjustments on the master for global changes across the 41 slides. This method ensures consistency without repeating work on individual charts. Individual shape overrides remain available for exceptions in your data visualization.
What does the license permit for this Keynote chart template?
The license allows use in internal business presentations and paid client work. Multiple team members cannot share one license unless the terms state otherwise. Always review the license file included in the download for exact permitted uses. Commercial redistribution of the template files themselves is prohibited.
What are the differences between free and paid versions of this template?
The product page lists only the paid version at $18 which includes the full 41 editable slides. No free version or limited trial appears on the page. The paid tier provides complete access to all chart layouts and customization options. Check the download after purchase to confirm all files and features are included as described.
What is the refund policy if the template does not meet my needs?
Refunds are available under the platform's standard conditions if the file does not open or function as described in the specifications. Contact support with details of the issue within the allowed timeframe after purchase. The policy does not cover change of mind after successful download and editing. Always test the .key file in your Keynote version before relying on it for important presentations.
How do I update chart data in these project tracking charts?
Select any chart slide and use the built-in data editor in Keynote to modify values. The graph updates automatically after closing the editor window. This works for all 41 slides and maintains the finish line visual structure. Recheck labels and connectors after data changes to preserve information spacing.