Network Charts Keynote Template - Fully Editable 26 Slides | Instant Download | ImagineLayout

Type: Keynote Charts template
Category: Cycle, Relationship, Pie
Sources Available: .key
Product ID: KC01084
Template incl.: 26 editable slides
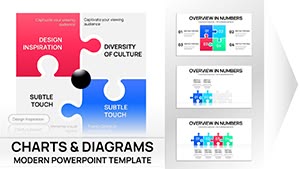
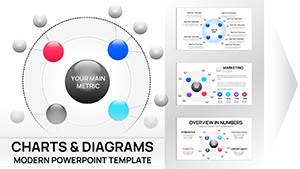
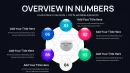
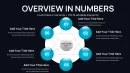
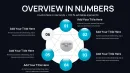
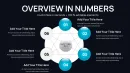
Get the Connected Balls network charts Keynote template with 26 fully editable slides in .key format. Visualize interconnected data points, relationships and ecosystems instantly for sales demos or strategy sessions. Commercial license and immediate download included.
What's Included
This package contains a complete .key file with exactly 26 editable slides built around connected balls network layouts. Each slide includes scalable sphere placeholders, connection lines, text labels and data fields ready for your content. The file opens directly in Keynote on Mac and supports both 16:9 and 4:3 aspect ratios through simple resizing. No additional software or fonts are required. You also receive full access to vector-based elements that maintain quality at any zoom level.
File and Slide Details
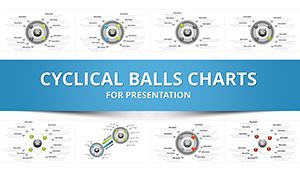
The 26 slides provide a range of network complexity options from basic pairwise connections to multi-hub systems. Every element is grouped for quick selection and batch editing. The template arrives as a single downloadable .key archive sized for fast delivery. Once opened you can duplicate slides or delete extras to match your exact deck length.
Key Features
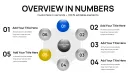
The connected balls structure lets you show how individual data points link into larger stories. Spheres act as nodes while lines represent relationships that you can curve or straighten. Text placeholders sit inside or beside each ball for metrics or labels. All colors and line weights are fully adjustable through Keynote's native inspector panel. The layout maintains alignment across slides for consistent branding.
Editable Elements List
| Feature | Details |
|---|---|
| Slide Count | 26 fully editable slides |
| File Format | Native .key Keynote file |
| Node Types | Scalable connected spheres with text placeholders |
| Connection Lines | Adjustable bezier-style paths |
| Color Controls | Full fill, stroke and opacity options |
| Layout Flexibility | Supports widescreen and standard formats |
These six core attributes make the template suitable for both quick updates and detailed builds.
Professional Use Cases
A regional sales director at a logistics firm used the connected balls layouts to map Southeast Asia distribution networks during a quarterly review. By placing key hubs as spheres and drawing relationship lines to show supply routes the presentation highlighted bottlenecks in under five minutes of editing. The board immediately understood interdependencies leading to approval of two new warehouse investments. Another example is a strategy consultant at a SaaS company who built a full client ecosystem slide deck in one hour instead of three days of manual drawing.
Additional Scenarios
Marketing managers in tech startups regularly apply the same layouts to demonstrate product feature relationships to investors. The visual linking of spheres turns abstract roadmaps into clear narratives that close funding rounds faster.
How to Customize
Download the .key file and open it in any recent version of Keynote. Select any sphere to change its fill color or size using the format panel. Drag the endpoints of connection lines to reroute paths or use the bezier handles for curved flows. Replace all placeholder text by clicking inside each label field. To add data tables simply insert a native Keynote table object and position it beside the relevant network cluster. Export the finished deck as PDF or PPTX for sharing. The entire process from download to final presentation typically takes less than thirty minutes.
Step-by-Step Workflow
After opening the file duplicate any slide you want to reuse then edit only the text and colors. Group select multiple spheres when you need uniform styling changes. This workflow saves hours compared with building network diagrams from blank slides.
Why Choose This Template
Building network charts from scratch in Keynote requires hours of aligning objects and manually drawing lines that often misalign when resized. This template provides 26 pre-aligned connected balls layouts so you focus on your message rather than geometry. The vector precision ensures sharp output at any screen size while the consistent styling across all slides creates a polished deck in minutes. Users report finishing entire sections three times faster than manual methods with visibly professional results that impress clients and executives.
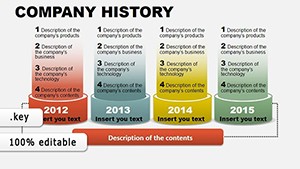
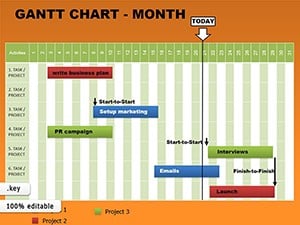
Compared with other chart templates on the site such as cycle or gantt options this one specifically solves the challenge of showing non-linear relationships through sphere connections. The lower entry price combined with 26 slides gives exceptional value for teams that need multiple network views in one presentation.
Download now to start creating clear visual narratives that turn complex data into compelling stories.
Is this Keynote template compatible with the latest version of Keynote?
Yes the template is built in the current Keynote format and opens without issues in all versions from Keynote 10 onward. You can use it on the latest macOS and iOS releases with full access to native editing tools. No conversion steps are needed. The file also works on older supported versions although some newer animation features may not appear. Test opening the file immediately after download to confirm compatibility with your specific Keynote installation.
How do I edit the connected balls and links in the template?
Select any sphere object then use the format panel to adjust fill color size or border. To move connections simply click the line endpoint and drag to a new sphere or position. Bezier curve handles let you bend paths smoothly. Group multiple balls by shift-clicking then apply uniform changes like color or font. All edits are non-destructive and reversible with Keynote's undo function. This process lets you completely reconfigure networks in seconds.
What licensing options are included with the download?
The purchase grants a commercial use license for both personal and client projects. You may use the slides in paid presentations webinars or internal reports without additional fees. The license does not allow resale of the template itself or distribution of the original .key file. Unlimited edits and exports are permitted. This structure protects your work while giving full flexibility for professional applications across industries.
Can I import my own data or media into the spheres?
Absolutely you can replace any text placeholder with your metrics or labels. For media simply drag images icons or videos directly onto a sphere using Keynote's media placeholder tool. The sphere frames automatically mask content to fit. Data tables can be inserted beside networks for supplementary details. This capability turns generic layouts into highly personalized visuals tailored to your exact dataset or branding.
How does this template differ from other chart templates on the site?
While cycle or gantt templates focus on sequential flows this one uses connected balls specifically for non-linear relationships and ecosystems. It offers 26 dedicated network slides versus the mixed layouts in other products. The sphere-and-link design is unique among listed related templates and solves visualization challenges that timelines or puzzles cannot address. The 26-slide count also provides more ready options than many single-theme alternatives.