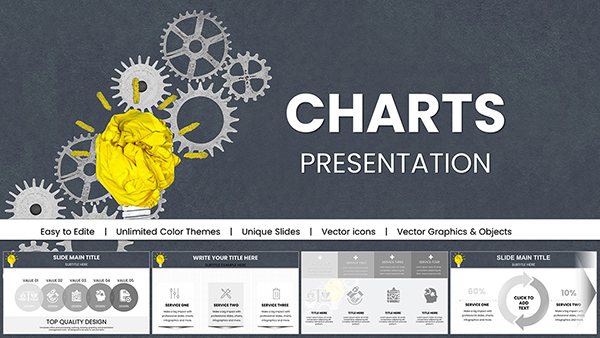
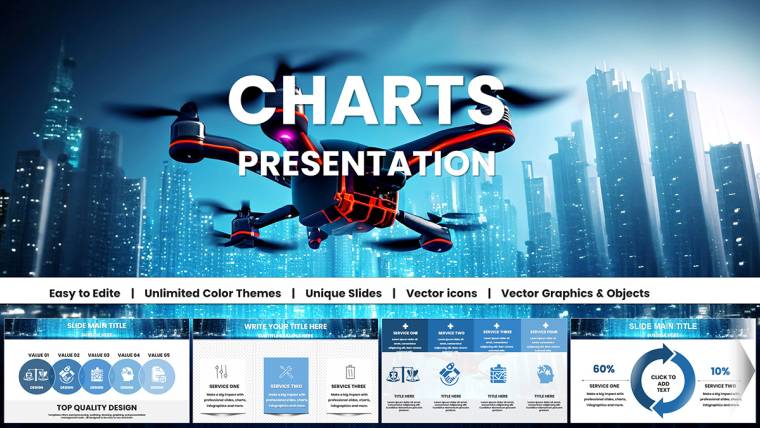
Drone IT Technology Charts Keynote Template: Elevate Tech Innovations Visually


Type: Keynote Charts template
Category: Illustrations
Sources Available: .key
Product ID: KC01052
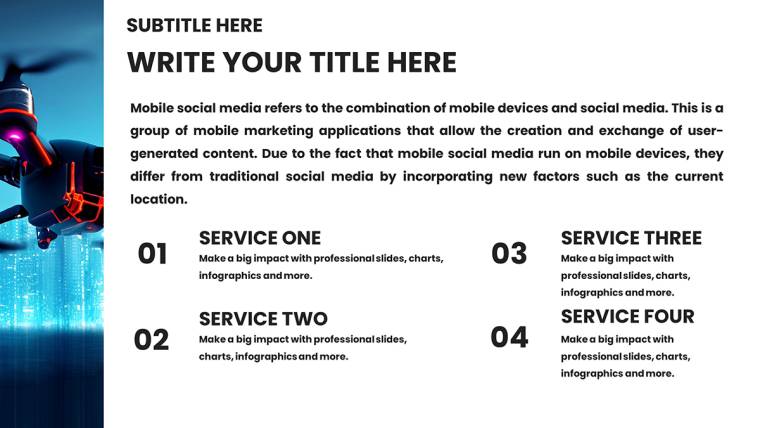
Template incl.: 40 editable slides
In an era where drone technology and IT advancements redefine industries, presenting your ideas with precision is crucial. Picture unveiling a groundbreaking AI-driven drone prototype to investors, using sleek charts that highlight performance metrics and future projections. Our Drone IT Technology Charts Keynote Template delivers just that - with 40 editable slides tailored for engineers, startups, and tech enthusiasts. This isn`t your average slide deck; it`s a gateway to professional, data-rich narratives that captivate and convince in boardrooms or tech conferences.
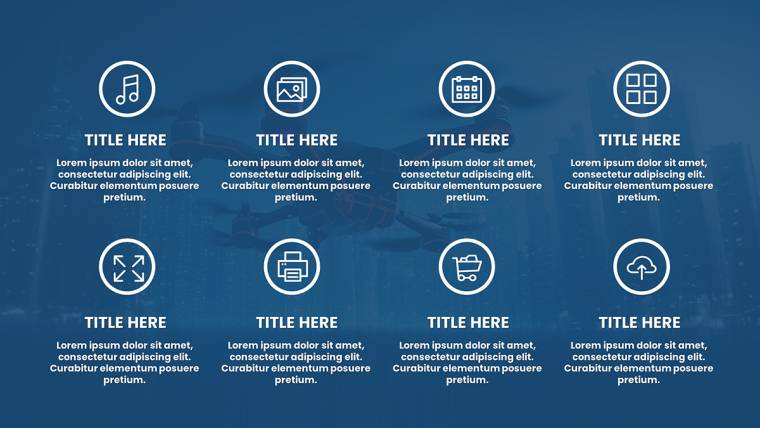
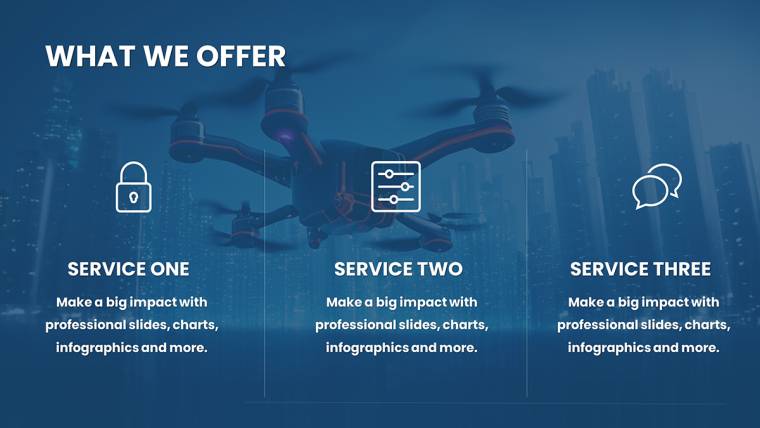
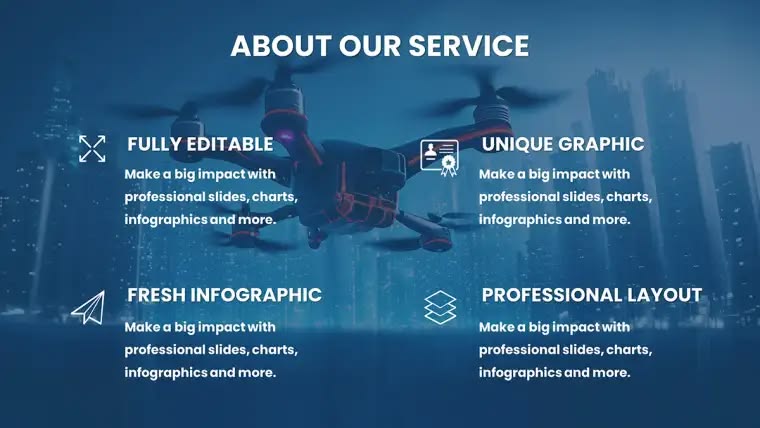
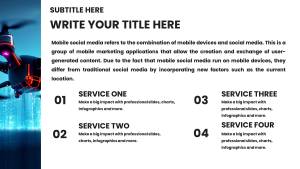
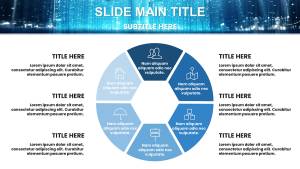
Designed with modern minimalism in mind, these slides blend statistical diagrams with tech-themed icons, making complex IT concepts accessible. From showcasing autonomous flight data to comparing sensor efficiencies, you`ll address pain points like cluttered visuals in standard tools. Inspired by real innovations from companies like DJI or Intel`s drone divisions, this template empowers you to tell stories that drive decisions. It`s more than slides; it`s your competitive edge in the fast-evolving drone IT landscape.
Core Features That Propel Your Presentations Forward
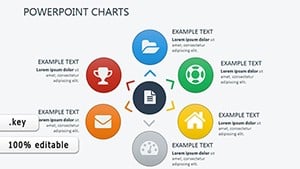
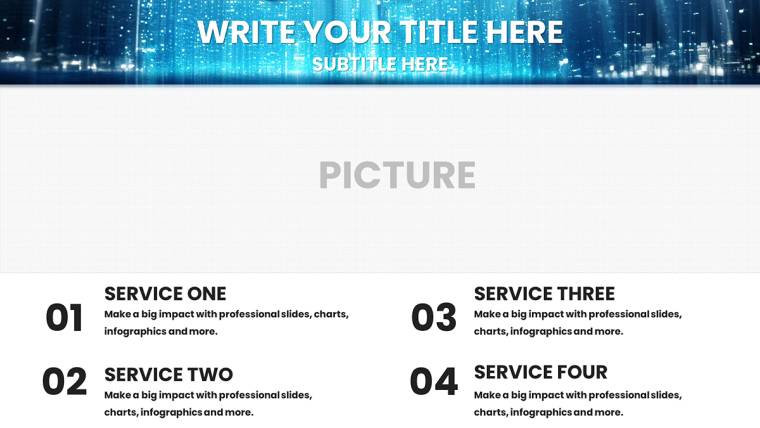
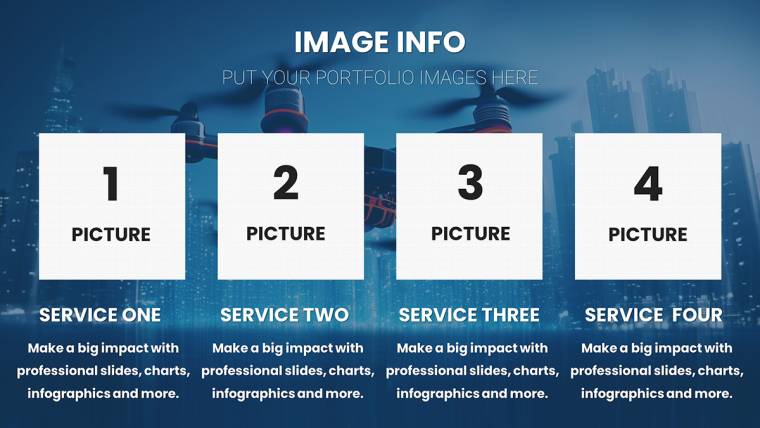
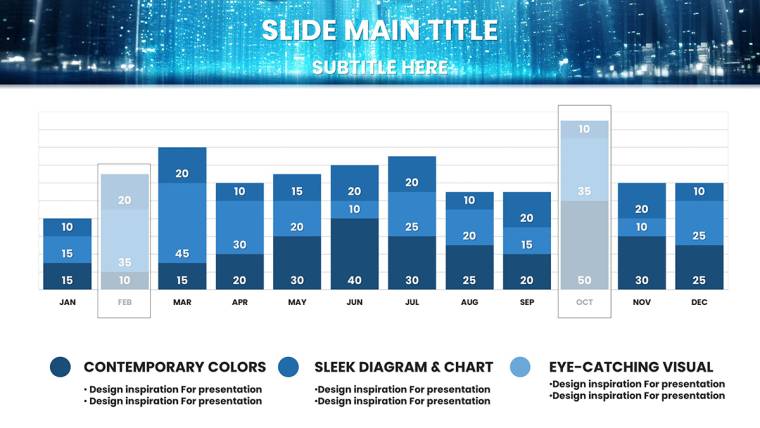
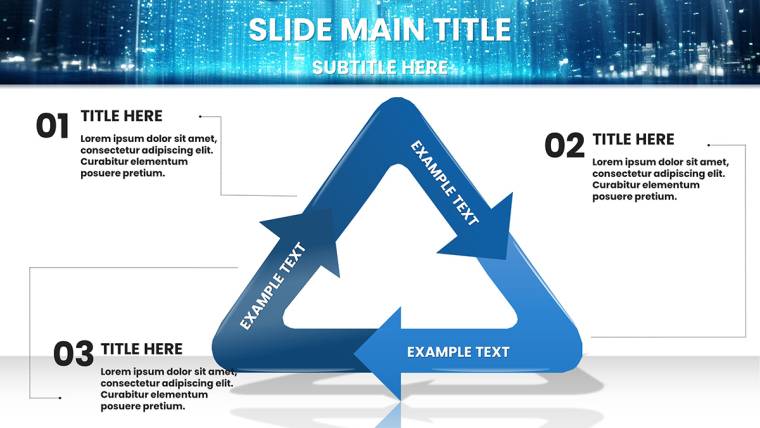
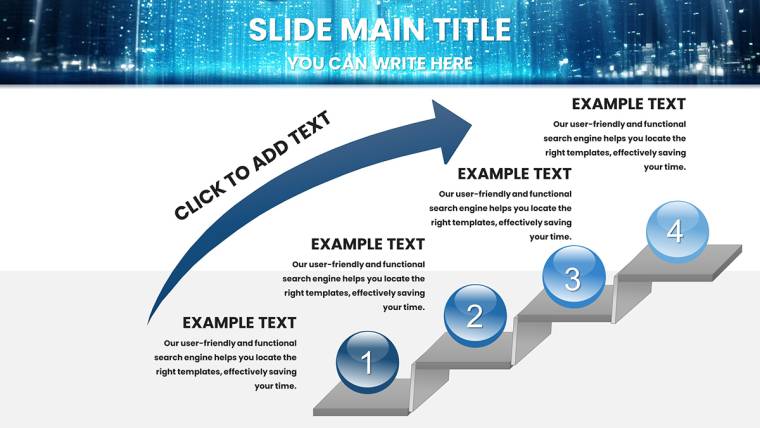
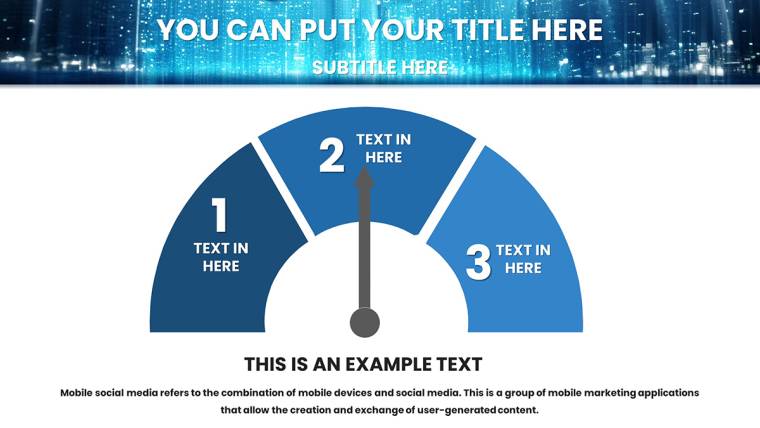
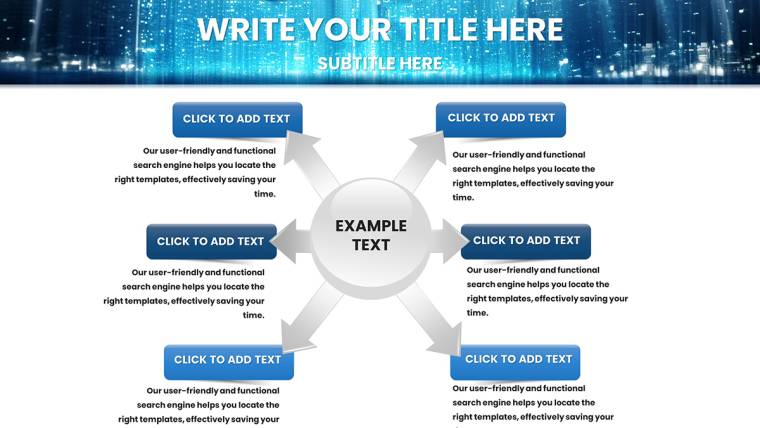
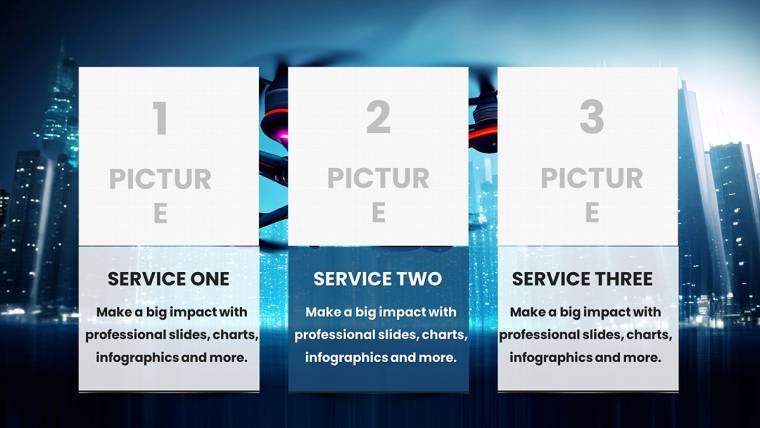
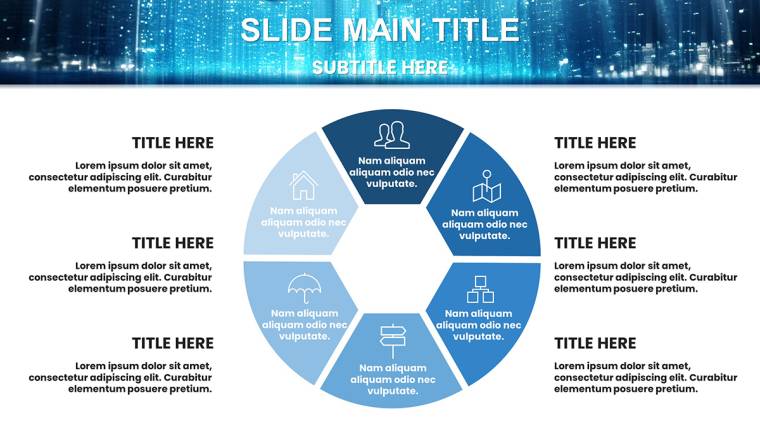
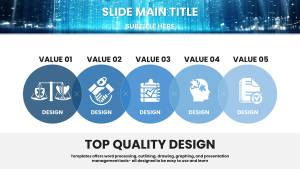
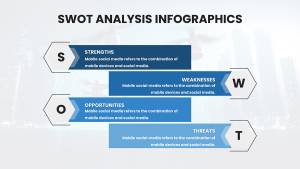
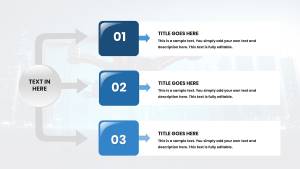
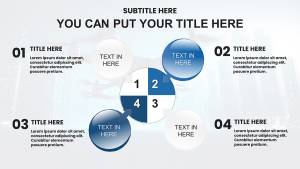
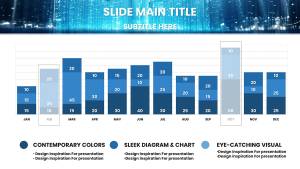
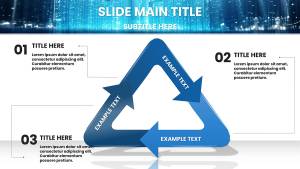
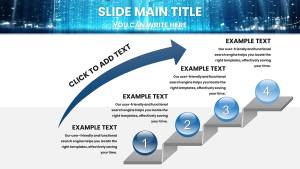
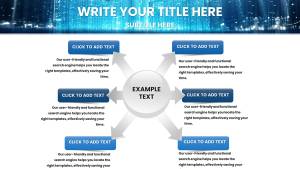
At the heart of this template are customizable infographics that turn raw data into insightful visuals. Think drone trajectory maps with editable paths, or bar charts depicting battery life comparisons - all in a clean, tech-forward aesthetic. The slides support high visual hierarchy, ensuring key metrics stand out, much like user interfaces in apps such as Autodesk`s drone software.
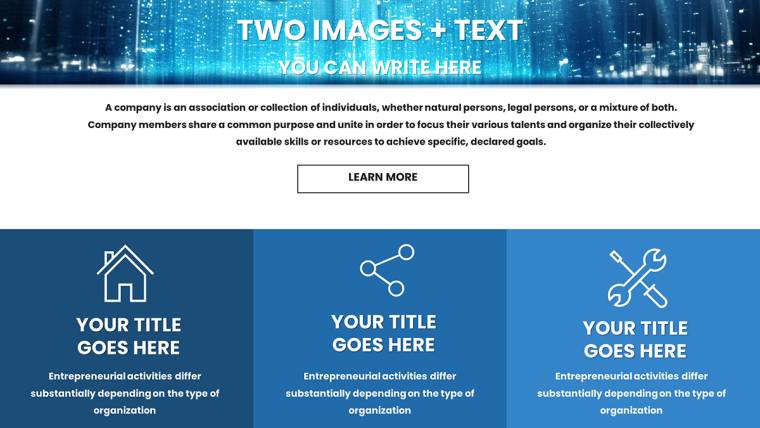
Compatibility shines here: Optimized for macOS Keynote, with easy exports to other formats. Features include responsive layouts that adapt to different screen sizes, perfect for virtual demos. Themed elements like circuit patterns and drone silhouettes add flair without overwhelming, allowing you to maintain a professional tone.
Editing is intuitive - drag and drop your data, tweak colors to align with your brand (e.g., metallic grays for a futuristic vibe), and animate transitions for emphasis. This efficiency mirrors agile methodologies in IT, saving you time for what matters: innovation.
In-Depth Look at Slide Layouts and Capabilities
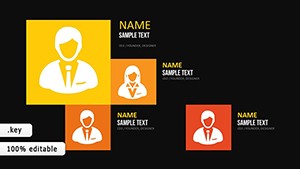
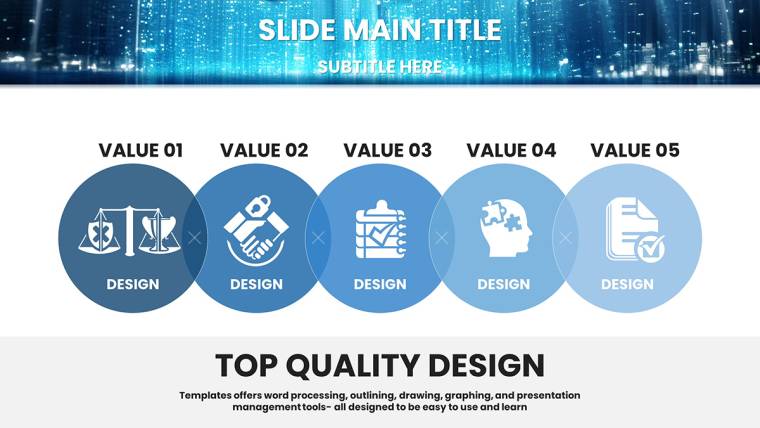
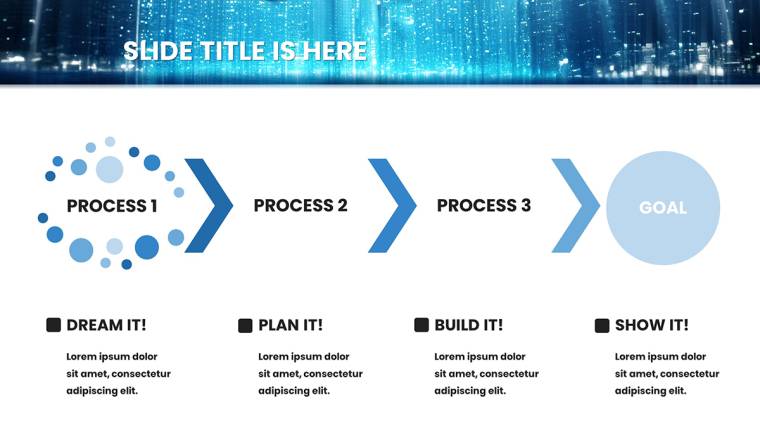
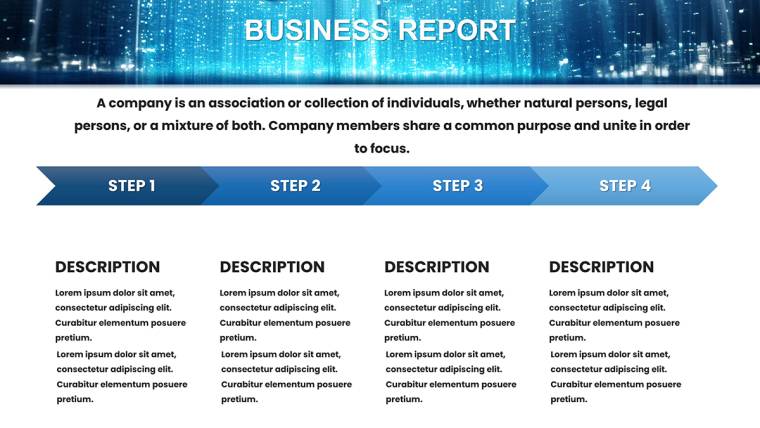
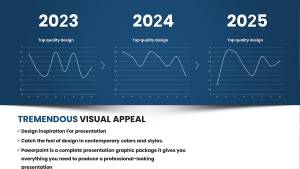
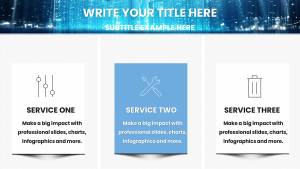
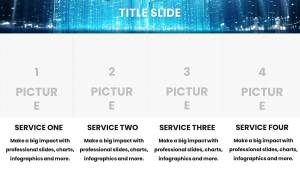
Breaking it down, early slides focus on overviews, like #1-5 with introductory tech timelines tracing drone evolution from military uses to commercial applications. Slide #8, for instance, offers a comparison chart for drone models, ideal for product managers evaluating specs like payload capacity or flight range.
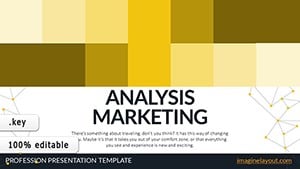
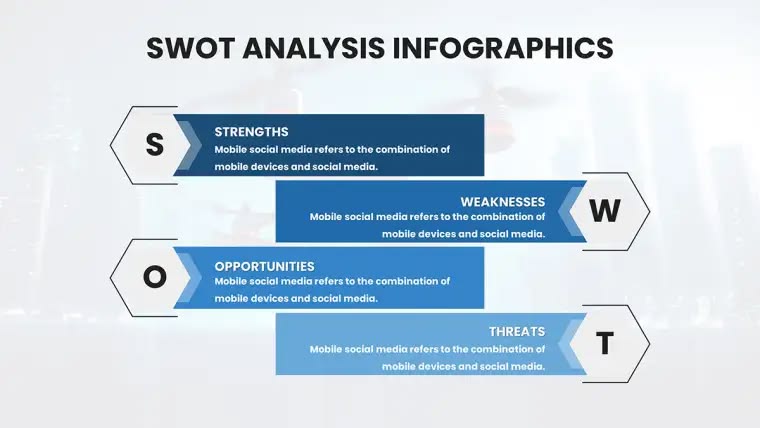
Mid-sections (#15-25) dive into data: Statistical diagrams for AI algorithm performance, perhaps illustrating machine learning accuracy in obstacle avoidance, drawing parallels to Tesla`s autonomous tech. Use these for startup pitches, where visualizing ROI can secure funding, as seen in successful Kickstarter campaigns for drone projects.
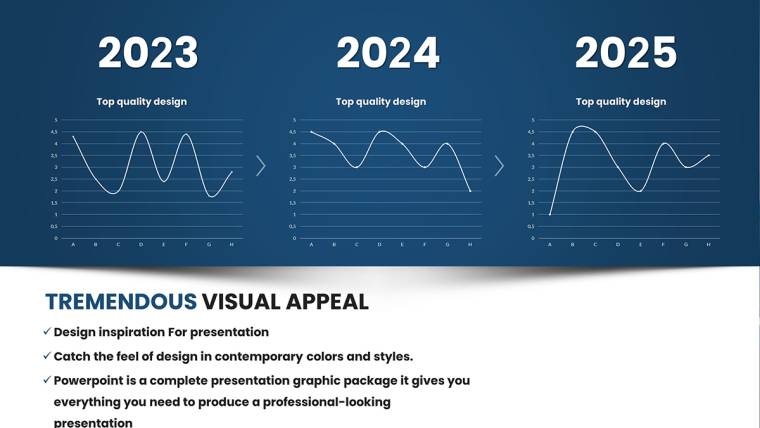
Later slides (#30-40) emphasize futures: Projection charts for market growth, backed by infographics on regulatory impacts like FAA guidelines. Close with action-oriented summaries, reinforcing your call for collaboration or investment.
Practical Use Cases: From Startups to Enterprise Solutions
This template excels in varied tech scenarios. For IT specialists in agriculture, use it to present drone surveying data, showing yield improvements via heat maps - real results akin to those from PrecisionHawk. Startups can pitch to VCs with polished decks that highlight unique selling points, boosting credibility.
In engineering teams, facilitate project reviews with comparison slides on software iterations. A case from Google`s Project Wing demonstrates how visual aids accelerated development cycles. Versus basic Keynote, this offers pre-optimized tech themes, reducing design time by half.
Pro Tips to Optimize Your Drone IT Deck
- Data integration: Link to spreadsheets for live updates, keeping stats current.
- Visual balance: Use negative space to avoid clutter, enhancing readability.
- Engagement boosts: Incorporate subtle animations for drone flight paths.
- Collaboration: Share via iCloud for team edits in real-time.
These insights, honed from marketing tech products, ensure your presentations land with impact.
Launch Your Tech Story Now
Don`t let outdated slides ground your ideas. Download the Drone IT Technology Charts Keynote Template and innovate with confidence.
Frequently Asked Questions
- Are the charts fully customizable?
- Yes, edit layouts, data, and themes easily in Keynote.
- Does it work on older Keynote versions?
- Compatible with recent macOS Keynote; test for older ones.
- What formats are provided?
- .key file for direct Keynote use.
- Suitable for non-drone IT topics?
- Absolutely, adaptable for general tech presentations.
- How to add animations?
- Use Keynote`s built-in tools on editable elements.
- Is there a demo version?
- Contact support for previews before purchase.