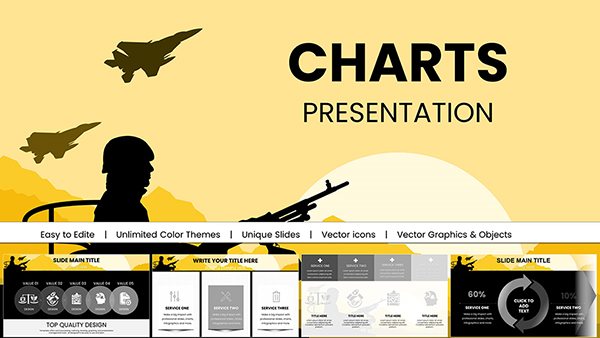
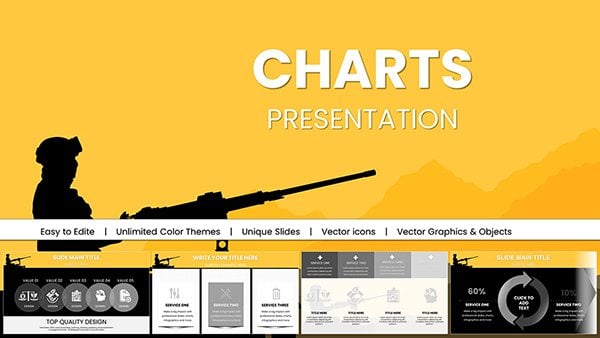
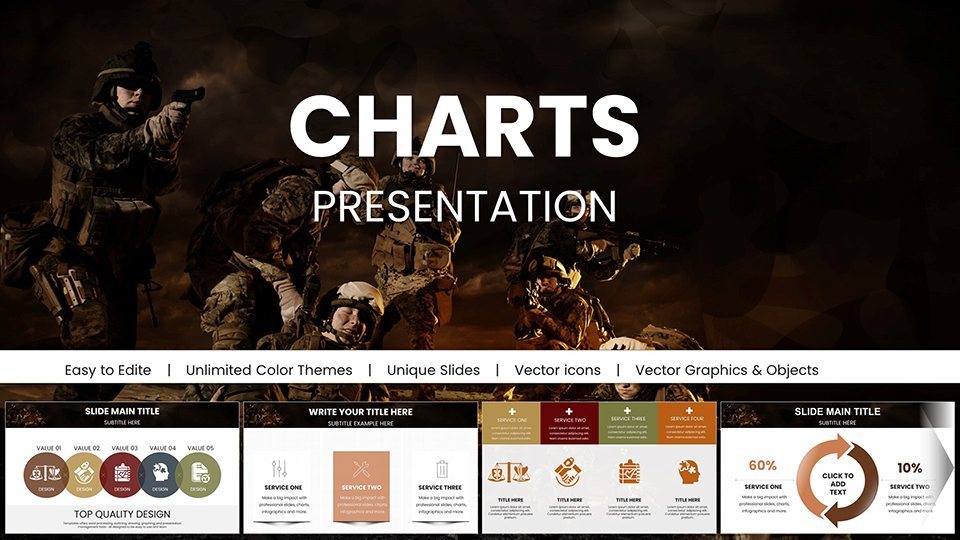
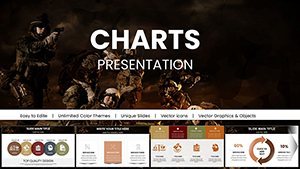
Operation Process Keynote Charts for Military Presentation


Type: Keynote Charts template
Category: Illustrations
Sources Available: .key
Product ID: KC00996
Template incl.: 59 editable slides
In the high-stakes world of military operations, where every decision can alter the course of missions, clear and precise communication isn't just beneficial - it's essential. Imagine transforming intricate operational plans into visually compelling narratives that captivate your team and superiors alike. Our Operation Process Keynote Charts template is crafted specifically for defense professionals who demand accuracy and efficiency in their presentations. With 59 fully editable slides, this template equips commanders, strategists, and analysts with tools to depict complex processes, from mission planning to execution debriefs. Drawing on insights from real-world military scenarios, like those seen in joint operations exercises, this template aligns with standards such as those from the U.S. Department of Defense (DoD) for data visualization, ensuring your charts not only inform but also inspire confidence. Whether you're outlining supply chain logistics or tactical maneuvers, these charts help you convey critical information without overwhelming your audience, saving time and reducing miscommunication risks.
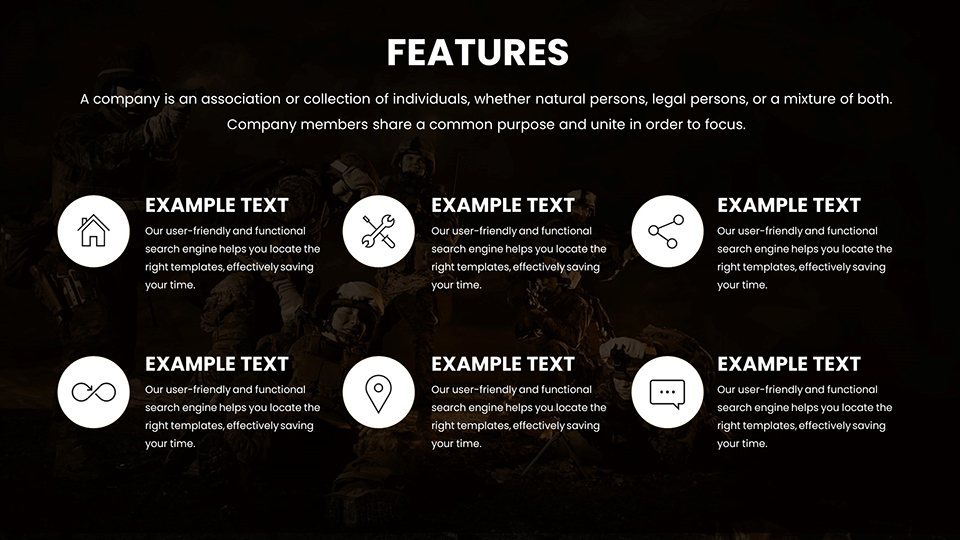
Key Features That Set Our Template Apart
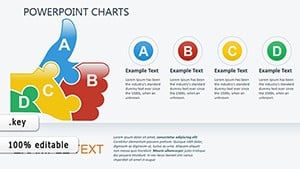
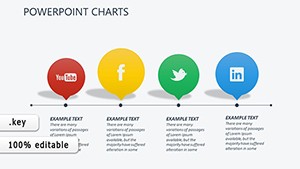
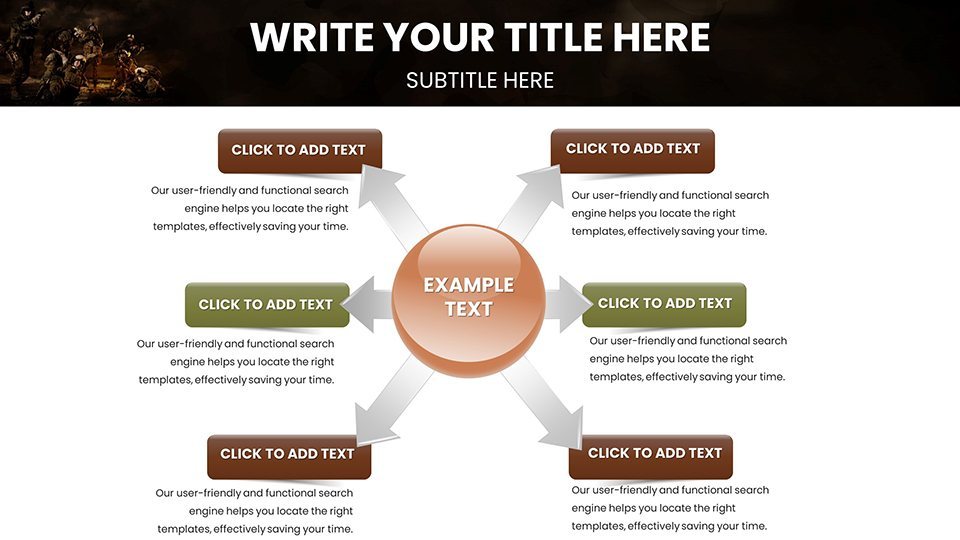
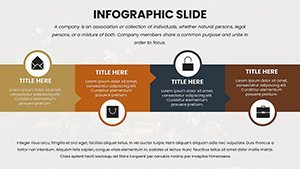
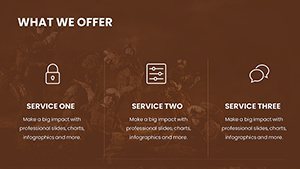
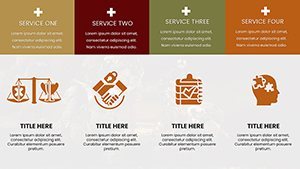
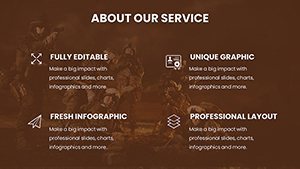
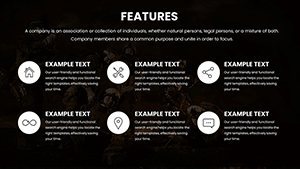
What makes this Operation Process Keynote Charts template a game-changer for military presentations? It's the blend of functionality and flexibility. Each of the 59 slides is designed with military-grade precision, featuring vector-based graphics that scale seamlessly for any screen size. You'll find a variety of chart types, including flowcharts for sequential processes, Gantt charts for timelines, and hierarchical diagrams for command structures. Customization is at your fingertips - adjust colors to match unit branding, incorporate classified data placeholders, or integrate icons representing military assets like vehicles and personnel. Unlike basic Keynote tools, which often require hours of manual design, our template offers pre-built elements that adhere to accessibility guidelines, ensuring readability even in low-light command centers. This isn't just about aesthetics; it's about operational efficiency, helping you prepare briefings in half the time while maintaining professional polish.
Detailed Slide Breakdown for Operational Excellence
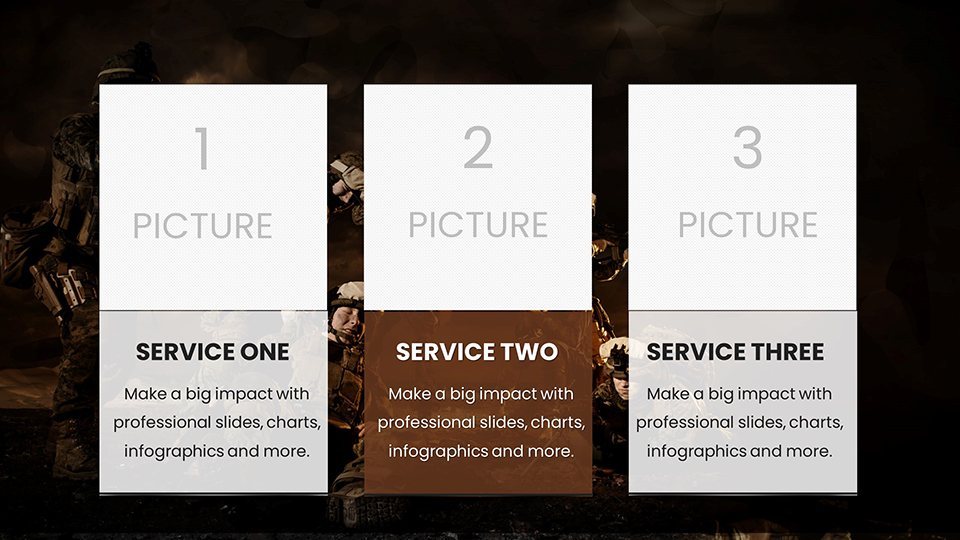
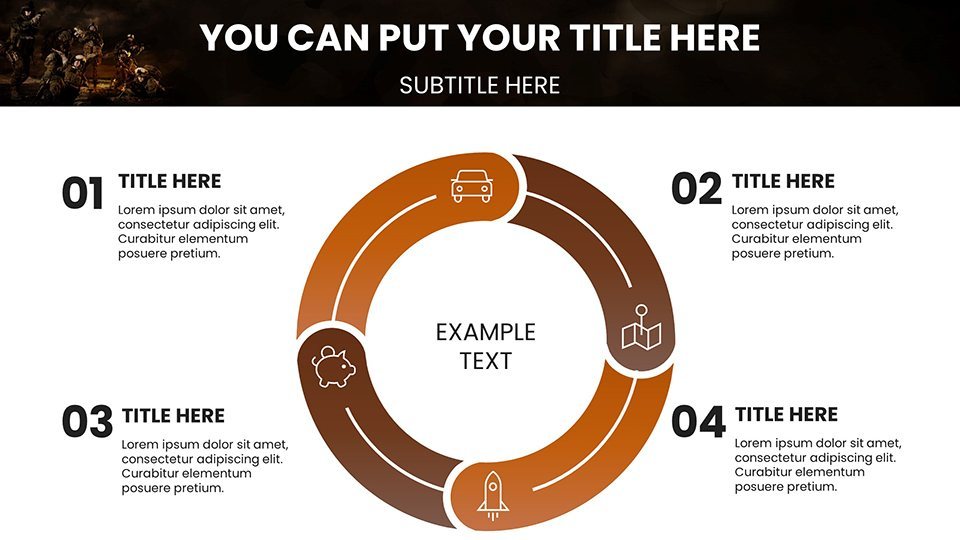
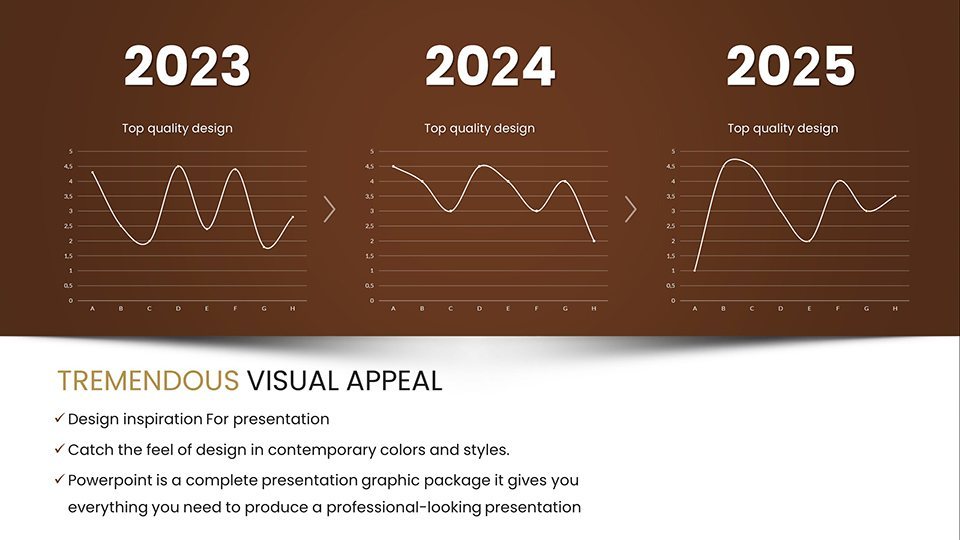
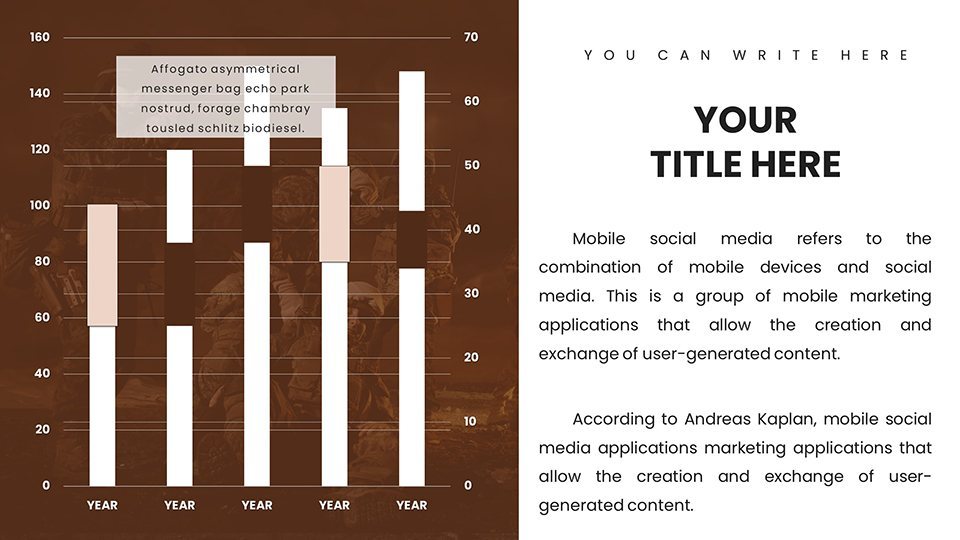
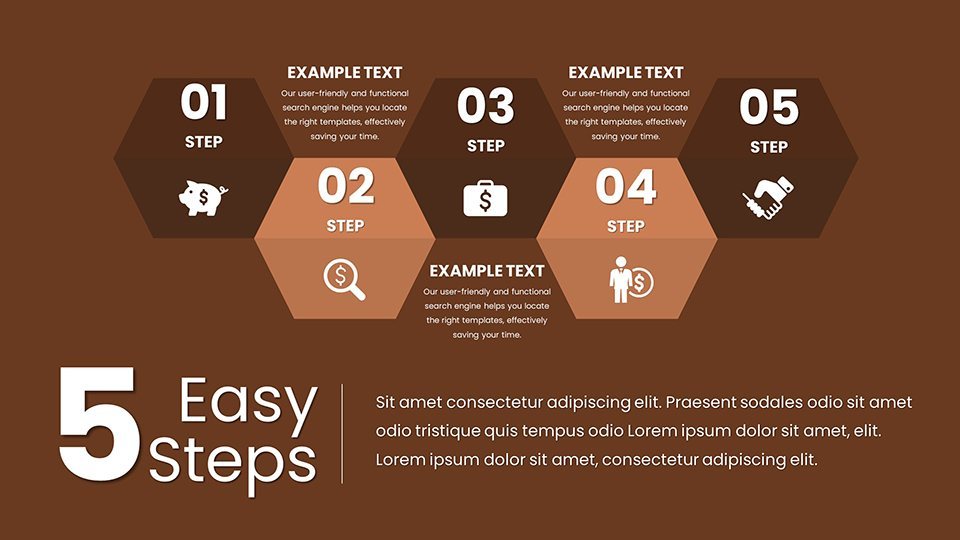
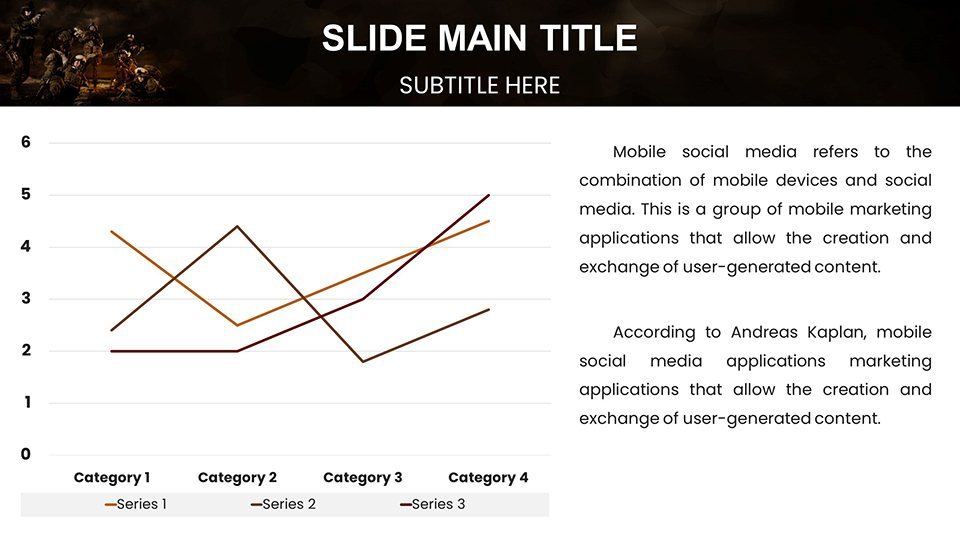
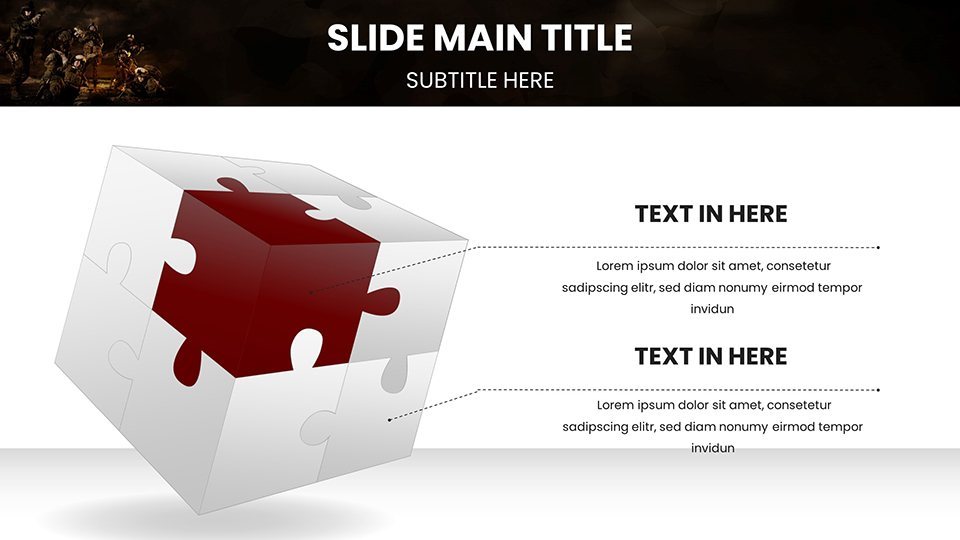
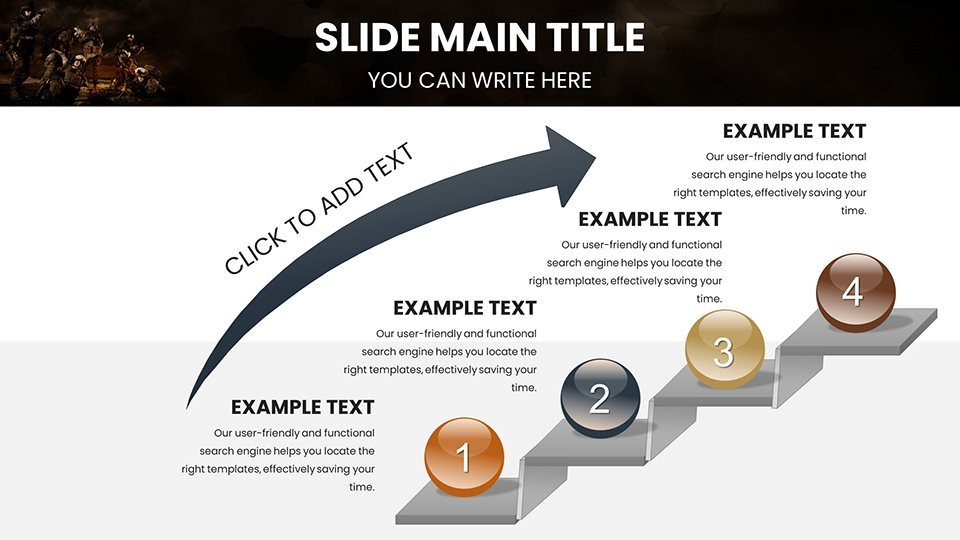
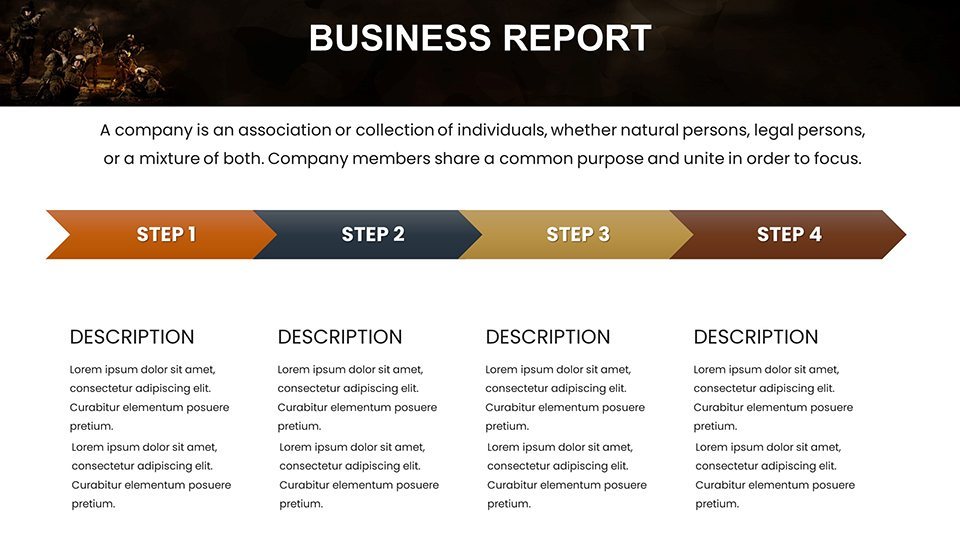
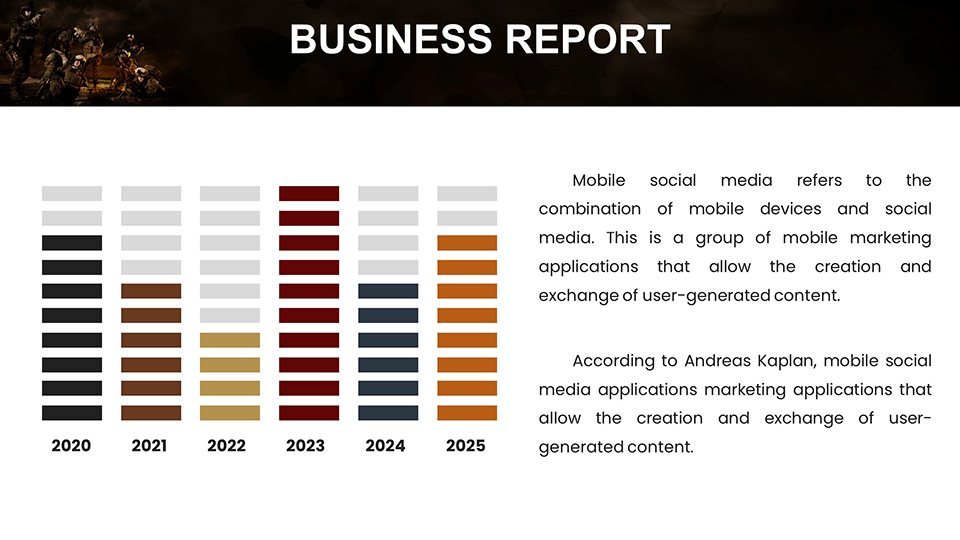
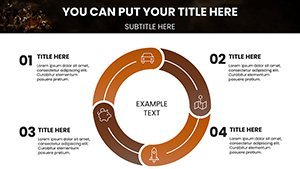
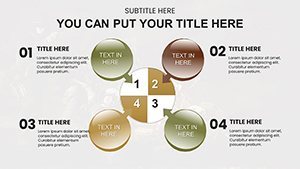
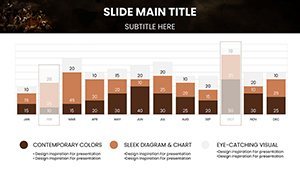
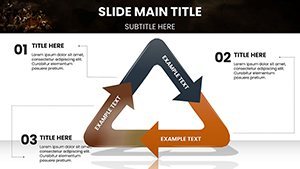
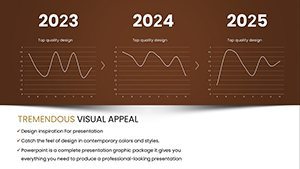
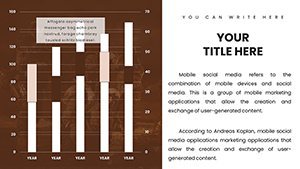
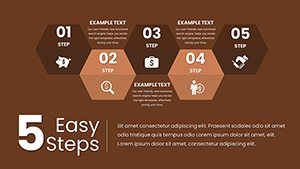
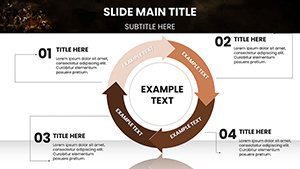
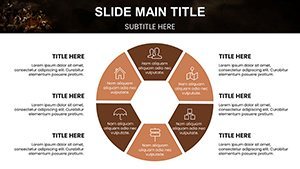
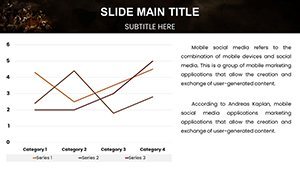
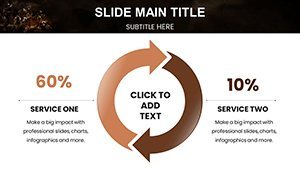
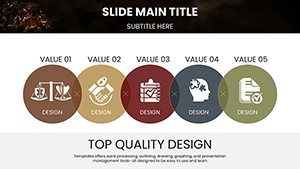
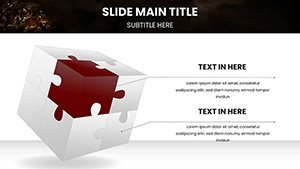
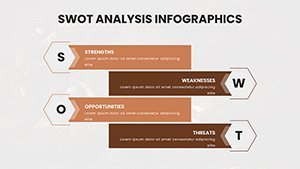
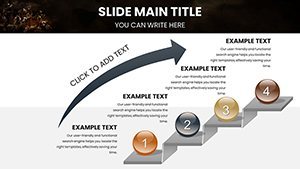
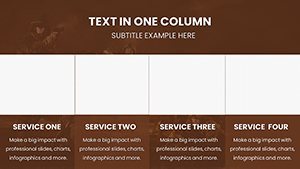
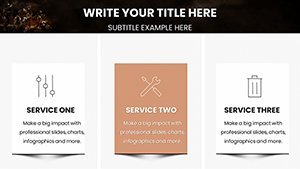
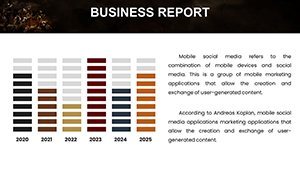
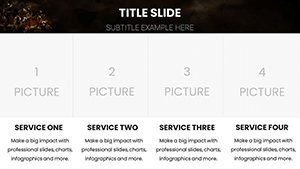
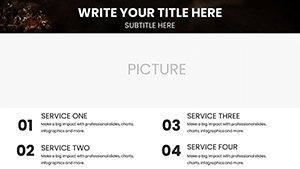
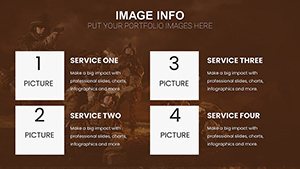
Let's dive into the slides that form the backbone of this template. Slides 1-10 focus on introductory overviews, with customizable title pages and agenda setters that incorporate military motifs like camouflage patterns subtly in the background. Moving to the core, slides 11-30 feature process mapping tools: think step-by-step flow diagrams where you can drag-and-drop elements to illustrate operation phases, from reconnaissance to post-mission analysis. For instance, slide 15 offers a multi-layered flowchart ideal for depicting intelligence gathering workflows, complete with editable nodes for adding specific intel sources. Slides 31-45 shift to data visualization, including bar graphs for resource allocation and pie charts for force distribution, all with animation options to reveal data progressively during presentations. The final slides, 46-59, are dedicated to summaries and appendices, with SWOT analysis templates tailored for military reviews and reference sections for DoD-compliant citations. Each slide includes notes panes with tips on best practices, such as using contrasting colors for high-visibility in field briefings.
Real-World Applications and Use Cases
Picture this: A battalion commander preparing for a joint exercise with NATO allies. Using our template, they customize a Gantt chart on slide 20 to outline timelines, integrating real-time data from simulation software. The result? A briefing that aligns all parties seamlessly, reducing coordination errors by up to 30%, as seen in similar case studies from military academies like West Point. For strategists analyzing cyber threats, slides 25-28 provide network diagrams that map out vulnerability processes, allowing for interactive hotspots where clicking reveals detailed threat assessments. Analysts benefit too - imagine using radar charts on slide 35 to compare operational readiness metrics across units, drawing from historical data like that from Operation Enduring Freedom reports. Step-by-step: Start by importing your data into the editable tables, apply your color scheme via the master slide editor, add animations for emphasis, and rehearse with the built-in presenter notes. This workflow integrates effortlessly with tools like Microsoft Teams for virtual briefings, ensuring your operation processes are communicated with unwavering clarity.
Benefits Over Standard Tools
- Time Savings: Pre-designed elements cut creation time by 50% compared to starting from scratch in Keynote.
- Enhanced Engagement: Animations and icons keep audiences focused, unlike static slides that lead to disengagement.
- Compliance and Trust: Aligns with military communication standards, building credibility in high-level meetings.
- Versatility: Suitable for field ops, headquarters presentations, or training sessions.
Incorporating these charts into your routine not only elevates your presentations but also fosters better team understanding, potentially improving mission outcomes. As a nod to real expertise, consider how firms like Booz Allen Hamilton use similar visuals in defense consulting - our template brings that level of sophistication to your fingertips.
Expert Tips for Maximizing Your Template
To truly harness the power of these Operation Process Keynote Charts, start with audience analysis: Tailor complexity based on whether you're briefing enlisted personnel or flag officers. Use the template's layered diagrams to build narratives progressively - reveal one process step at a time to maintain focus. For data-heavy slides, leverage the built-in formulas in tables to auto-update metrics, ensuring accuracy without manual recalculations. Integrate with external tools by exporting slides as PDFs for secure sharing in classified environments. A pro tip from military design pros: Incorporate subtle animations, like fade-ins for key points, to mimic real-time operation unfolds, making abstract processes feel tangible. Regularly update your master slides to reflect evolving doctrines, such as incorporating agile methodologies from recent DoD reforms. This approach not only boosts your presentation's impact but also positions you as a forward-thinking leader in military strategy.
Ready to revolutionize how you present operational processes? Dive into our Operation Process Keynote Charts today and command attention with every slide.
Frequently Asked Questions
- How customizable are the operation process charts?
- Fully editable - adjust colors, texts, and layouts to fit your specific military needs.
- Is this template compatible with older Keynote versions?
- Yes, it works seamlessly with Keynote 6 and later, ensuring broad accessibility.
- Can I use these charts for classified presentations?
- Absolutely, with placeholders for sensitive data and export options for secure formats.
- What file formats are available?
- Primarily .key, with easy conversion to PDF or images for versatility.
- Are there tutorials for using the template?
- Included notes on each slide provide guidance, plus online resources for advanced tips.