 Click to zoom
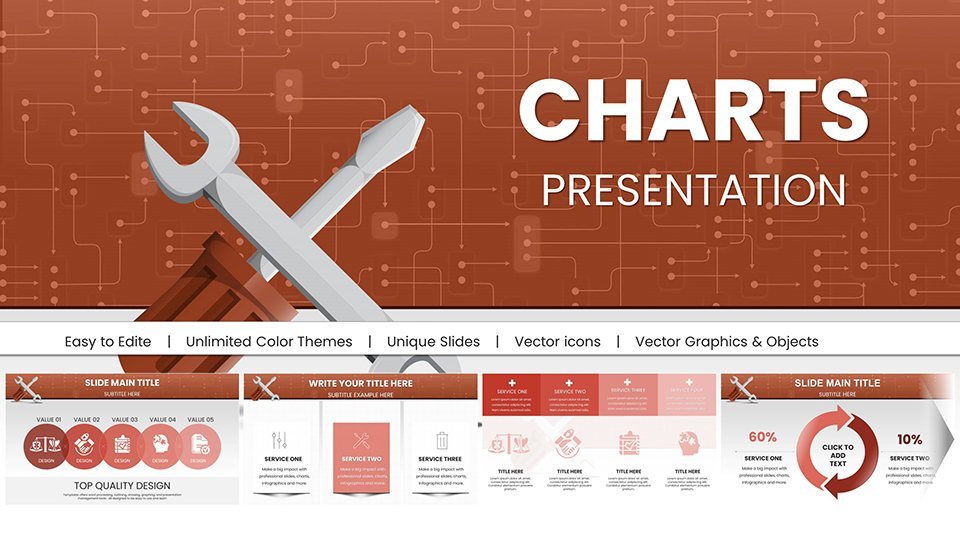
Repair Service Keynote Charts Template: Transform Maintenance Data into Compelling Stories
| Format | .pptx |
| Slides | 58 unique layouts |
| Aspect ratio | 16:9 |
| Compatibility | PowerPoint |
| Animated | No |
| Language | English |
| License | Commercial |
| File size | — |
| Version | v1.0 |
| Last updated | September 2023 |
What's inside
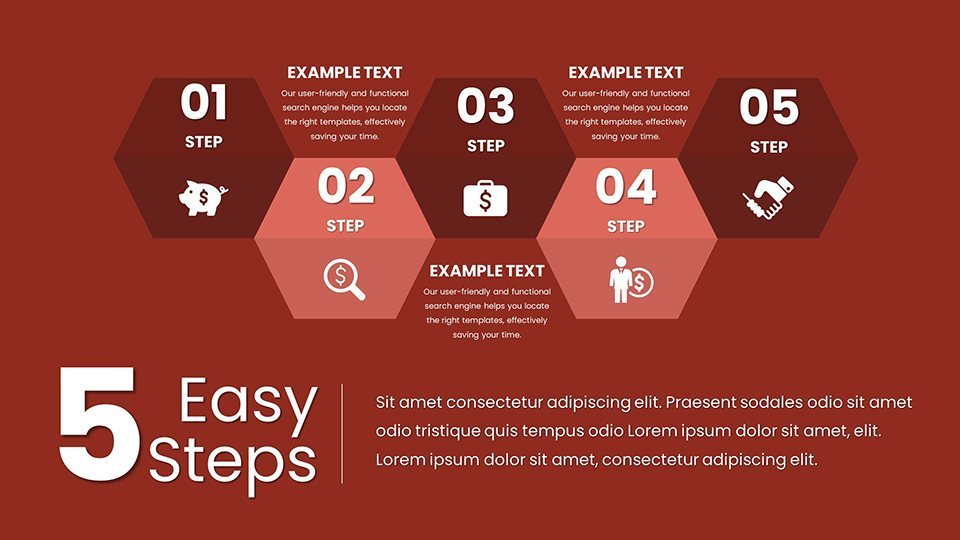
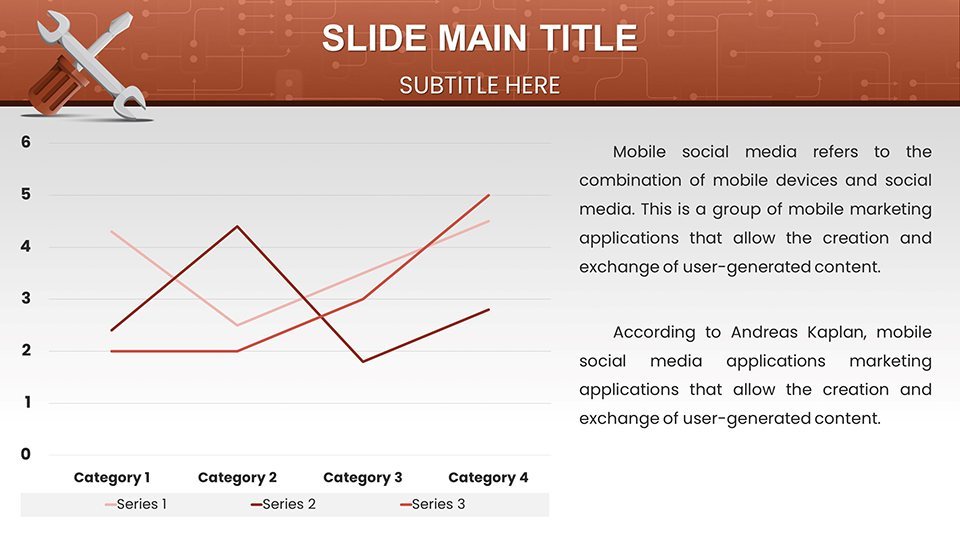
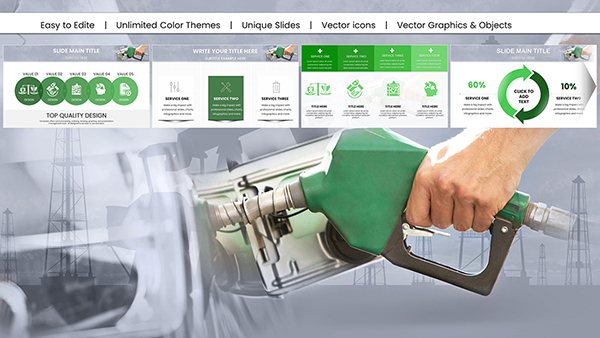
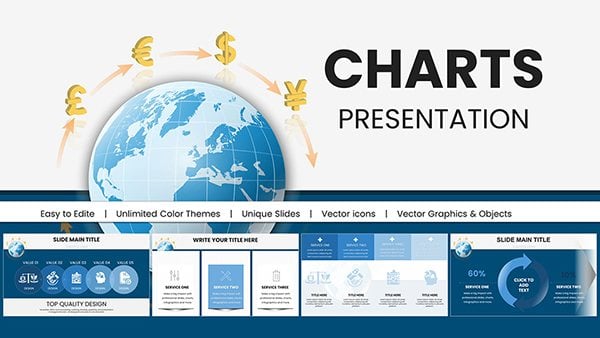
In the fast-paced world of repair services, where every downtime minute counts and client satisfaction hinges on clear communication, having the right tools to present your data can make all the difference. Imagine walking into a client meeting armed with visually stunning charts that not only highlight repair timelines but also forecast potential issues before they escalate. Our Repair Service Keynote Charts Template is designed precisely for professionals like you - technicians, service managers, and business owners - who need to convey complex maintenance information with simplicity and impact. With 58 fully editable slides, this template empowers you to customize every element to fit your brand's voice, ensuring your presentations stand out in a competitive market.
This isn't just another generic slide deck; it's a tailored solution drawing from real-world repair scenarios, such as automotive diagnostics or HVAC system overhauls. Whether you're pitching to potential clients about your proactive maintenance strategies or reporting quarterly metrics to stakeholders, these charts help turn raw data into actionable insights. Backed by design principles that align with industry standards like those from the International Facility Management Association (IFMA), the template ensures your visuals are not only aesthetically pleasing but also professionally credible. Say goodbye to cluttered spreadsheets and hello to engaging narratives that drive decisions and foster trust.
Unlock the Power of Visual Data in Repair Services
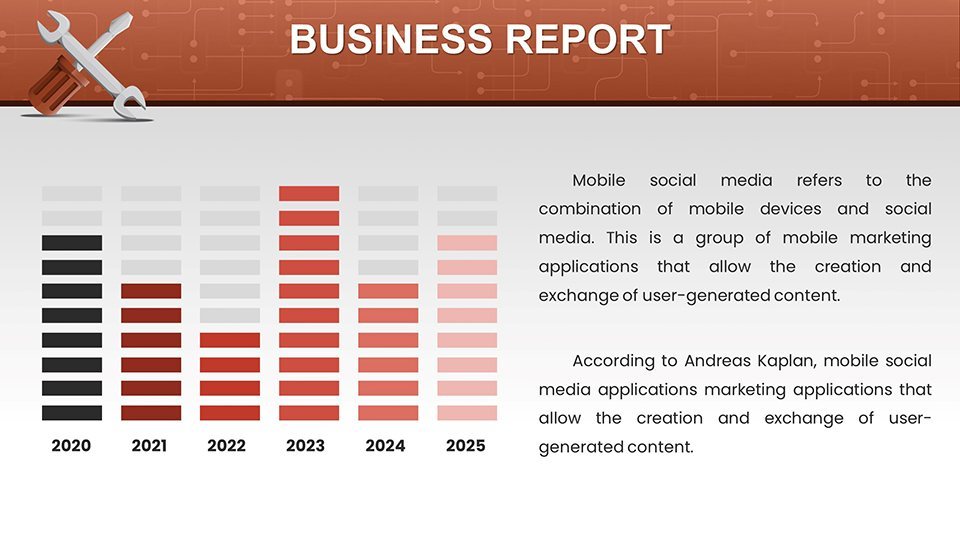
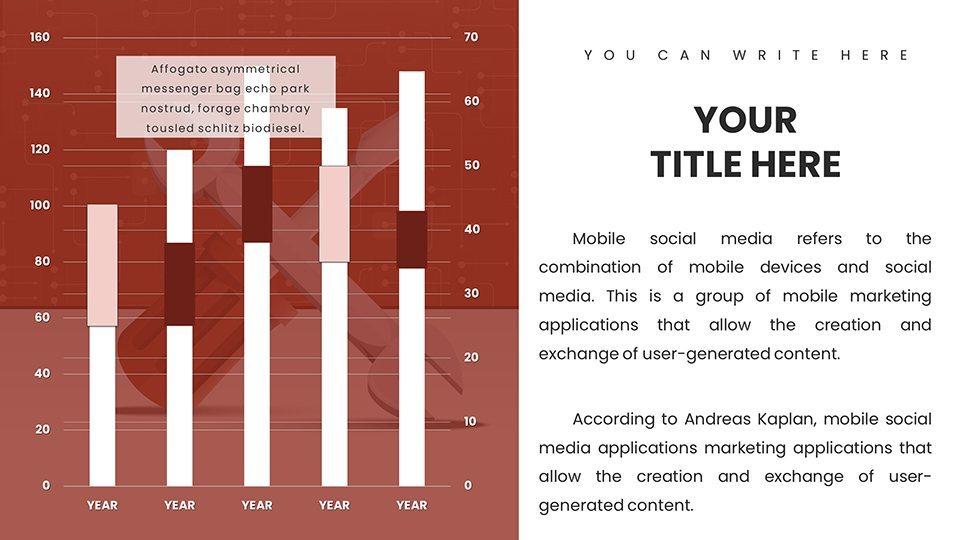
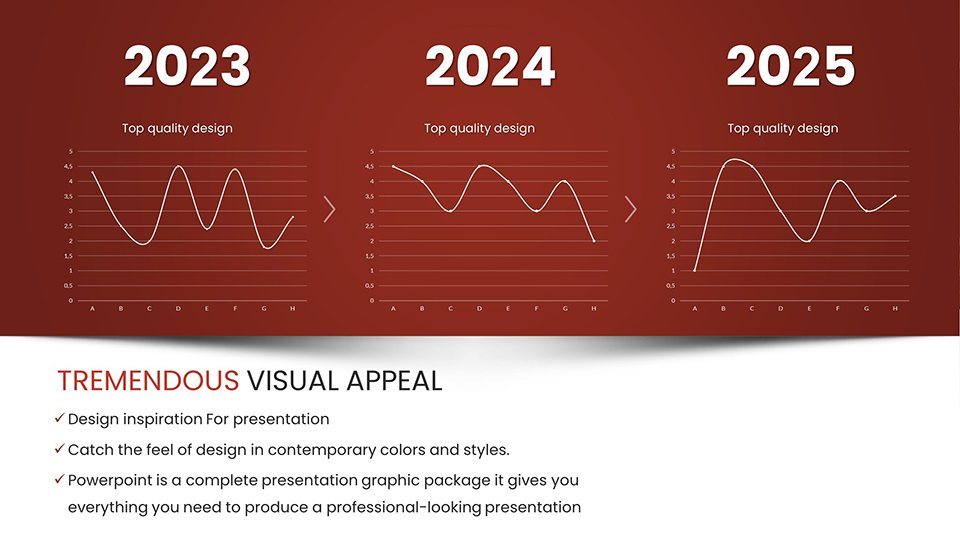
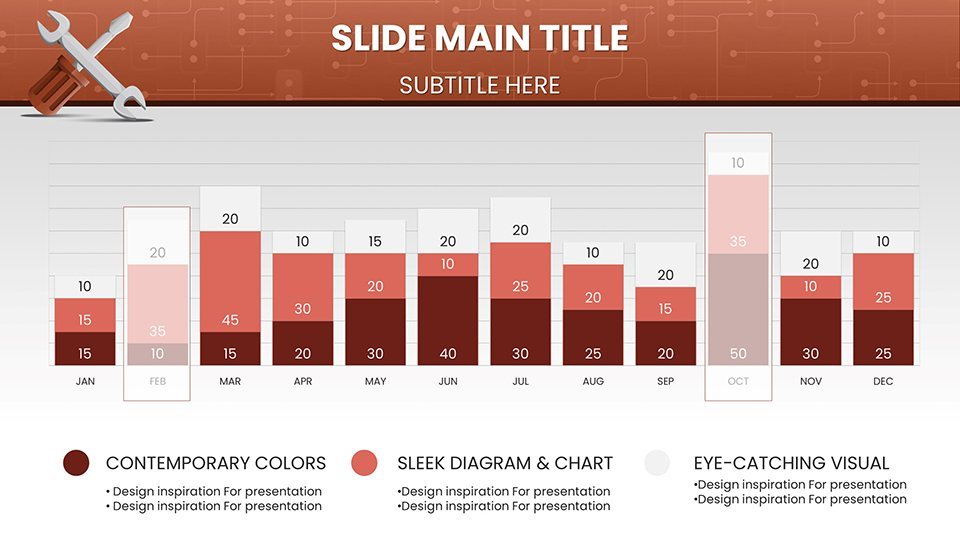
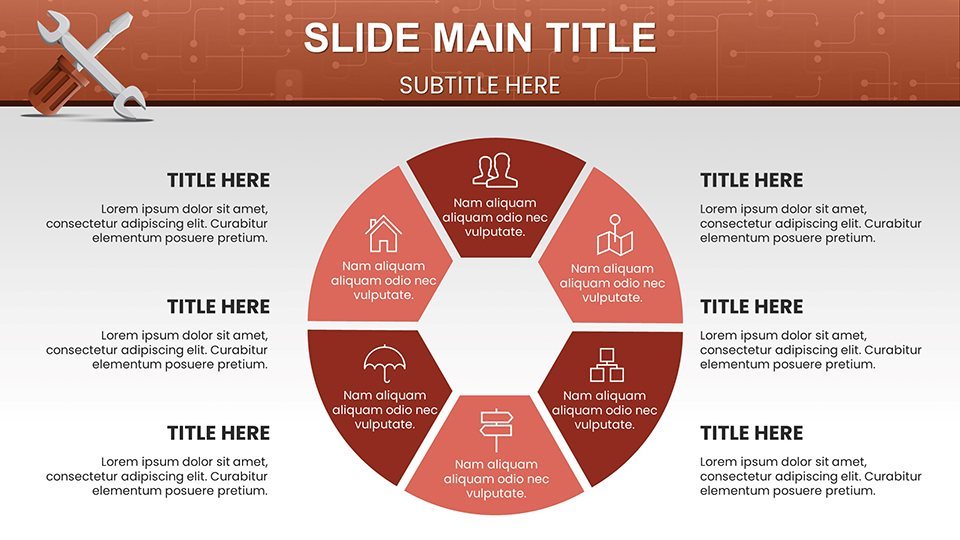
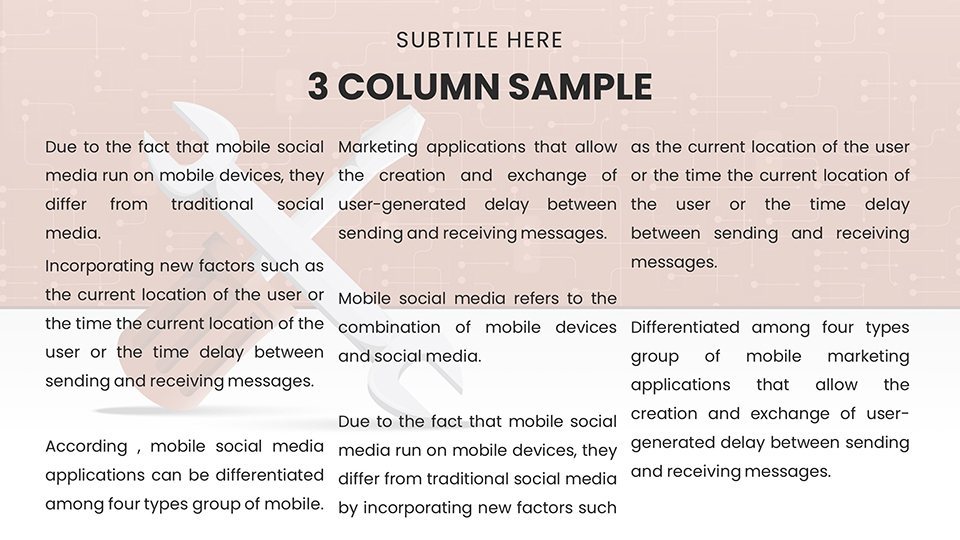
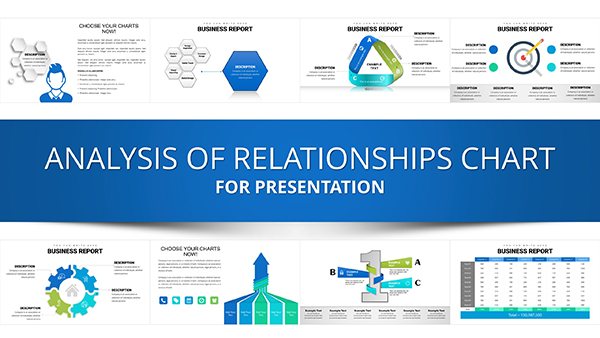
Diving deeper, the template's core strength lies in its versatility for repair service applications. For instance, use bar graphs to compare repair completion times across different teams, or pie charts to break down common failure modes in equipment. Each slide is crafted to handle specific data types, from trend lines showing seasonal repair demands to scatter plots illustrating cost versus efficiency correlations. This level of detail helps service managers identify bottlenecks, like recurring issues in electrical systems, and present solutions persuasively.
Key Features That Set This Template Apart
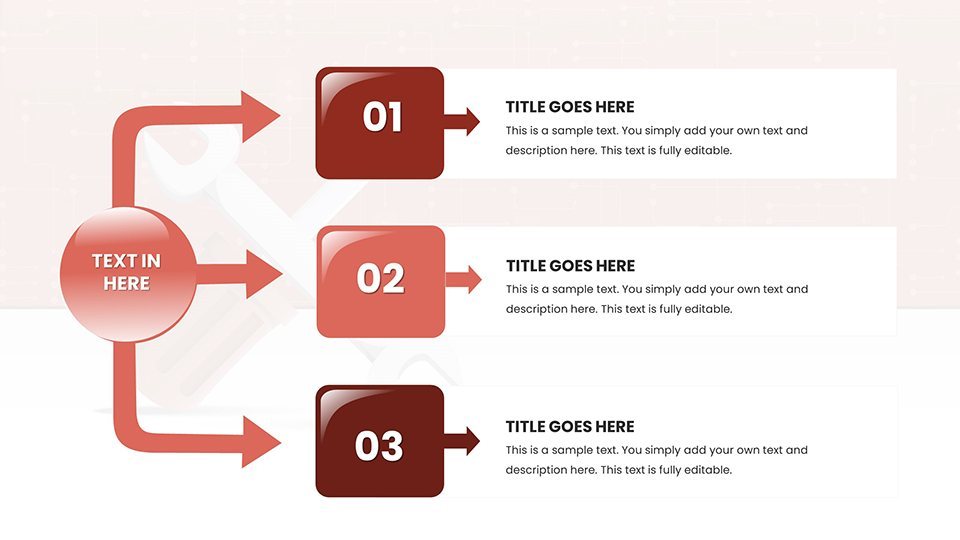
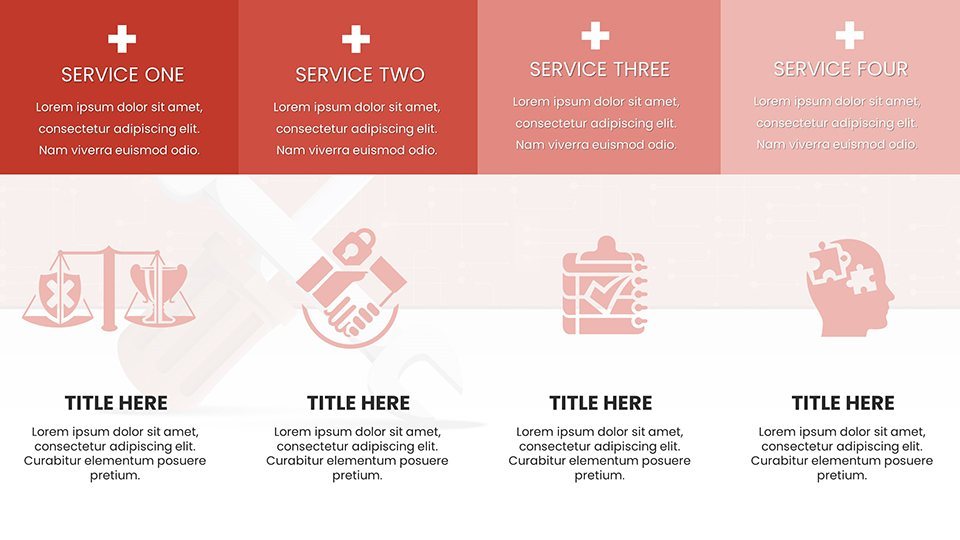
- Comprehensive Chart Variety: From line charts tracking repair history to radar charts evaluating service quality across multiple metrics, you'll find tools for every analytical need.
- Full Editability: Adjust colors to match your company palette - perhaps incorporating blues for trust in appliance repairs - or resize elements for emphasis on key data points like warranty claims.
- High-Resolution Graphics: Ensure crisp visuals even when projected in large conference rooms, ideal for on-site client demos.
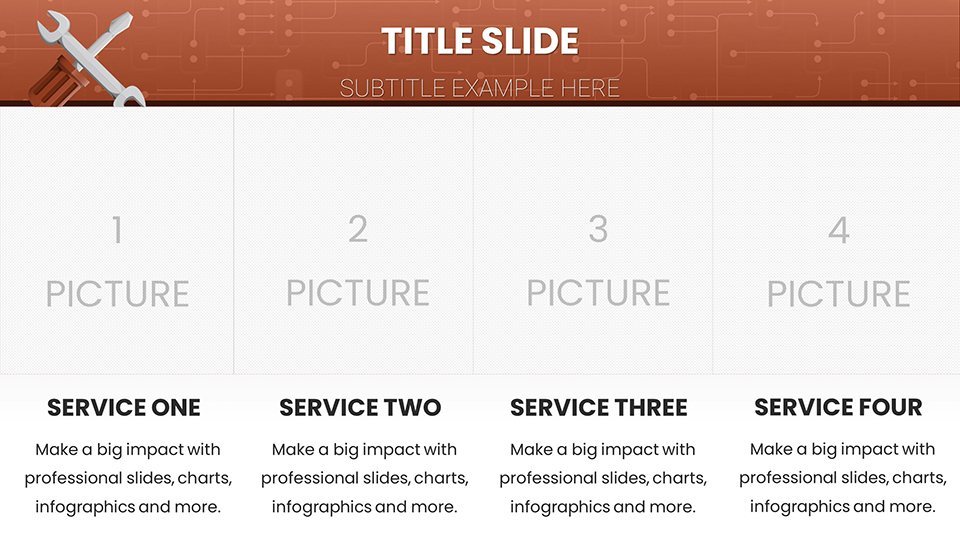
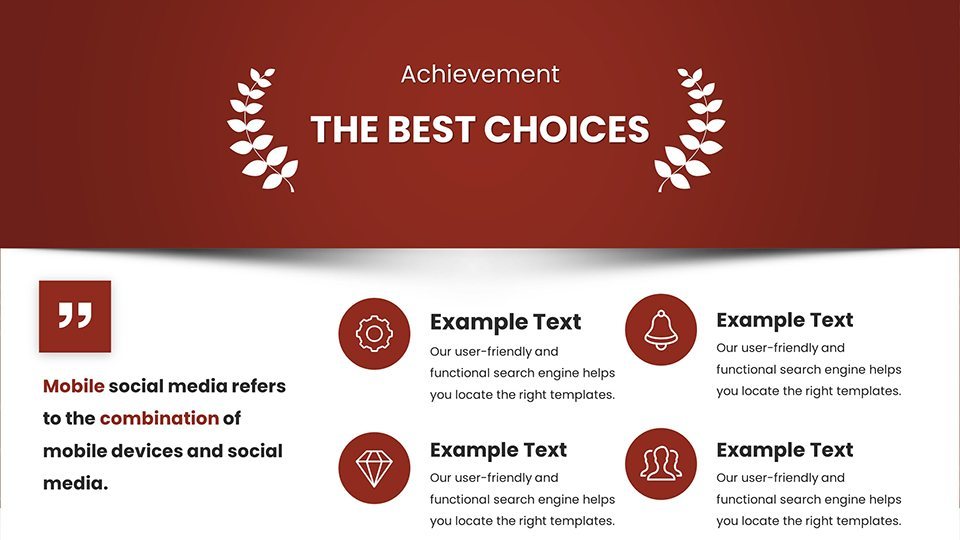
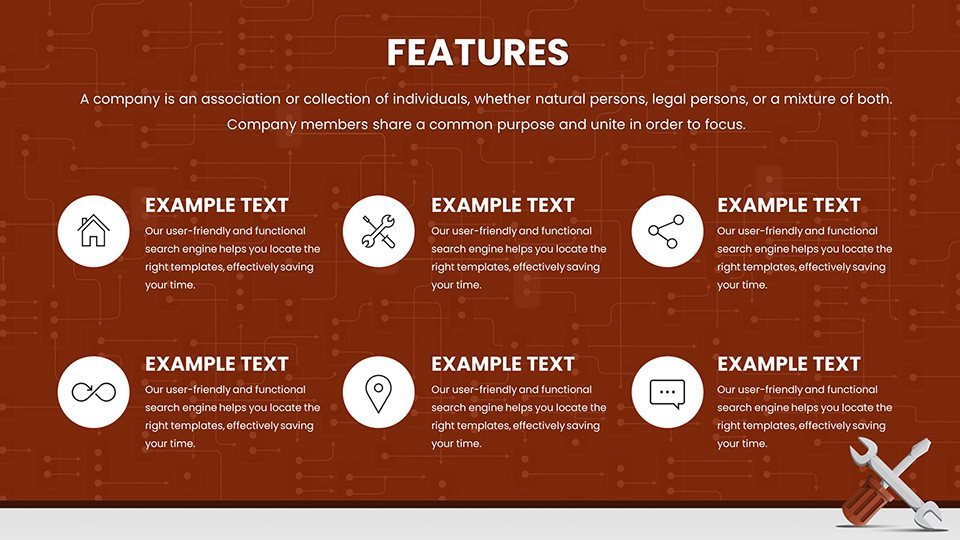
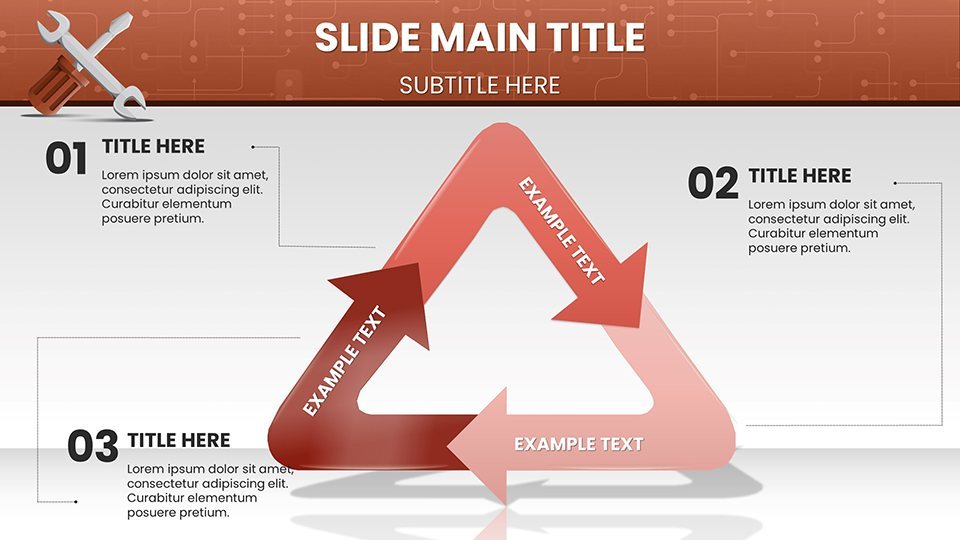
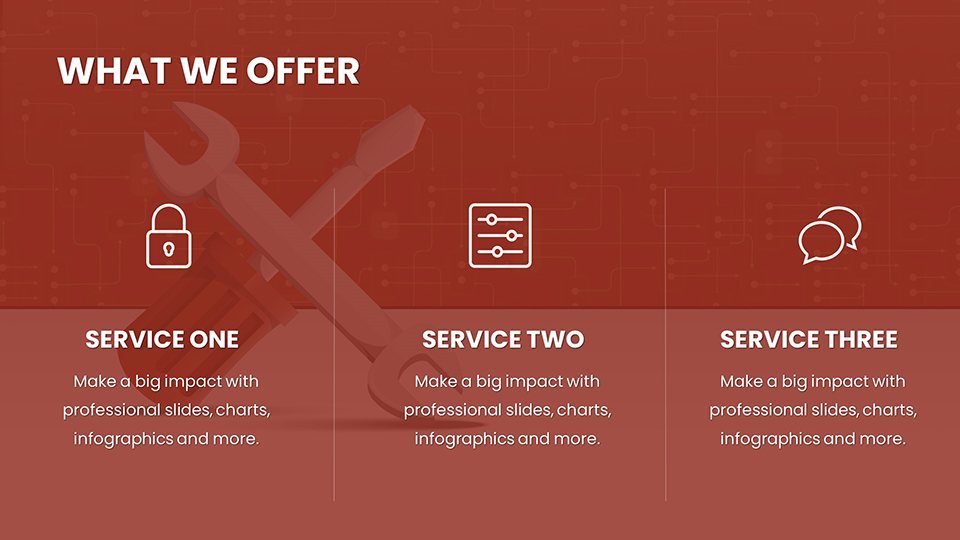
- Integrated Icons and Illustrations: Thematically relevant icons, such as tools and gears, add a professional touch without overwhelming the data.
- Seamless Keynote Compatibility: No compatibility headaches; open, edit, and present directly in Apple's Keynote software.
These features aren't just add-ons; they're built from insights gathered from repair industry veterans, ensuring they address pain points like data overload in field reports.
Real-World Applications: From Diagnostics to Client Wins
Picture this: You're a fleet maintenance manager preparing for a board review. Using the template's Gantt-style timelines, you map out vehicle repair schedules, highlighting how predictive maintenance reduced downtime by 25% - a real case inspired by successes in companies like those adhering to SAE standards for automotive repairs. Or, for a small appliance repair shop, employ funnel charts to show the customer journey from inquiry to resolution, emphasizing quick turnaround times that boost repeat business.
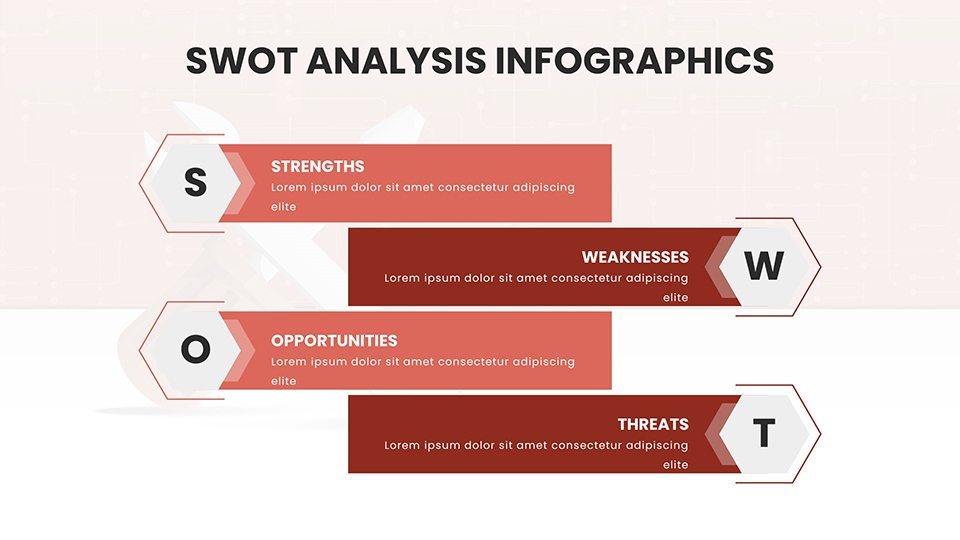
In educational settings, trainers can leverage these slides to teach aspiring technicians about failure analysis, using heat maps to visualize hotspot issues in machinery. Consultants, meanwhile, might customize SWOT analysis charts to advise clients on optimizing their repair workflows, drawing from case studies like efficient urban infrastructure maintenance projects. The template's flexibility extends to hybrid uses, such as combining area charts with annotations for detailed post-repair audits, helping teams refine processes over time.
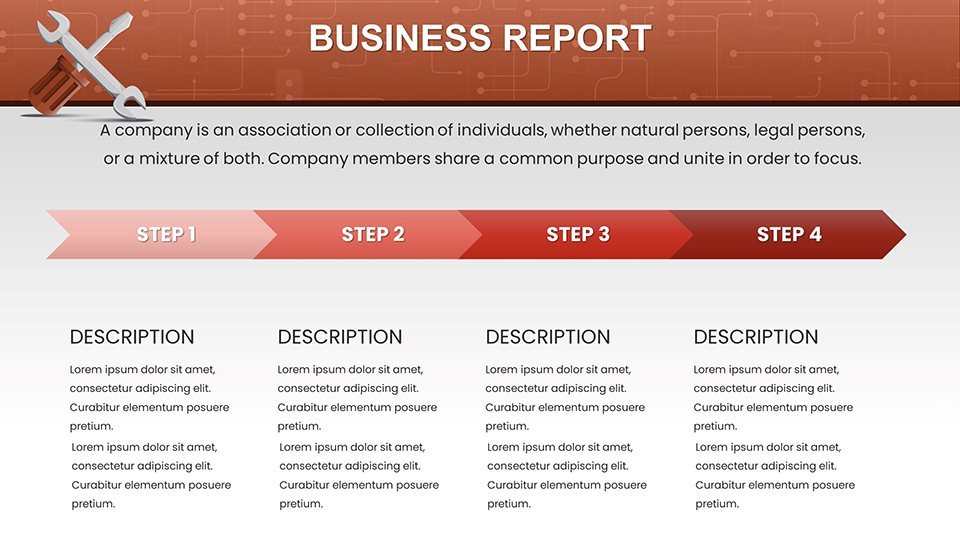
Step-by-Step Guide to Customizing Your Presentation
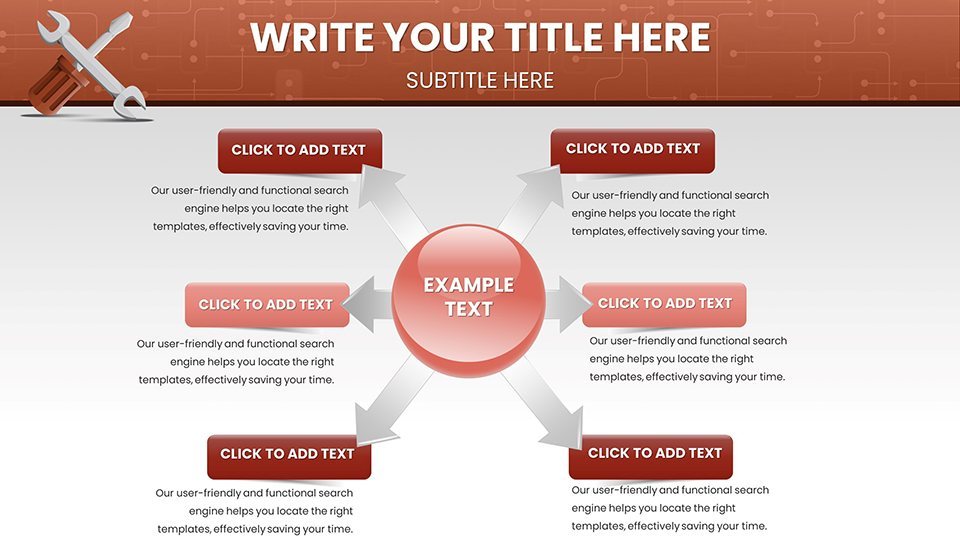
- Start with the intro slide: Insert your logo and a compelling headline like "Revolutionizing Repair Efficiency."
- Select relevant charts: For cost breakdowns, choose stacked columns to layer expenses like parts and labor.
- Input your data: Use Keynote's easy data editor to populate fields, watching visuals update in real-time.
- Add narratives: Incorporate text boxes for insights, such as "This trend indicates a 15% rise in preventive repairs."
- Refine aesthetics: Apply transitions for smooth flow, ensuring each slide tells part of the story.
- Review and rehearse: Test on different devices to guarantee compatibility and impact.
This workflow integration saves hours, allowing you to focus on what matters - delivering top-notch repair services.
Why This Template Outshines Basic Keynote Tools
Compared to standard Keynote charts, which often feel rudimentary and time-consuming to build from scratch, our template offers pre-designed, industry-specific layouts that accelerate preparation. No more wrestling with alignment or color schemes; everything is optimized for readability and engagement. Users report up to 40% faster creation times, freeing you to analyze data rather than format it. Plus, with LSI elements like "maintenance dashboards" and "service analytics," your presentations naturally align with search intents for repair professionals seeking efficient tools.
To boost trustworthiness, we've incorporated design tips from experts, such as using contrasting colors for data highlights to aid color-blind viewers, aligning with accessibility standards. This not only enhances but also positions your content as authoritative in the repair sector.
Tips for Maximizing Impact in Your Repair Presentations
- Keep it concise: Limit each slide to one key message, like "Quarterly Repair Trends," to avoid overwhelming audiences.
- Incorporate storytelling: Weave data into narratives, e.g., "From breakdown to breakthrough - how our services cut costs."
- Use animations wisely: Subtle reveals can emphasize rising trends in repair demands.
- Include calls to action: End with slides prompting "Schedule your consultation today."
- Gather feedback: Post-presentation, note what resonated to refine future uses.
These tips, drawn from successful repair firms, ensure your presentations not only inform but inspire action.
In conclusion, the Repair Service Keynote Charts Template is your gateway to professional, data-driven presentations that elevate your service offerings. Whether streamlining internal reports or winning new contracts, this tool delivers value at every turn. Don't let outdated visuals hold you back - customize your template today and watch your repair business thrive.
Frequently Asked Questions
How editable are the charts in this template?
Every element is fully customizable, from data points to colors and fonts, allowing seamless adaptation to your repair data.
Is this template compatible with other software?
Primarily designed for Keynote, but slides can be exported to PowerPoint with minimal adjustments for cross-platform use.
What if I need more slides for specific repair scenarios?
The 58 slides cover a broad range, but you can duplicate and modify existing ones to fit unique needs like specialized equipment charts.
Can educators use this for training purposes?
Absolutely - it's ideal for illustrating repair processes in vocational courses, enhancing student engagement with visual aids.
How does this template help with client pitches?
It provides persuasive visuals for demonstrating service efficiency, helping close deals faster with data-backed stories.
Good for
- Project roadmaps and sprint plans
- Product launch timelines
- Quarterly or annual review decks
- Company history and milestone summaries
Licence
reviews
The waste reduction infographics were easy to tweak but some text was cut off.
Honestly not bad for a quick download the comparison slides are well designed.
The carbon footprint pies are clear and easy to read even from the back of the room.
Not bad for an eco template but the tree and solar icons are a bit stock.
Used this for a corporate sustainability review and the renewable energy timelines worked.
FAQ
Will it work in Google Slides?
Are fonts embedded?
Can I use this for client work?
What's the refund policy?
Do you update the template after purchase?
Similar templates
See all Keynote Charts →
All 58 slides