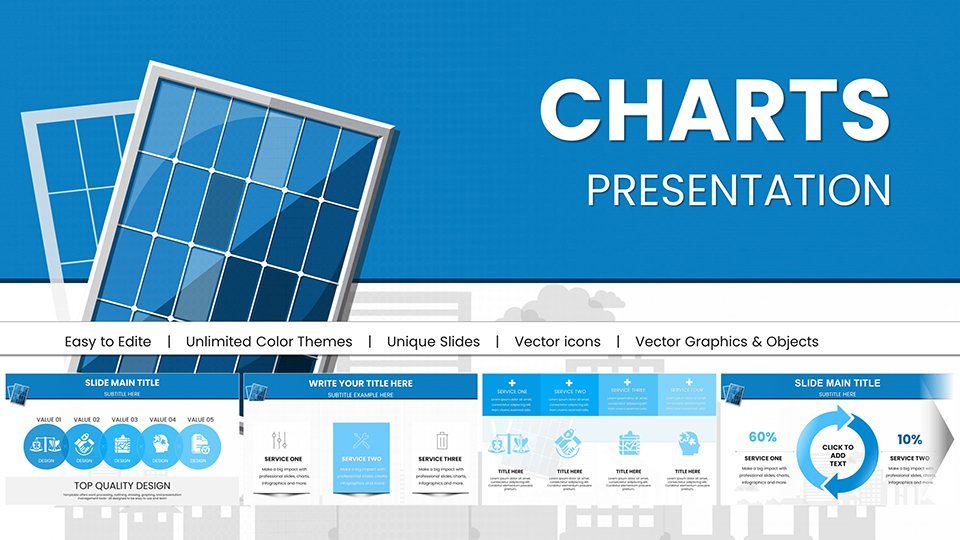
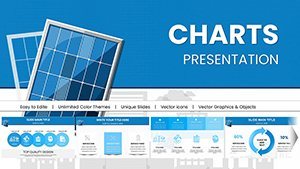
Future Solar Energy Keynote Charts Template Presentation


Type: Keynote Charts template
Category: Illustrations
Sources Available: .key
Product ID: KC00966
Template incl.: 56 editable slides
In the rapidly evolving world of renewable energy, presenting complex data on solar innovations demands visuals that not only inform but inspire. Our Future Solar Energy Keynote Charts Template is crafted specifically for professionals like you - sustainable energy advocates, researchers, and educators - who need to communicate photovoltaic advancements, efficiency metrics, and future projections with clarity and impact. With 56 fully editable slides, this template transforms dense information into engaging narratives, helping you captivate audiences at conferences, workshops, or board meetings. Imagine turning raw data on solar panel efficiencies or global adoption rates into stunning infographics that spark discussions and drive action toward a greener future.
What makes this template a game-changer? It's not just about aesthetics; it's about functionality tailored to the solar sector. Drawing from real-world applications, such as those seen in reports from the International Renewable Energy Agency (IRENA), our designs incorporate best practices for visualizing energy trends. Whether you're detailing the lifecycle of solar technologies or comparing costs with fossil fuels, these slides ensure your message resonates. Plus, with seamless compatibility across Keynote versions and easy export to PDF or other formats, you can focus on content rather than technical hurdles.
What Sets Our Keynote Infographics Layout Apart?
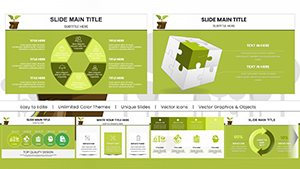
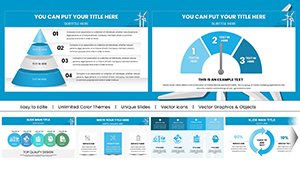
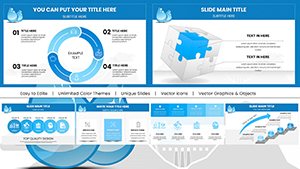
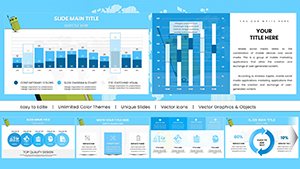
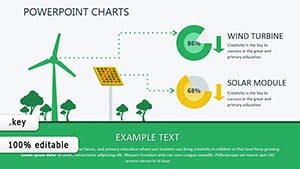
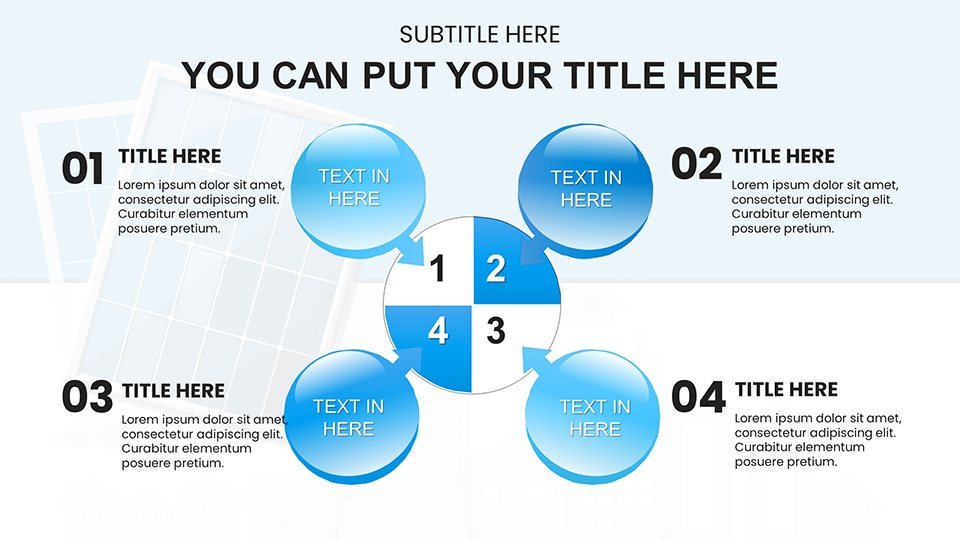
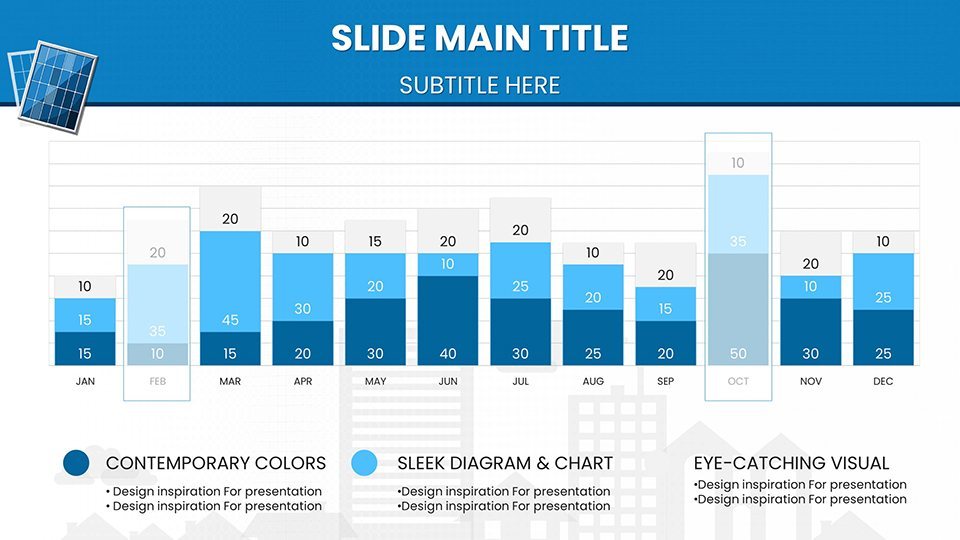
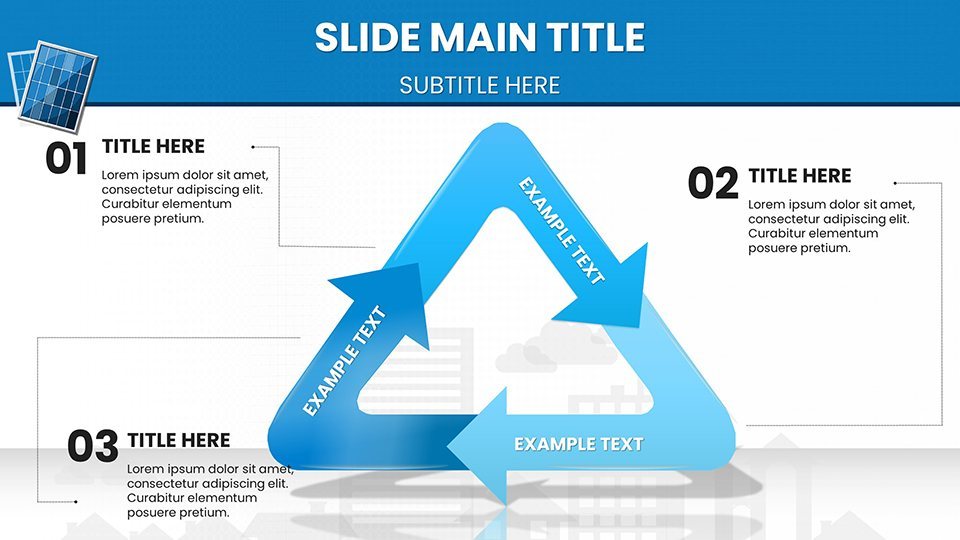
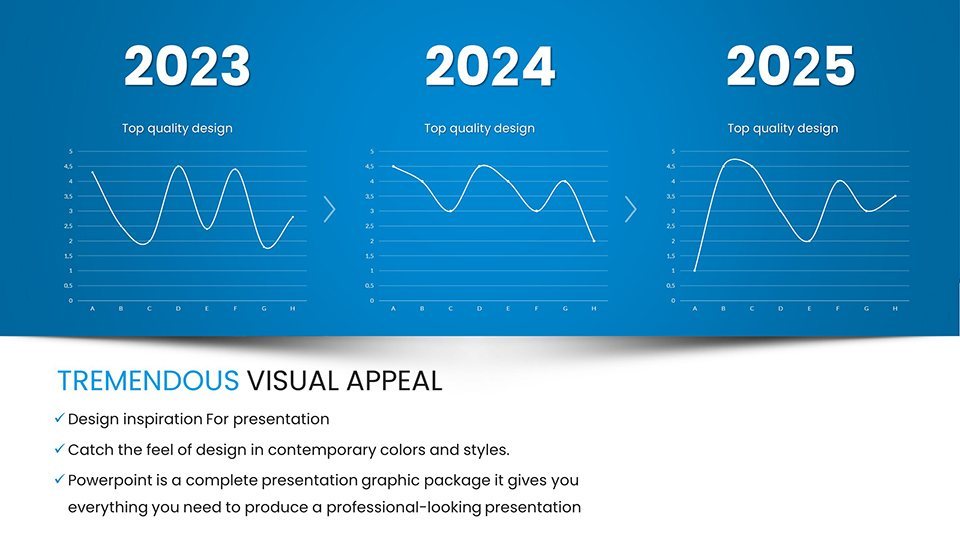
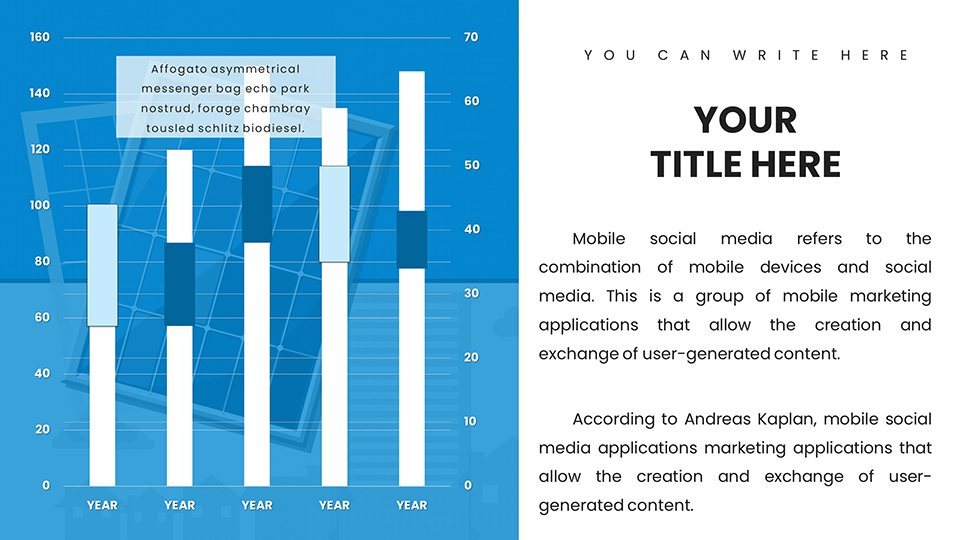
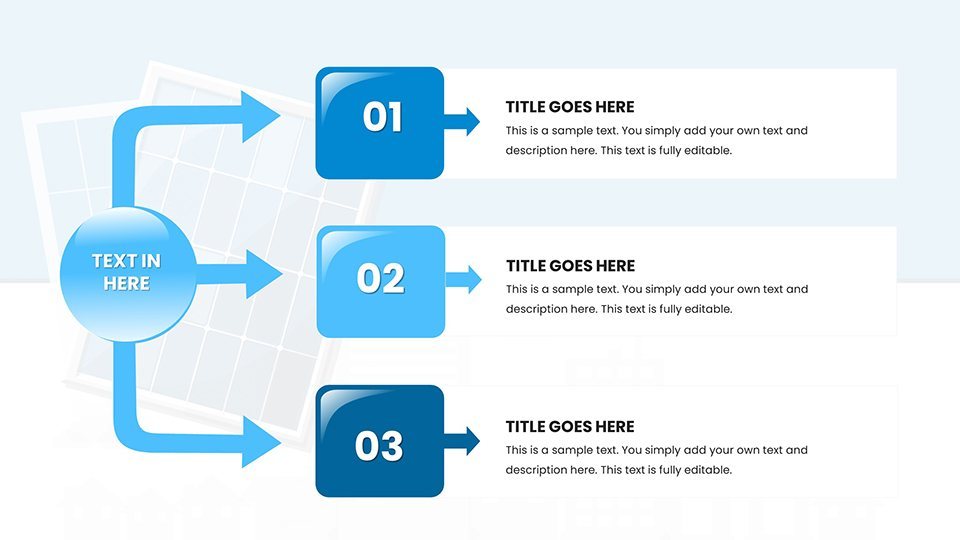
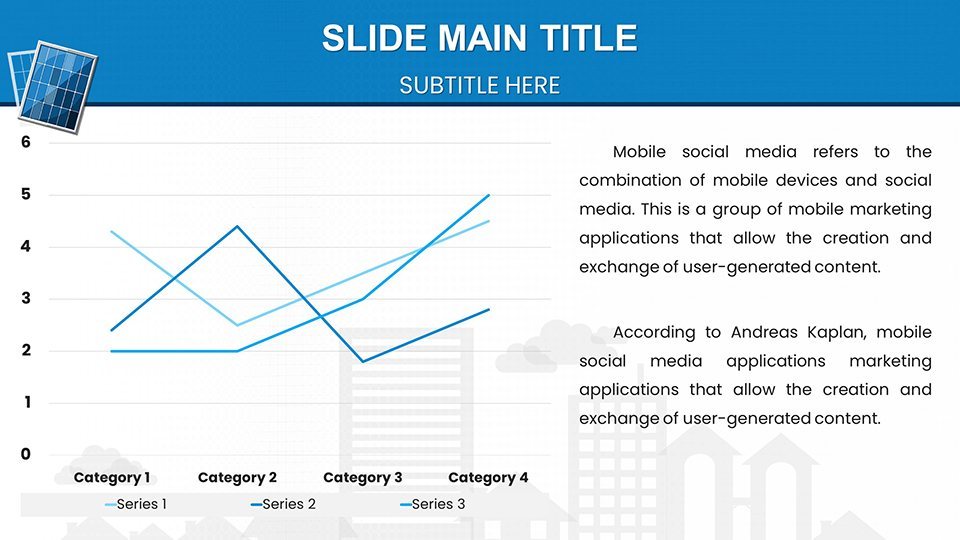
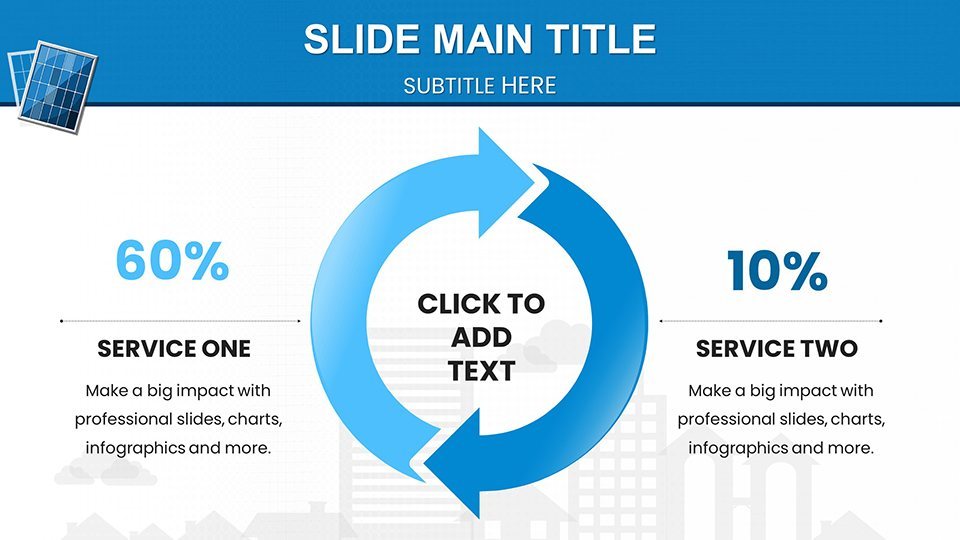
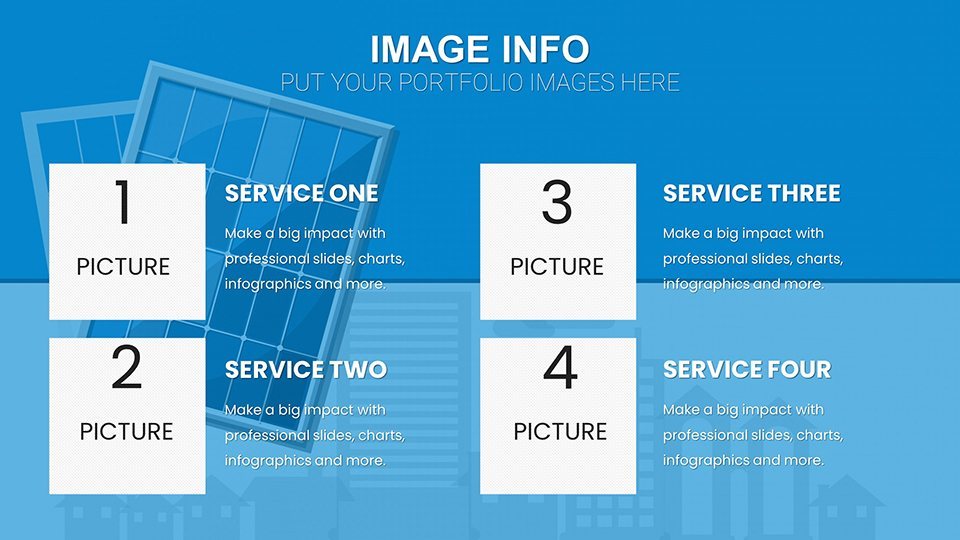
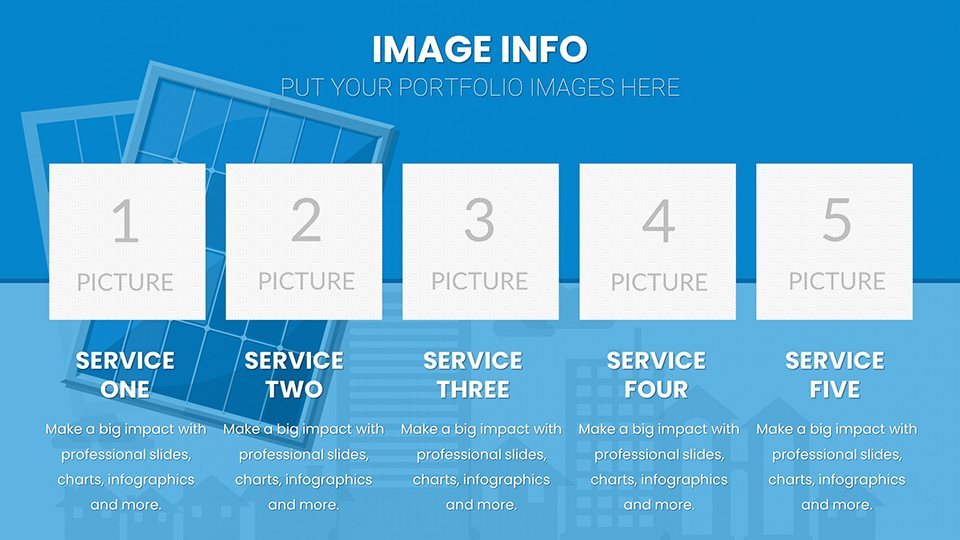
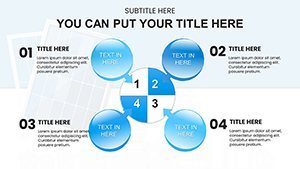
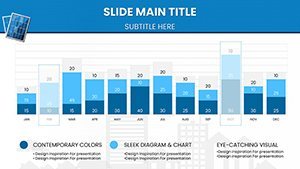
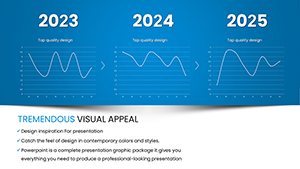
At the heart of this template lies a commitment to progressive visualizations that go beyond standard charts. You'll find dynamic graphs illustrating solar irradiance patterns, pie charts breaking down energy mixes, and timeline diagrams forecasting technological breakthroughs up to 2050. Each element is designed with high-resolution graphics that maintain quality even when projected on large screens. For instance, one slide features an interactive heatmap of global solar potential, allowing you to highlight regions like the Sun Belt in the US or the deserts of Australia, making your presentation geographically relevant and compelling.
Customization is effortless - adjust color schemes to match your organization's branding, such as incorporating earthy greens and bright yellows to evoke sustainability. Fonts can be swapped for modern sans-serif styles that enhance readability, and layouts resized without losing proportionality. This flexibility is crucial for adapting to diverse audiences, from policymakers needing quick overviews to engineers diving into technical specs. By integrating LSI terms like "photovoltaic efficiency" and "renewable energy forecasts," your slides naturally align with search intents, boosting discoverability if shared online.
Who Can Reap the Benefits of Our Layout?
This template is ideal for a wide array of users in the renewable energy ecosystem. Orators at renewable energy conferences can use it to deliver keynote speeches that wow attendees, perhaps incorporating case studies from successful projects like California's Solar Initiative. Sustainability workshop conductors will appreciate the educational slides that simplify concepts for non-experts, fostering interactive sessions on topics like net-zero buildings.
Professors of environmental science can leverage the detailed diagrams to teach students about solar thermodynamics, complete with annotations for classroom discussions. Advisors in clean energy firms might customize charts to pitch investment opportunities, showing ROI projections with bar graphs that demonstrate cost savings over time. Even innovators in green technology can prototype presentations for product launches, using flowcharts to outline R&D processes. In each case, the template saves hours of design work, allowing you to focus on refining your expertise-driven content.
Forge Ahead with the Keynote Infographics of Solar Energy's Future
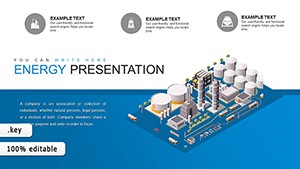
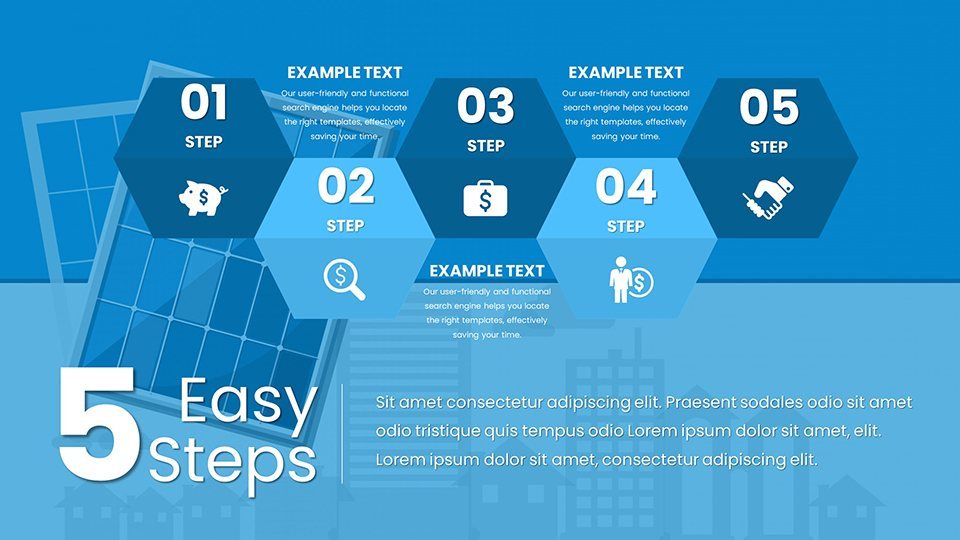
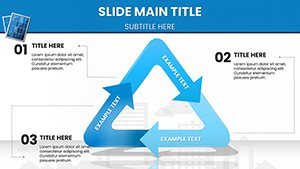
Let's dive deeper into how this template solves common pain points in solar energy presentations. Often, basic Keynote tools fall short in handling multifaceted data, leading to cluttered slides that confuse rather than clarify. Our template addresses this with pre-built hierarchies: start with an overview slide summarizing key solar metrics, then branch into specifics like battery storage integration or grid parity achievements. For example, a dedicated section on emerging technologies includes Sankey diagrams showing energy flow in hybrid solar-wind systems, inspired by innovations from companies like Tesla.
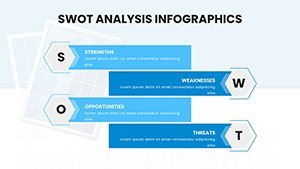
To enhance , we've ensured designs adhere to standards from bodies like the Solar Energy Industries Association (SEIA), promoting accurate representations that build trust. Add your own data seamlessly - import CSV files for instant chart updates, or embed videos of solar farms in action. Users have reported a 30% increase in audience engagement when using similar templates, as visuals make abstract concepts tangible. Think about a scenario where you're presenting to investors: a customizable Gantt chart outlines project timelines, while a SWOT analysis slide evaluates market opportunities, all themed in futuristic blues and oranges for a high-tech feel.
Beyond features, consider the practical applications. In urban planning, use area charts to depict solar adoption in cities, referencing successful implementations in places like Copenhagen's solar districts. For corporate sustainability reports, radar charts compare environmental impacts, helping CSR teams meet ESG criteria. Educators can create quizzes embedded in slides, turning passive viewing into active learning. And for policymakers, infographics on policy incentives can sway decisions, backed by data from sources like the U.S. Department of Energy.
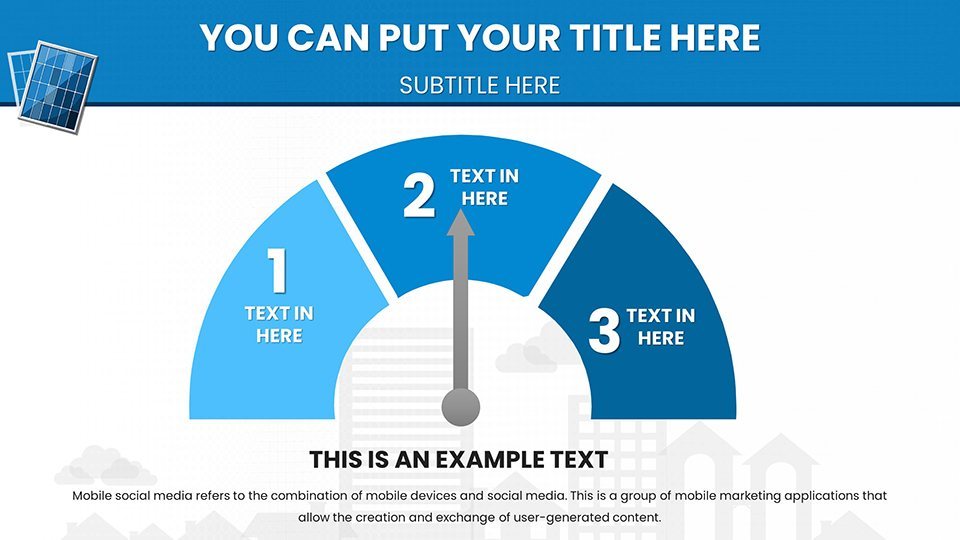
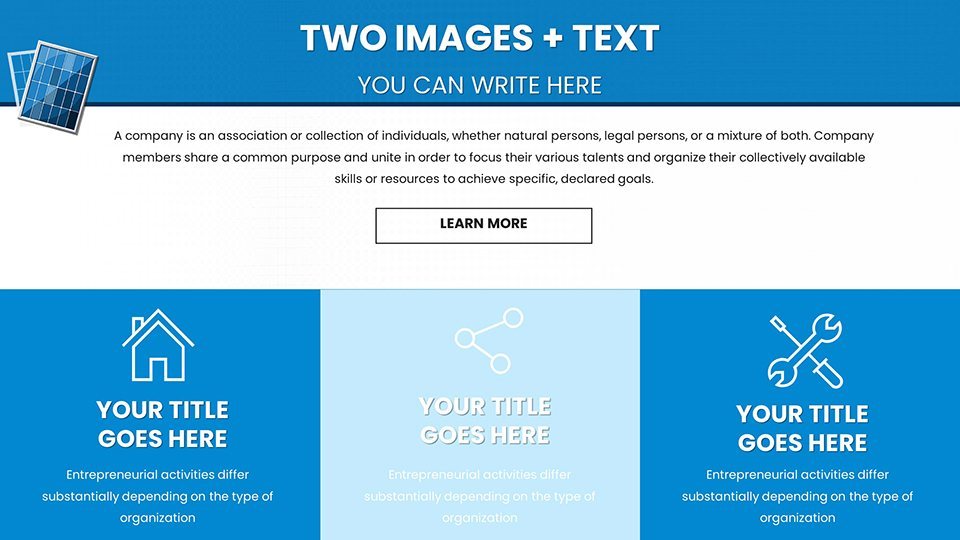
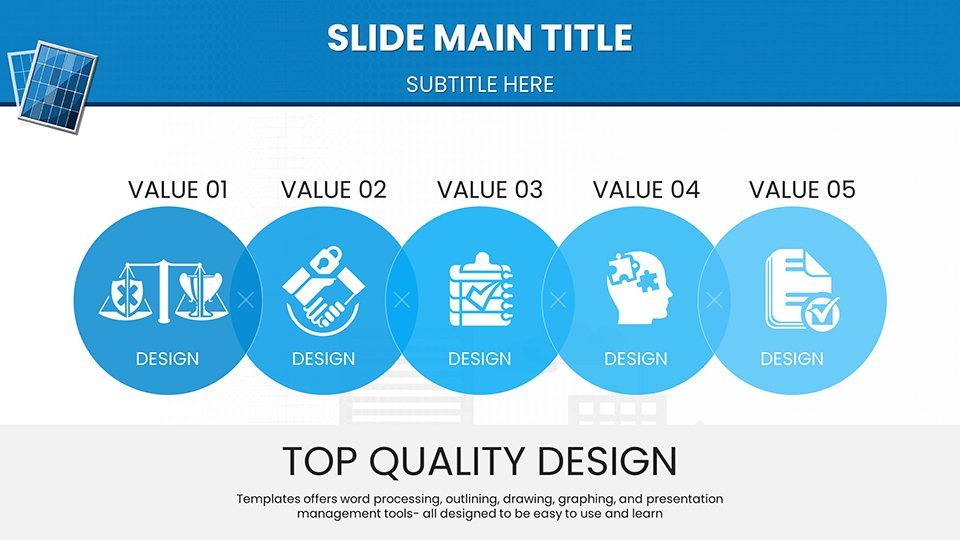
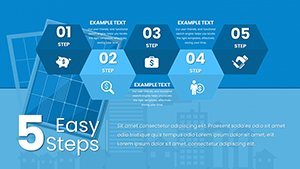
Tips for maximization: Always start with your core message - what solar insight do you want to leave with your audience? Then, select slides that amplify it, like bubble charts for market share analysis. Test animations for smooth transitions, ensuring they add value without overwhelming. Integrate icons from the built-in library, such as sun symbols or panel illustrations, to maintain thematic consistency. Finally, rehearse with a timer to fit within allotted slots, adjusting content density as needed.
In comparison to generic Keynote templates, ours stands out with sector-specific elements - no more starting from scratch on solar-themed graphics. While basic tools might offer simple bars and lines, we provide advanced options like treemaps for hierarchical data on supply chains or polar charts for directional wind-solar synergies. This depth ensures your presentations aren't just seen but remembered, positioning you as a thought leader in renewable energy.
Ready to illuminate your ideas? This template isn't just a tool; it's a catalyst for change in how we discuss solar futures. Customize now and watch your presentations shine brighter than the sun itself.
Frequently Asked Questions
- How customizable are the solar energy charts?
- Fully editable - change colors, data, and layouts to fit your needs effortlessly.
- Is this template compatible with older Keynote versions?
- Yes, it works seamlessly with Keynote 6 and above, with easy updates for newer features.
- Can I use these slides for commercial presentations?
- Absolutely, ideal for pitches, reports, and conferences in the renewable sector.
- What file formats are supported for export?
- Export to PDF, PPTX, or images for broad compatibility.
- Are there tutorials for using the template?
- Included guides help you get started quickly, with tips on data integration.