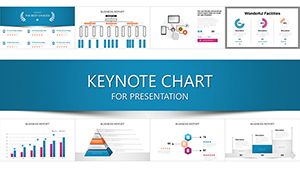
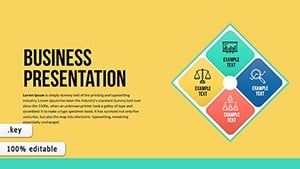
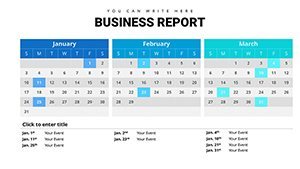
Analysis of Relationship Keynote Charts Template


Type: Keynote Charts template
Category: Relationship, Analysis
Sources Available: .key
Product ID: KC00940
Template incl.: 39 editable slides
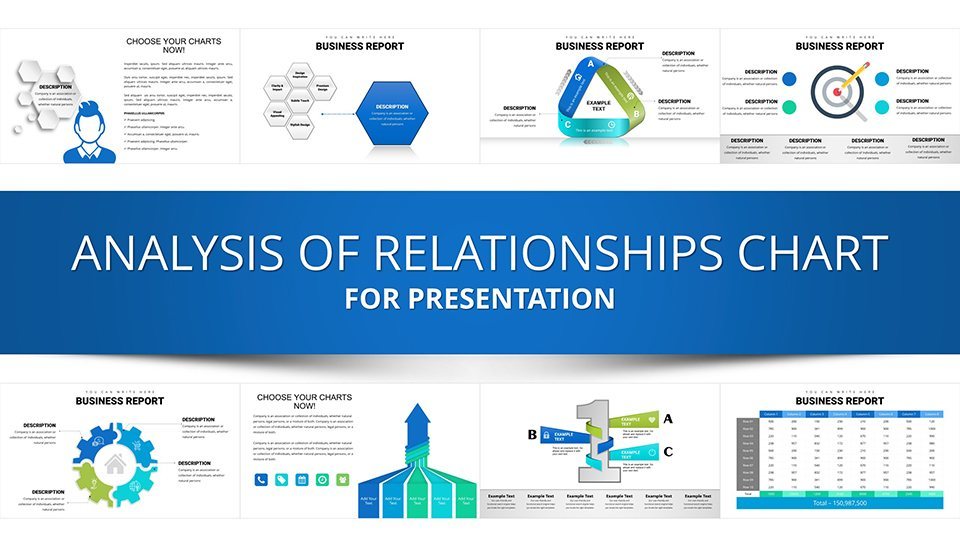
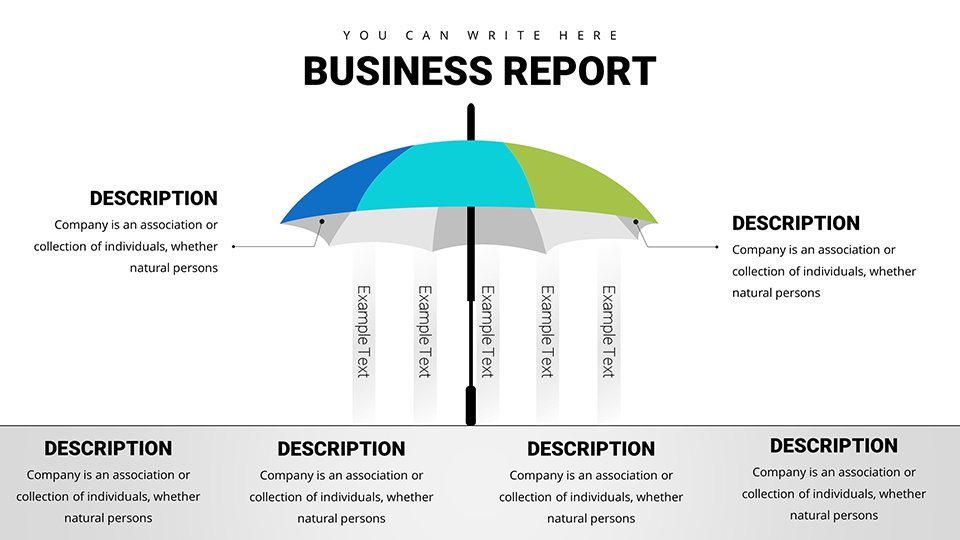
Relationships form the backbone of successful strategies in business, education, and beyond, but illustrating them effectively requires more than words. Our Analysis of Relationship Keynote Charts template, boasting 39 editable slides, is your gateway to depicting connections with clarity and elegance. Tailored for business professionals, educators, and consultants, this tool helps unravel complex interdependencies - think organizational hierarchies, stakeholder mappings, or partnership dynamics - turning abstract concepts into tangible visuals that resonate.
Inspired by network theory from sources like the Journal of Business Research, these charts promote better understanding by highlighting patterns often missed in text-heavy reports. Users in consulting firms, such as those at Bain & Company, have leveraged similar visuals to streamline client advisories, boosting comprehension by up to 50% in feedback sessions. This template addresses common pain points like overcrowded slides by offering balanced layouts that prioritize relational flow, making it ideal for pitches where every link counts.
Core Features That Illuminate Connections
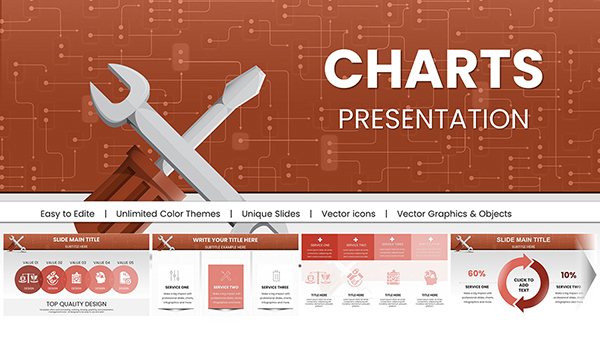
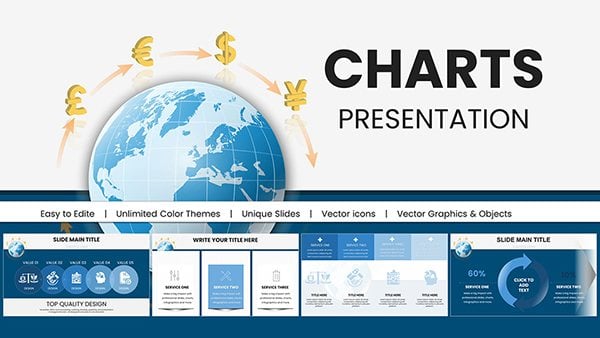
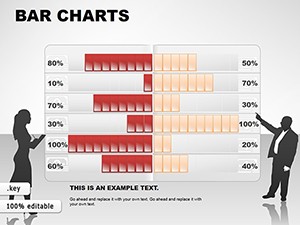
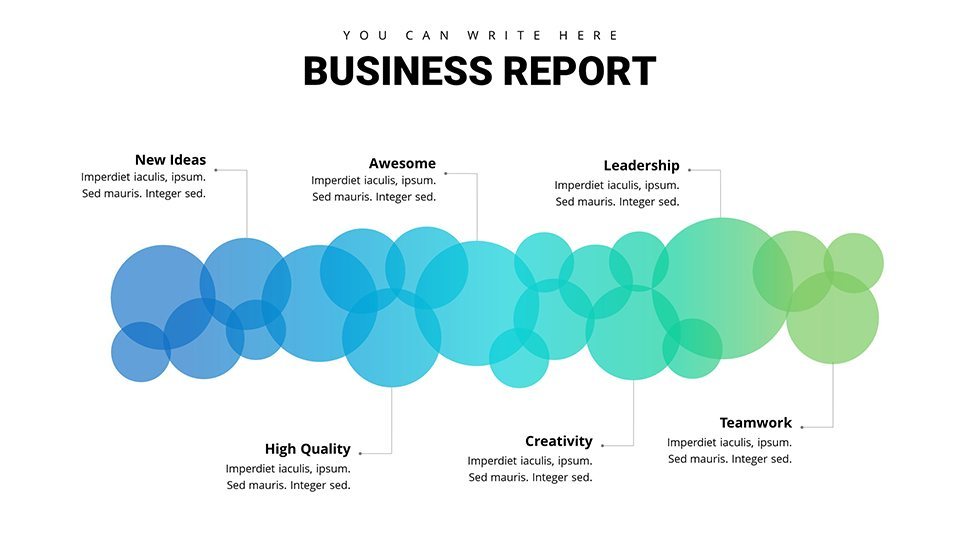
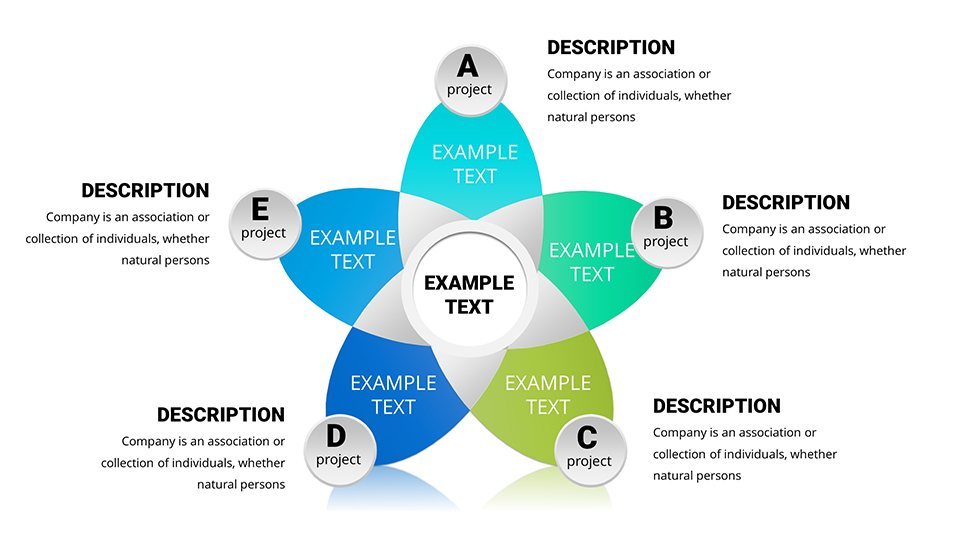
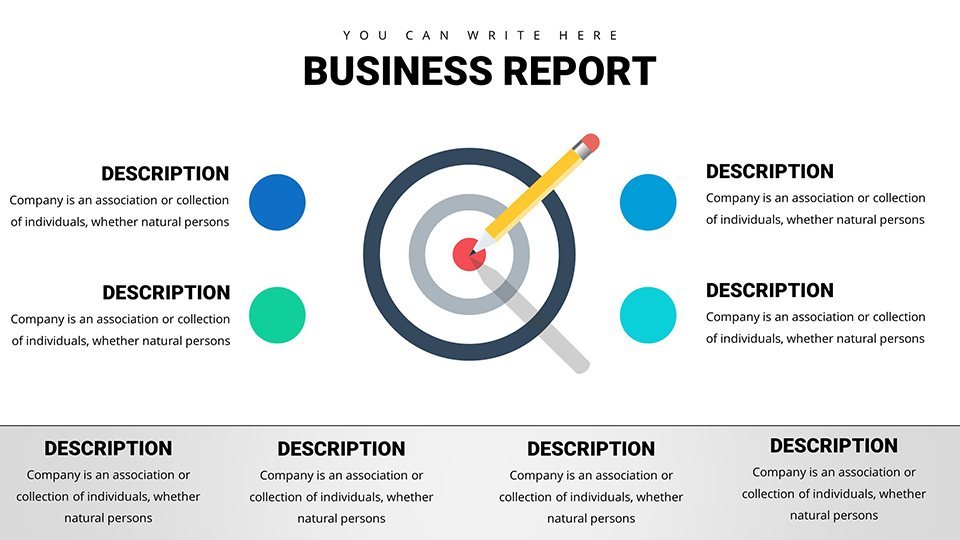
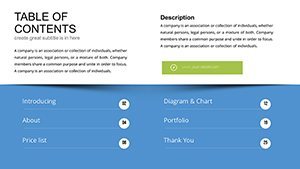
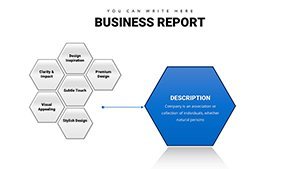
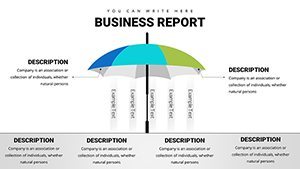
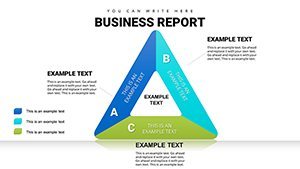
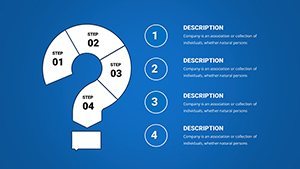
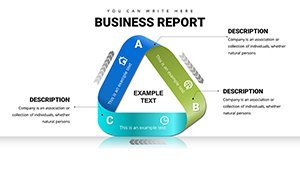
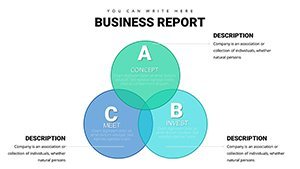
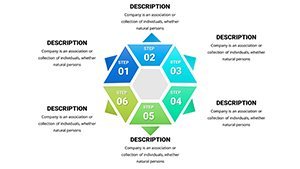
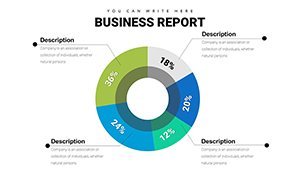
At the heart of this template are features designed to make relationship analysis intuitive. From Venn diagrams showcasing overlaps to flowcharts tracing cause-effect chains, each slide is prepped for customization, ensuring your unique data shines through.
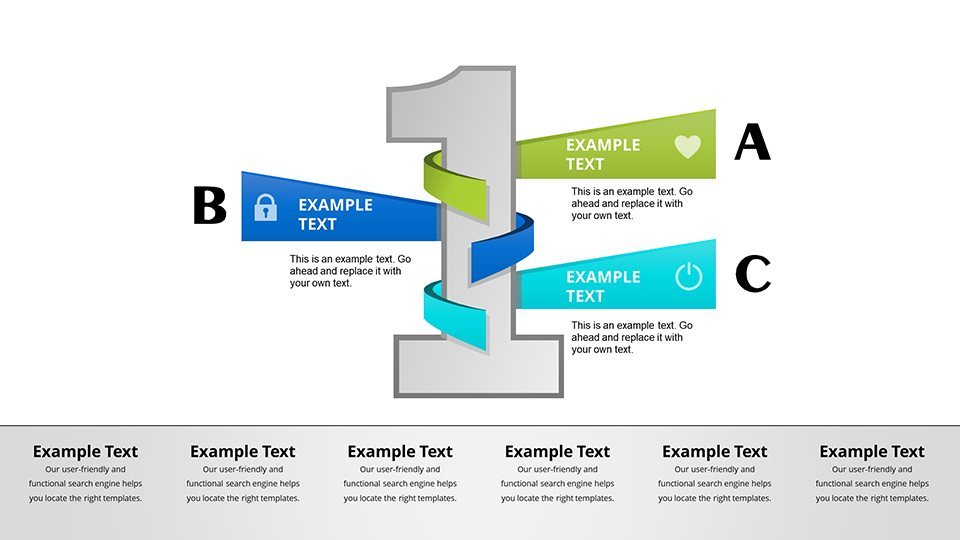
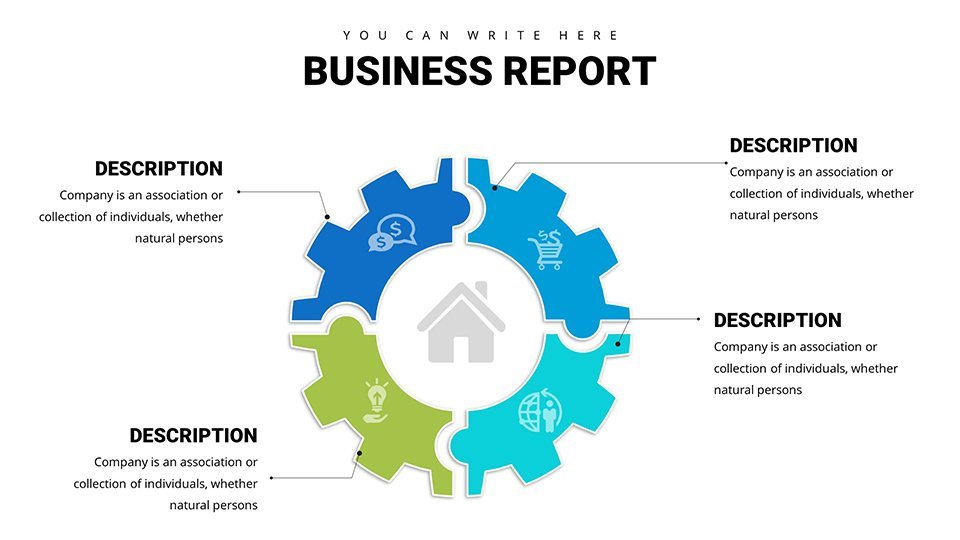
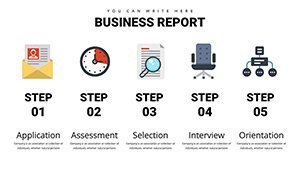
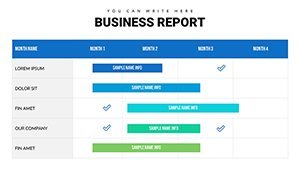
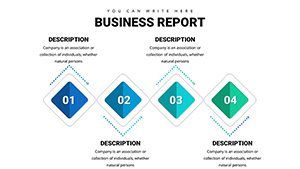
- Dynamic Chart Styles: Select from node-link diagrams or matrix views to best represent your relationships, adaptable for simple pairs or intricate webs.
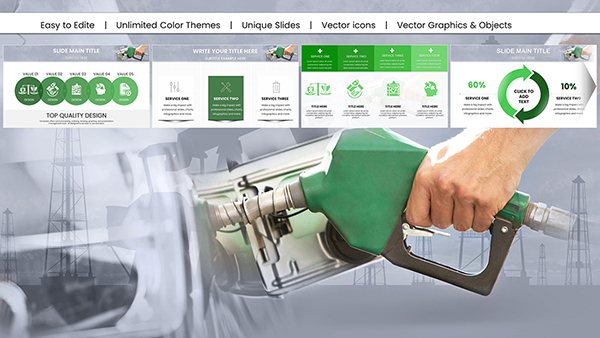
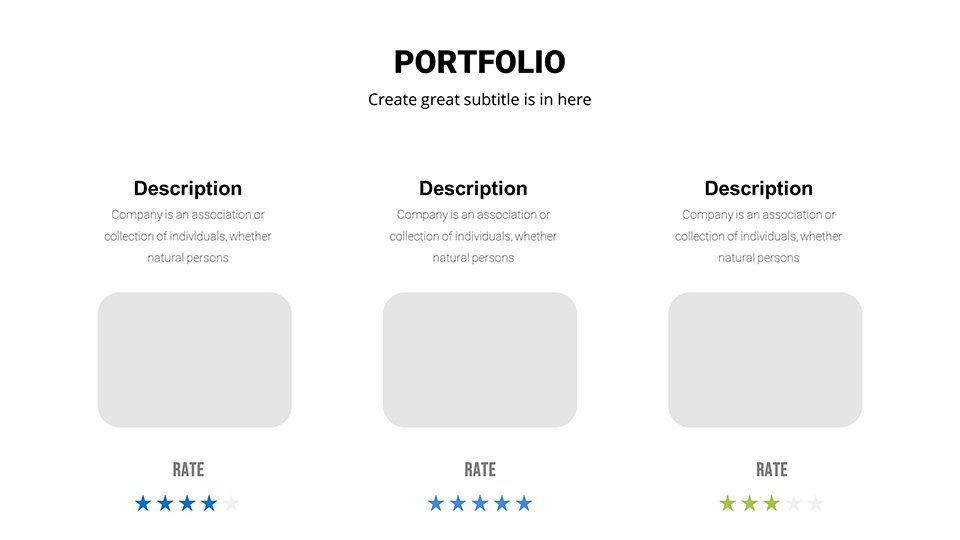
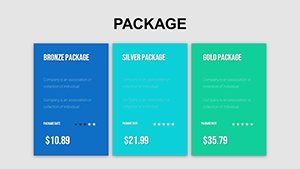
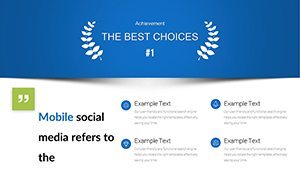
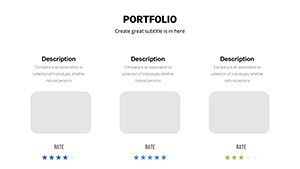
- Brand-Aligned Customization: Adjust hues, line weights, and labels to match your corporate identity, fostering a cohesive narrative.
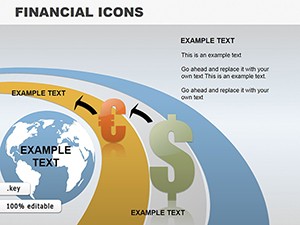
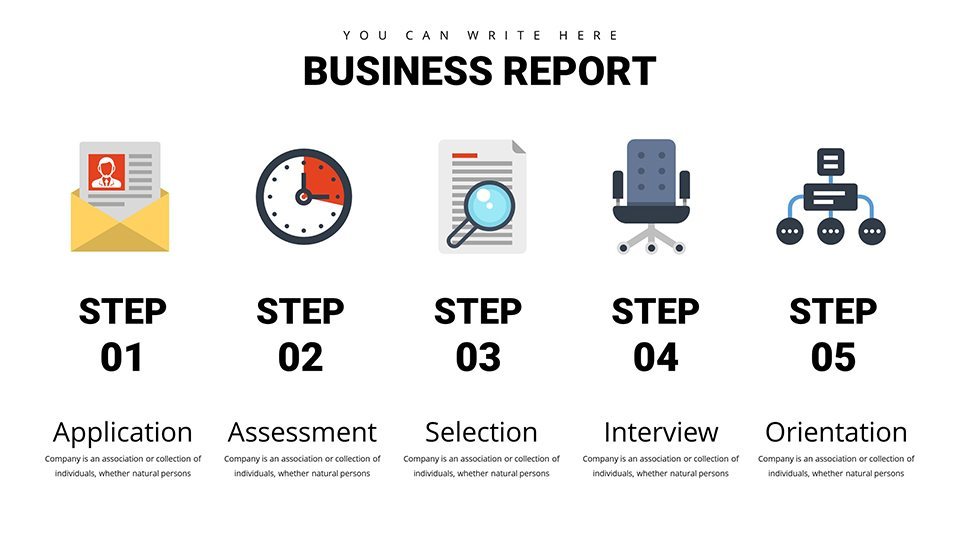
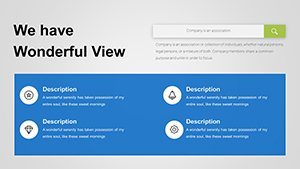
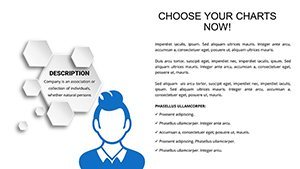
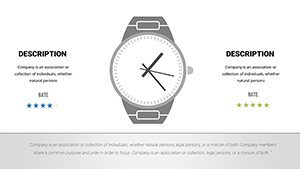
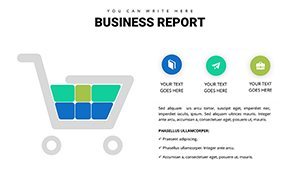
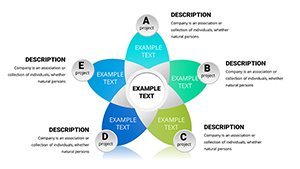
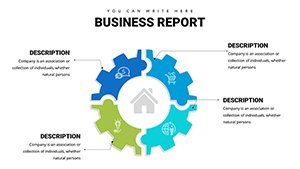
- Integrated Icons and Elements: Incorporate symbols for entities like teams or processes, enhancing visual storytelling without clutter.
- Animation Capabilities: Reveal relationships progressively with Keynote's built-in transitions, building suspense in your delivery.
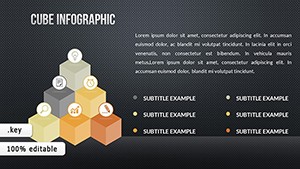
These elements empower you to create presentations that not only inform but inspire action. For example, an educator might use a sociogram slide to map classroom interactions, drawing from pedagogical studies to foster better group dynamics.
Diverse Use Cases: Bridging Ideas Across Fields
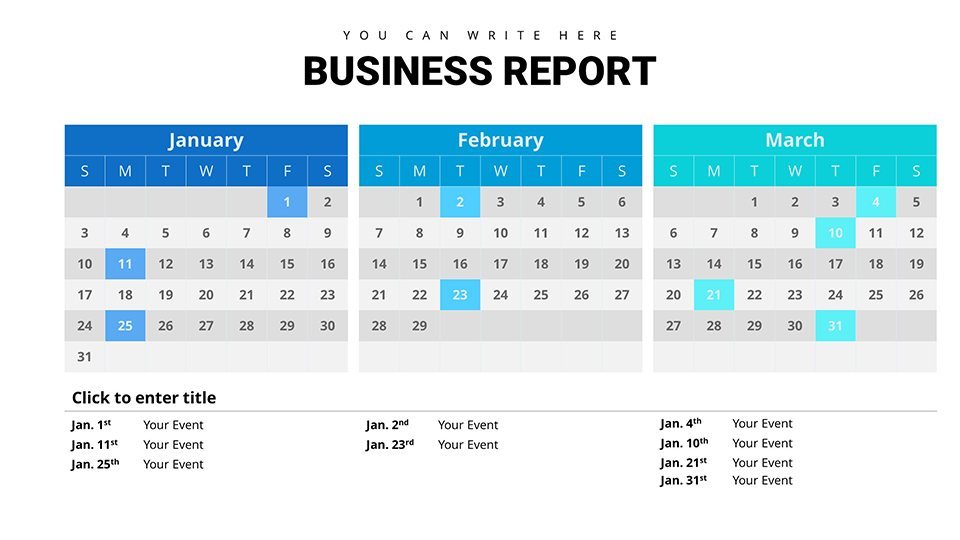
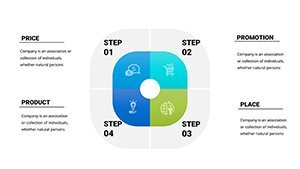
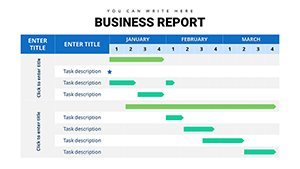
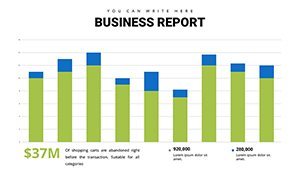
Apply this template across scenarios for maximum impact. In business reports, employ hierarchy charts to outline team structures, clarifying roles and improving onboarding as seen in HR best practices from SHRM. Academics can visualize theoretical models, like ecosystem relationships in environmental studies, making lectures more interactive.
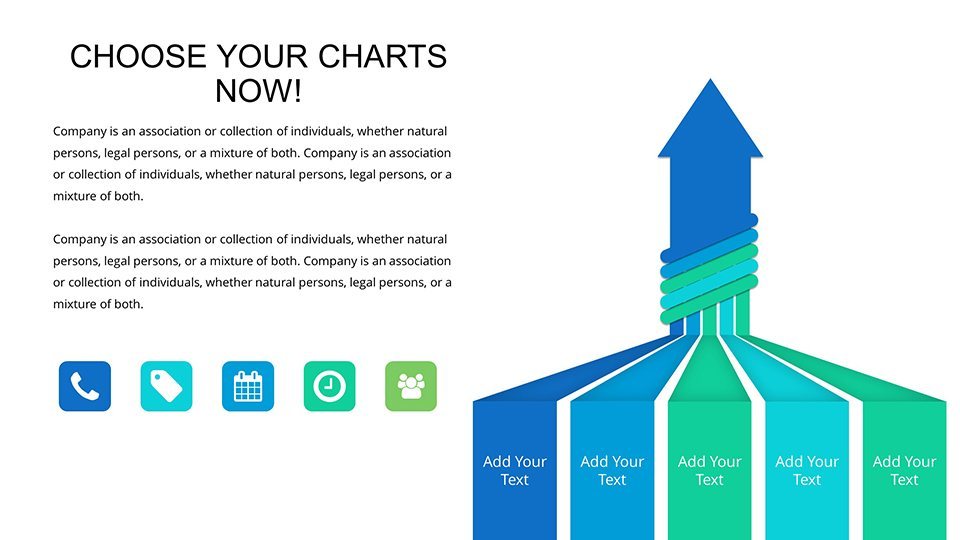
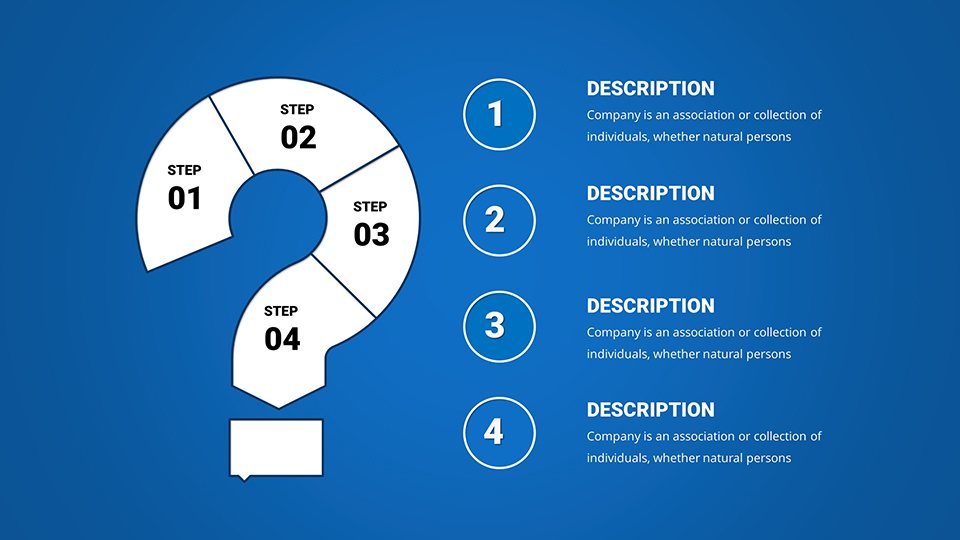
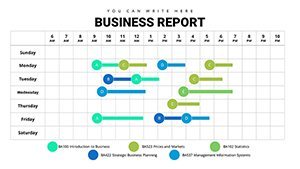
For project analyses, use dependency graphs to highlight task interconnections, akin to tools in PMI's project management framework, helping teams anticipate delays. Step-by-step: Identify key entities, map their links, populate with data, and refine visuals for emphasis.
- Begin with a blank relationship chart slide.
- Add nodes for each element and connect with arrows denoting strength or type.
- Customize aesthetics to highlight critical paths.
- Test in presentation mode for smooth flow.
Versus standard Keynote options, this template provides specialized relational tools that reduce design time, per UX research from Forrester, allowing deeper focus on insights. Integrate with mind-mapping software for hybrid workflows, expanding its utility in collaborative settings.
Tips for Mastering Relational Visuals
To excel, maintain simplicity - limit nodes per slide to avoid overload, as advised by visualization gurus. Use color coding for categories, ensuring accessibility, and add tooltips for deeper dives during Q&A.
In a real case, a consultant mapped client-supplier relationships, uncovering efficiencies that saved 15% in costs, echoing successes in supply chain optimizations from MIT Sloan.
The Edge in Relational Storytelling
This template stands out with its focus on relational depth, including advanced options like force-directed graphs for organic layouts. Value lies in its ability to foster discussions, building authority through clear, evidence-based visuals.
For industries like marketing, adapt to customer journey maps, informed by Gartner insights. CTAs vary: Dive into relationships - download now. Or, connect your data dots today. Transform insights - customize immediately.
Ultimately, this Keynote resource redefines how you present interconnections, driving better outcomes in every interaction.
Frequently Asked Questions
What types of relationships can I visualize?From hierarchical to correlational, the template supports diverse formats like networks and matrices.
Does it work with iPad Keynote?Yes, fully compatible for on-the-go editing and presenting.
Are animations pre-set?Basic ones are included, but you can modify for custom reveals.
Can I export to other formats?Easily export to PDF or PowerPoint for broader sharing.
How do I handle large datasets?Use layered slides or zoom features to manage complexity without overwhelming viewers.
Is support available for customization?Our download includes tips, and community forums offer additional guidance.