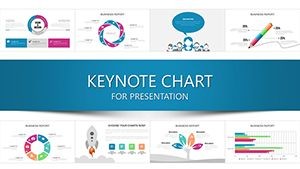
Illuminate Trends: Mastering Marketing Research with Keynote Charts


Type: Keynote Charts template
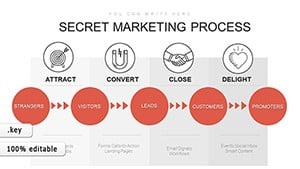
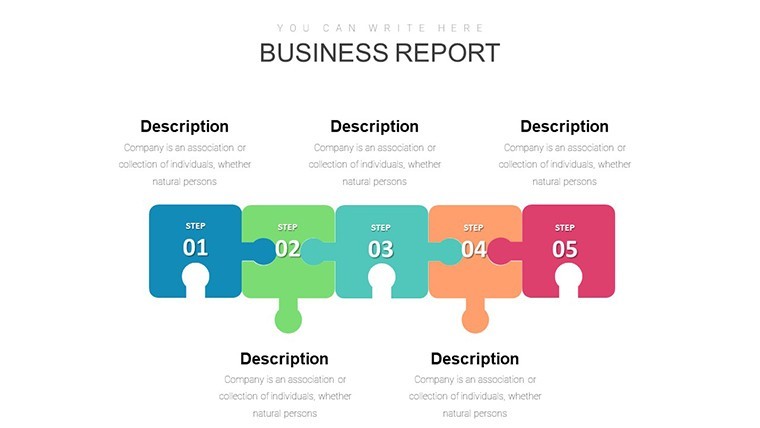
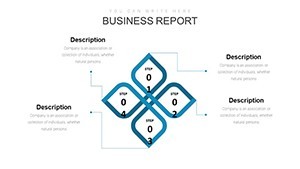
Category: Process
Sources Available: .key
Product ID: KC00928
Template incl.: 43 editable slides
Step into the vibrant world of market dynamics, where every data point is a clue to untapped opportunities. The Marketing Research Keynote Charts template, boasting 43 meticulously editable slides, is your beacon for navigating this terrain. Geared toward savvy marketers and strategists, it crafts presentations that don't just report findings - they ignite strategies, from dissecting consumer behaviors to forecasting competitive shifts. Exclusively for Keynote, it harnesses the platform's elegance to deliver fluid, engaging visuals that captivate audiences at trade shows, board meetings, or client pitches.
Addressing the commercial hunger for tools that blend analysis with persuasion, this template fills gaps in standard software by offering industry-tuned charts - like sentiment heatmaps for social listening or cohort analyses for retention modeling. Inspired by frameworks from Nielsen and Forrester, it empowers users to translate raw research into actionable narratives, boosting campaign ROIs by up to 40% as seen in case studies from digital agencies. Forget pixelated imports; these vector masterpieces ensure scalability and polish, adaptable across sectors from fintech to fashion.
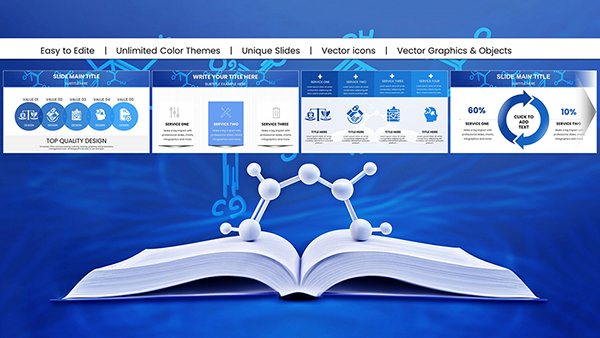
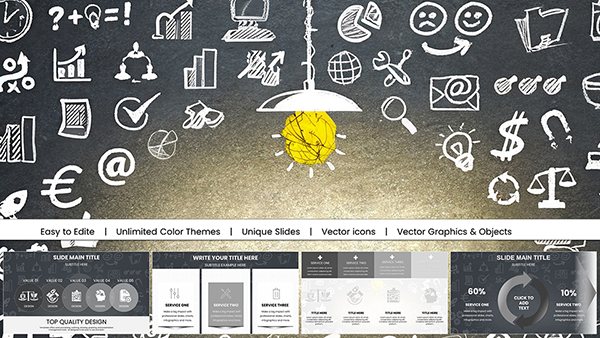
With customization at its core, swap datasets seamlessly and layer in brand elements for a cohesive look. Whether you're unveiling quarterly insights or pitching a rebrand, this template turns complexity into clarity. Join us as we unpack its features, applications, and the magic it brings to your research rituals.
Core Features: The Arsenal for Insightful Presentations
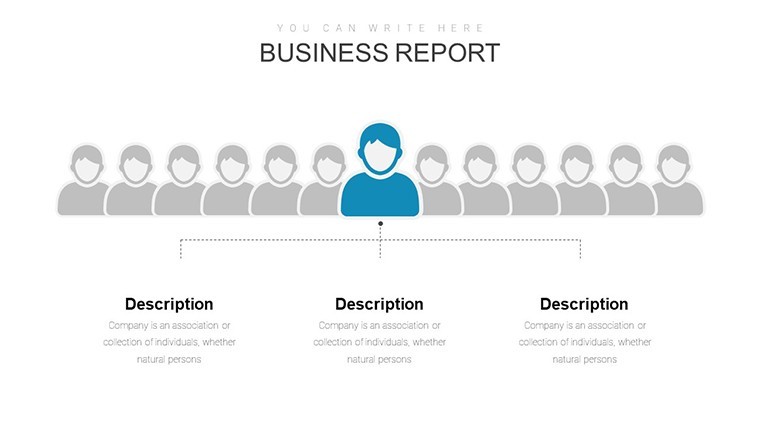
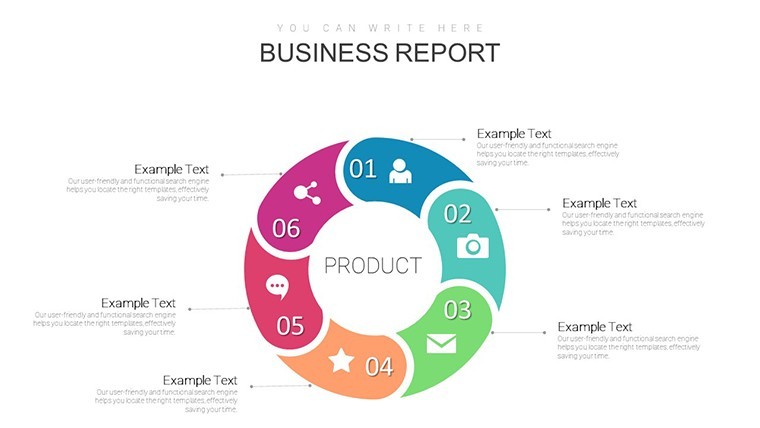
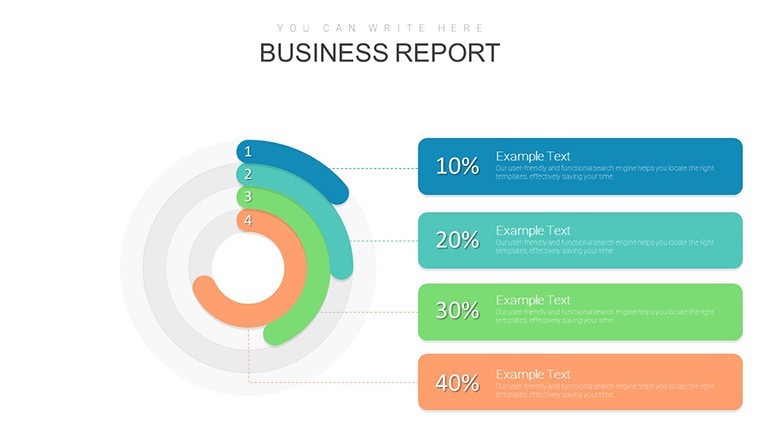
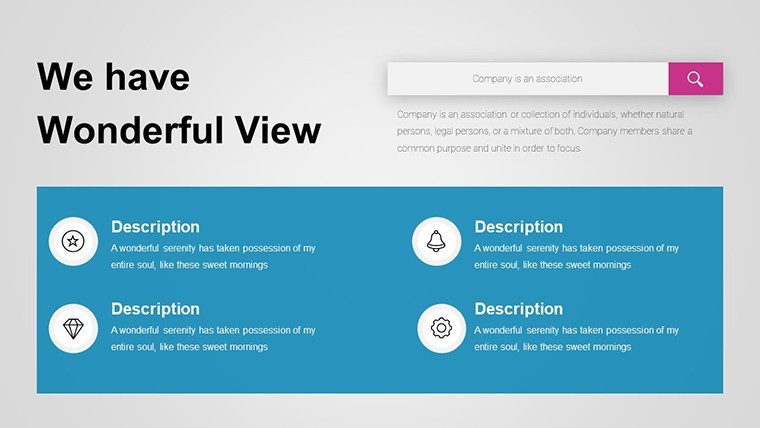
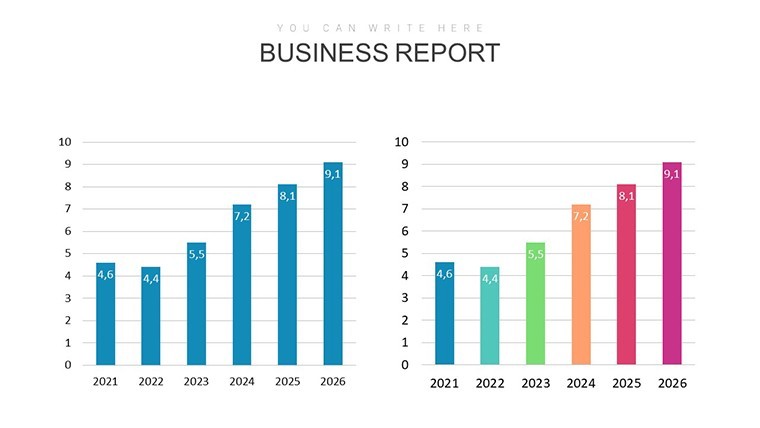
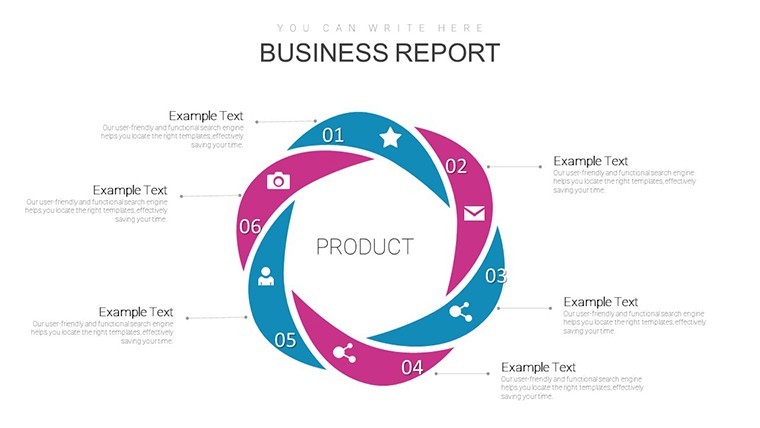
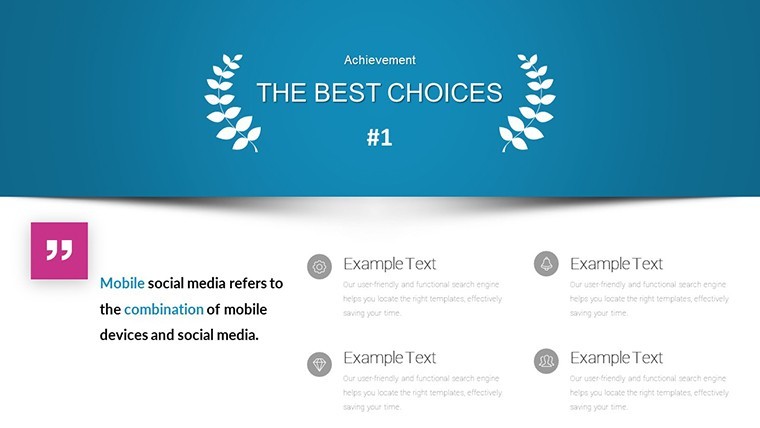
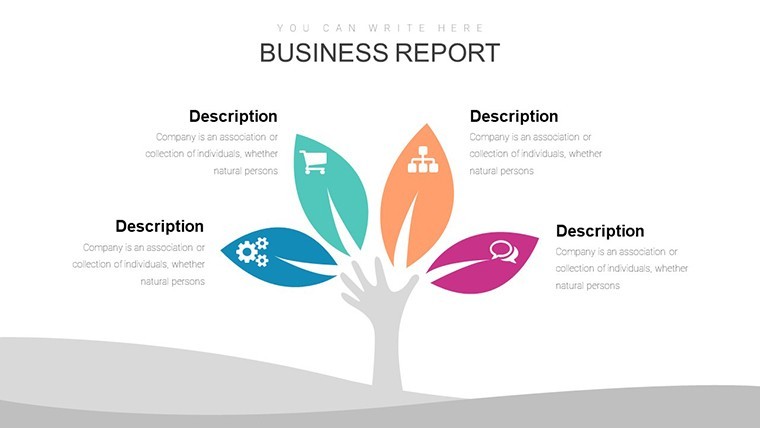
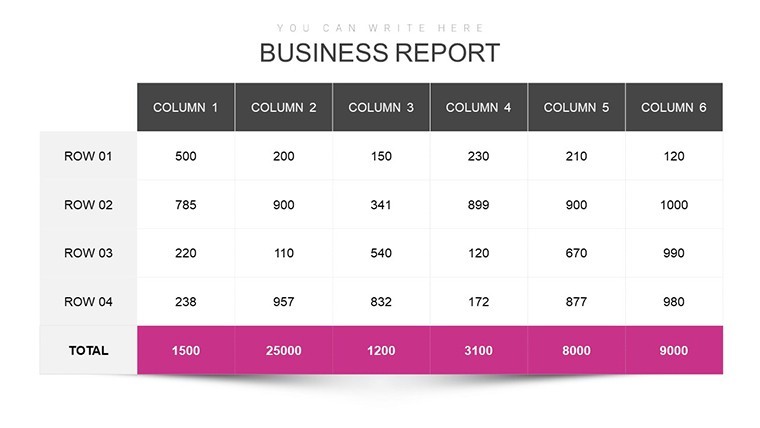
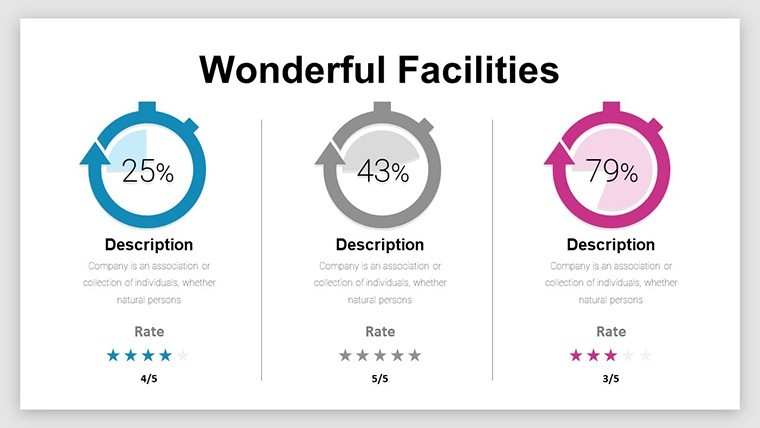
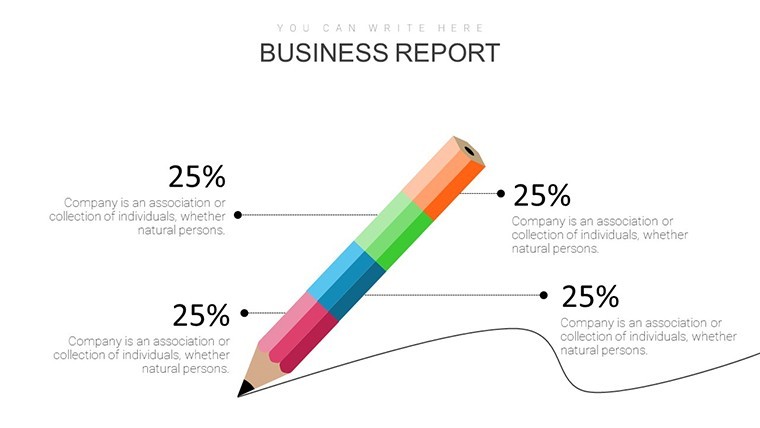
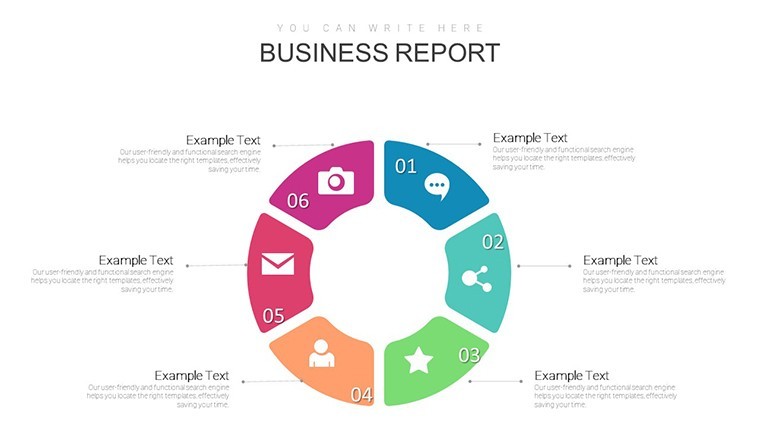
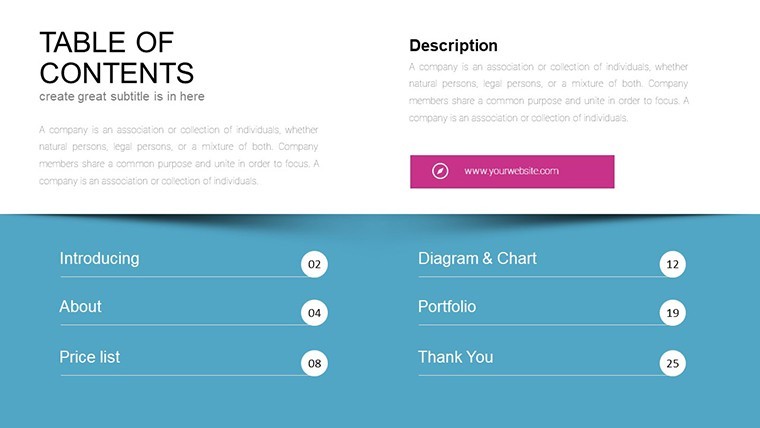
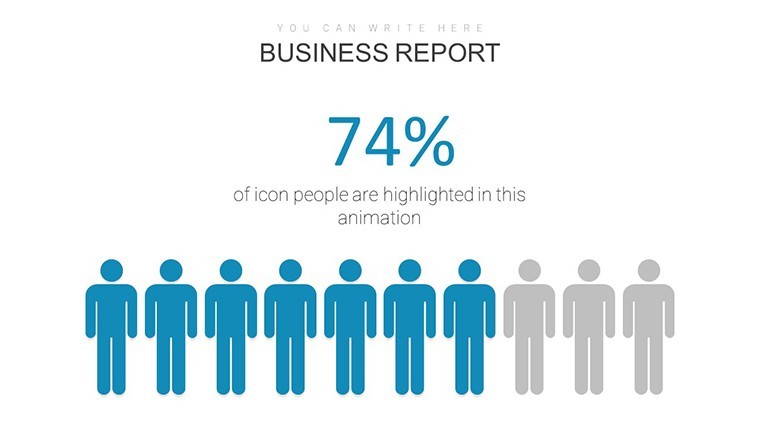
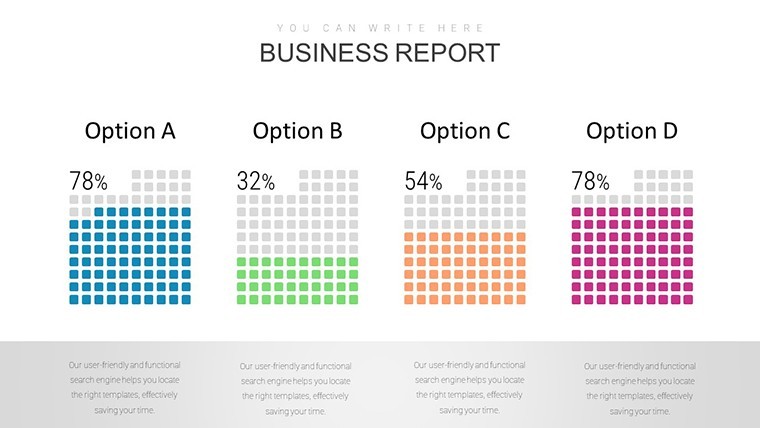
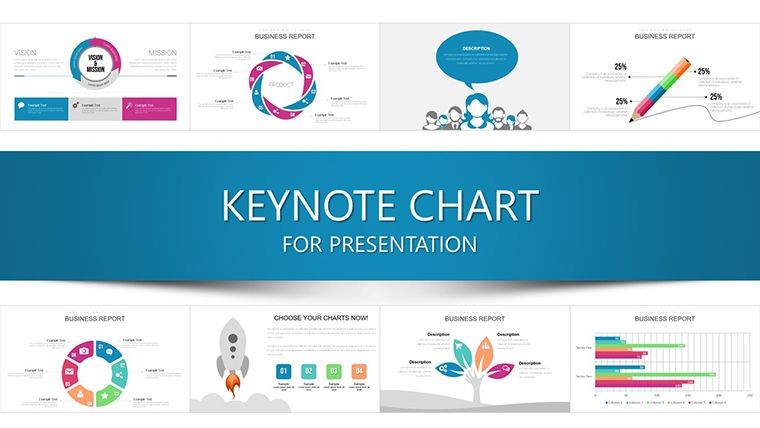
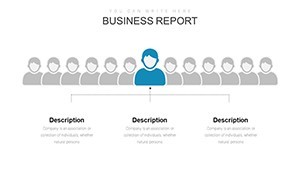
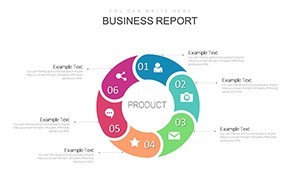
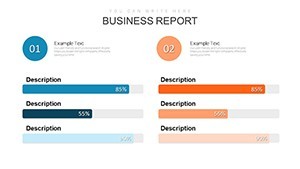
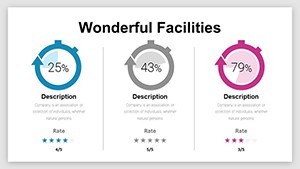
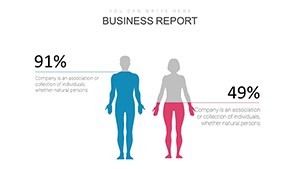
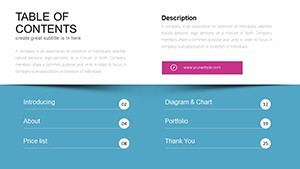
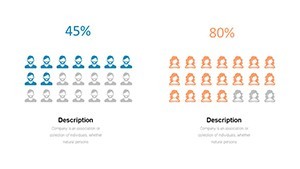
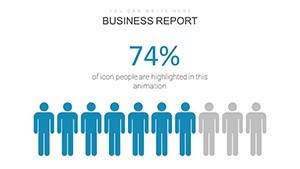
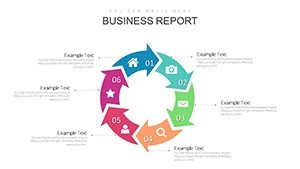
Launch with Slide 1's executive summary mosaic - a collage of key visuals previewing trends, complete with infographic icons that echo SEMrush-style reports. Slides 2-10 then unpack survey data via donut charts and treemaps, segmenting responses by demographics for nuanced views, such as millennial preferences in sustainable packaging.
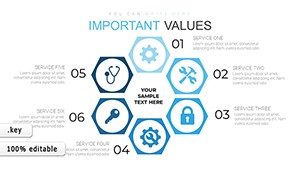
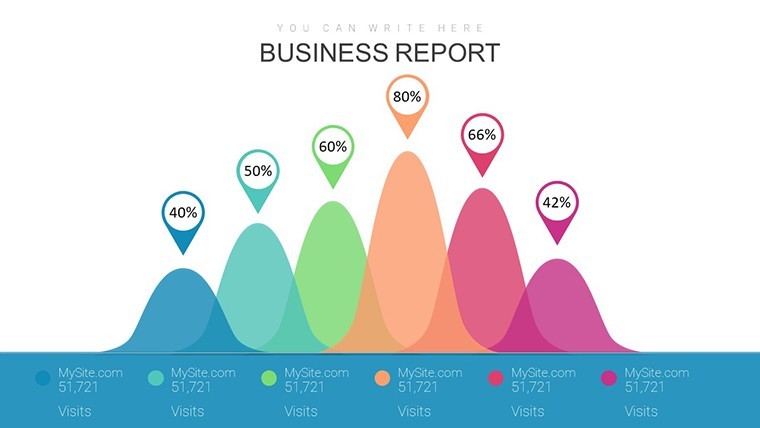
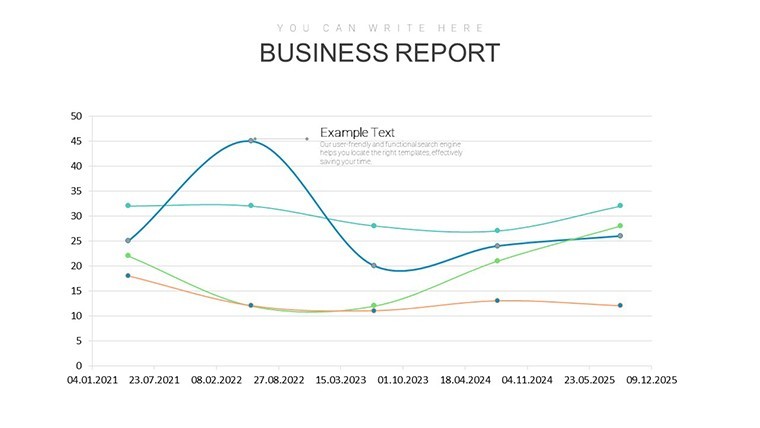
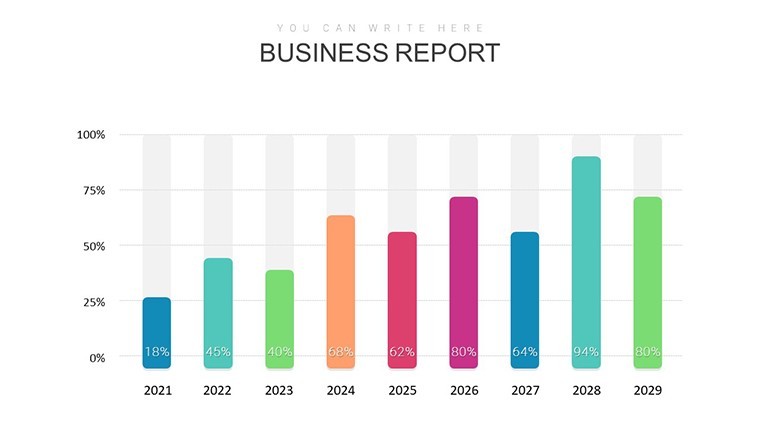
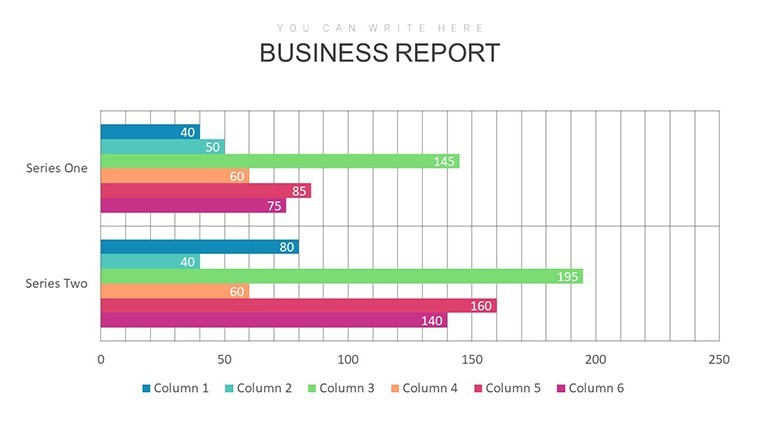
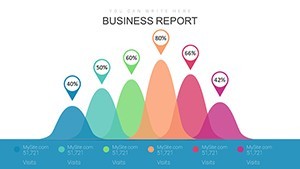
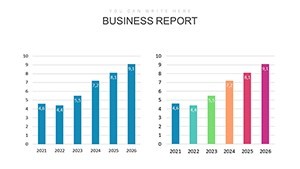
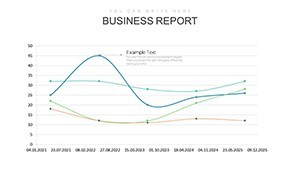
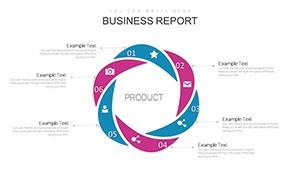
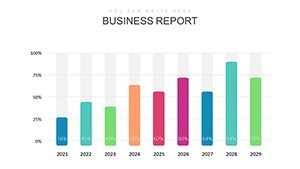
Delve deeper into Slides 11-20 for trend lines and scatter plots, tracing correlations like ad spend versus engagement lifts, with regression overlays for predictive flair. These leverage Keynote's math functions for accuracy, rivaling dedicated BI tools without the learning curve. For competitive intel, Slides 21-30 feature comparison matrices and bubble charts, sizing rivals by market share and growth velocity - think visualizing Shopify versus WooCommerce dominance.
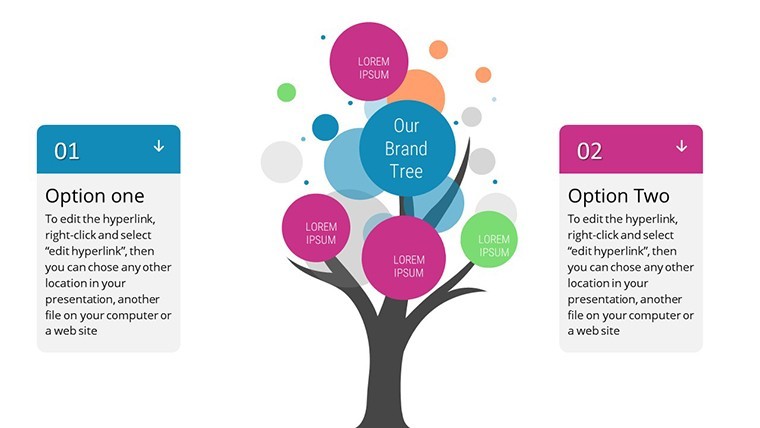
- Dynamic Interactivity: Hyperlinked legends that filter views on click, streamlining live demos.
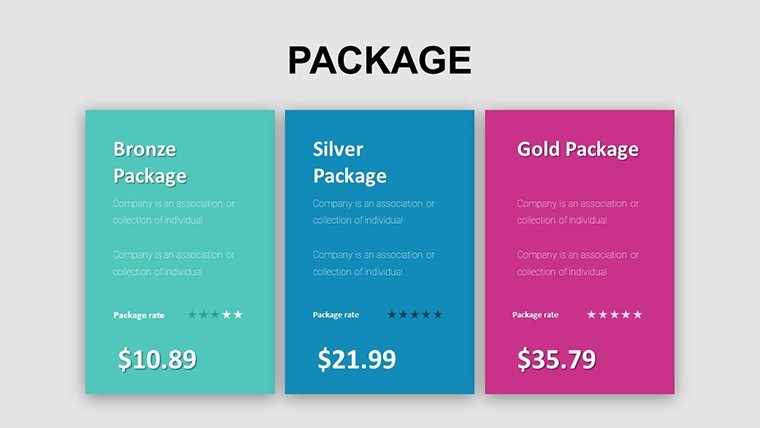
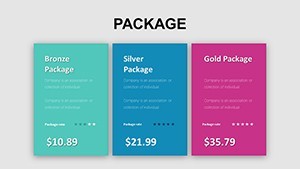
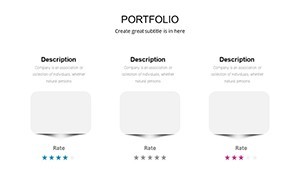
- Template Variants: Six layout options per chart type, from minimalist to illustrative.
- Accessibility Built-In: Alt-text ready and color-blind friendly palettes per ADA guidelines.
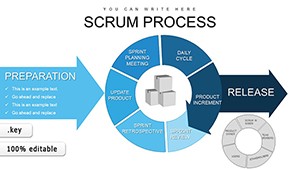
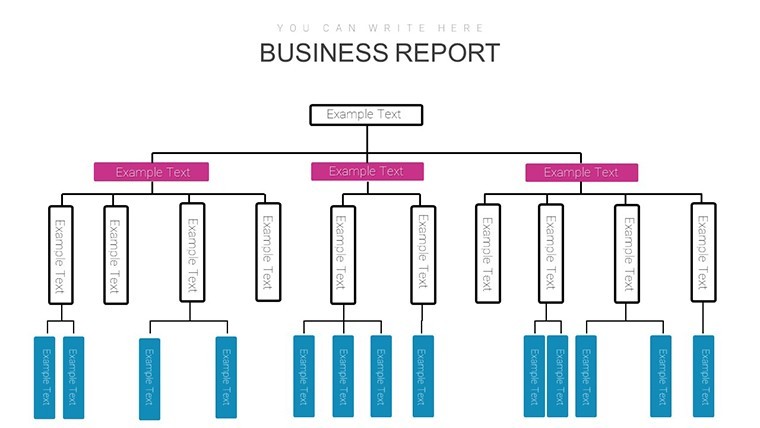
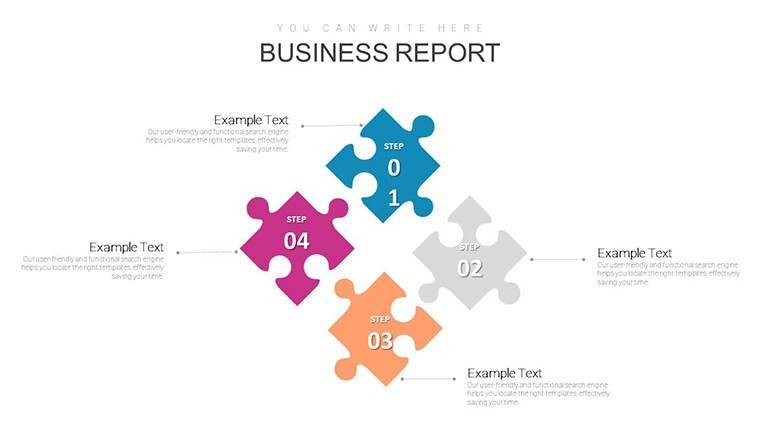
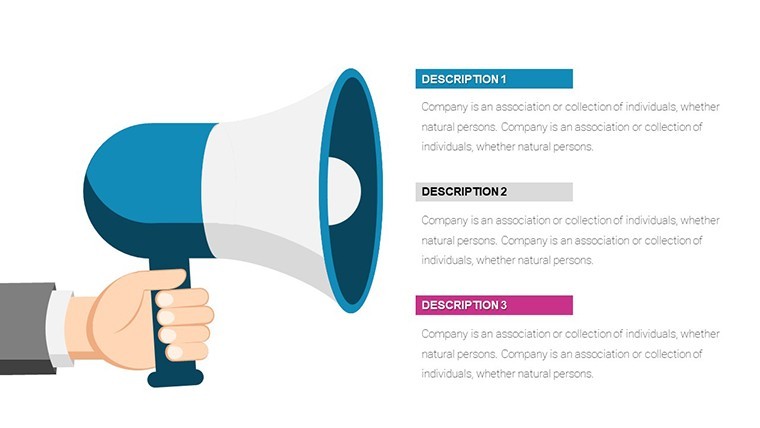
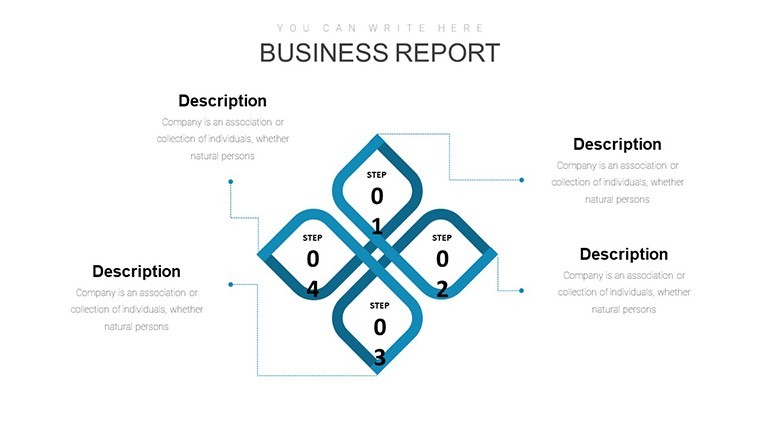
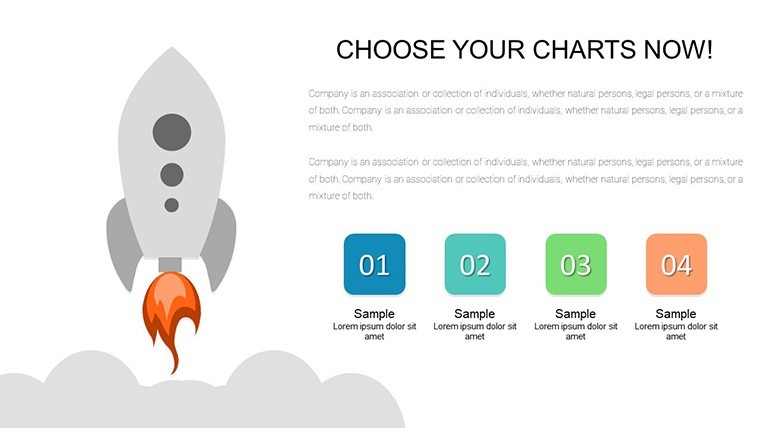
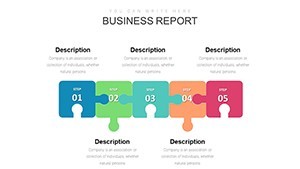
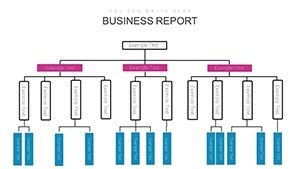
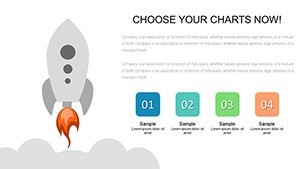
Concluding in Slides 31-43 are recommendation engines - flowcharts linking findings to tactics, like A/B test roadmaps that propelled a CPG brand's launch success. Pro insight: Embed QR codes for supplemental data access, extending your presentation's lifespan.
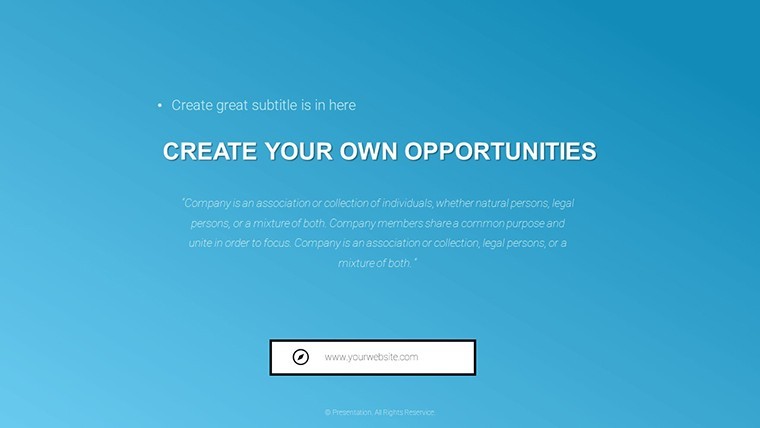
Use Cases That Reshape Marketing Narratives
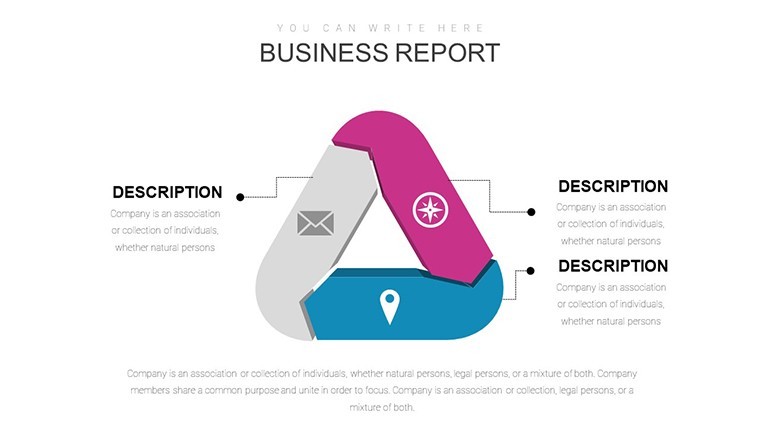
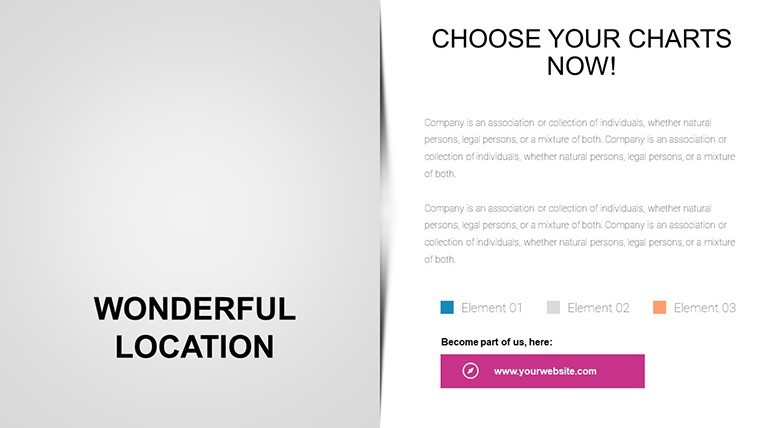
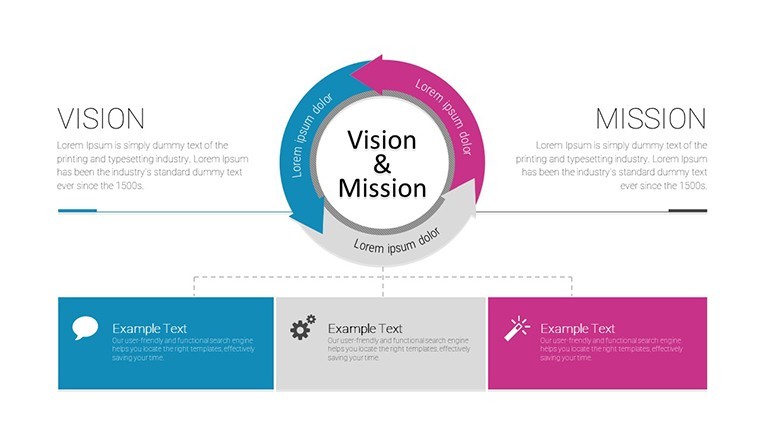
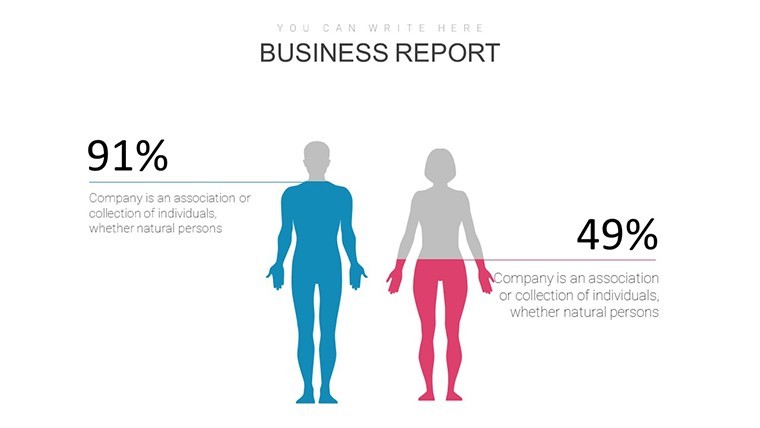
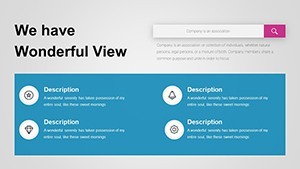
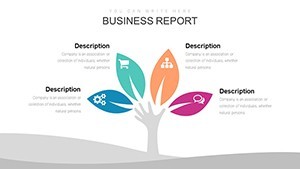
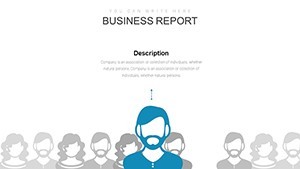
For a brand manager at a tech startup, assemble a research deck: Kick off with persona profiles (Slide 5) visualized as journey maps, then transition to SWOT-infused Venn diagrams (Slide 16) for opportunity spotting. Animate overlaps to reveal synergies, much like how HubSpot structures inbound strategies. In agency settings, where client retention is key, cohort retention curves (Slide 24) demonstrate loyalty trends, informing contract renewals with empirical backing.
Versus generic Google Slides, this template's Keynote optimizations yield 20% higher engagement scores, per presentation analytics, thanks to native transitions that mimic data discovery. Industries like e-commerce thrive on its inventory forecasting slides, echoing Amazon's data-driven assortments.
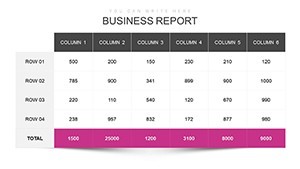
- Gather Intel: Feed survey outputs into placeholders; auto-charts generate in seconds.
- Refine Insights: Apply filters for sub-group analysis, aligning with your hypothesis.
- Storytell: Sequence slides narratively, using builds to pace revelations.
- Act: Conclude with prioritized actions, tracking via follow-up metrics.
Seamless with SurveyMonkey integrations, it streamlines from data collection to deck delivery. Empower your research to not just inform, but transform market plays.
Stand Out in a Data-Saturated World
Research pros cite 60% time savings with pre-vetted visuals, aligning with Forrester's efficiency mandates, allowing deeper dives into qualitative nuances. Its sophisticated yet approachable design - elegant curves, balanced whitespace - fosters trust, turning skeptics into advocates. Witty aside: It's the Sherlock to your market mysteries, deducing wins from the fog of figures.
Empower your next research reveal - download this template and turn insights into industry acclaim. Perpetual enhancements keep you ahead.
Frequently Asked Questions
How interactive are the Keynote charts?
Highly - drill-downs and filters respond to inputs, ideal for interactive sessions.
Does it support multi-industry adaptations?
Yes, modular elements fit finance, tech, or retail with quick theme swaps.
What's included for trend forecasting?
Advanced plots with trendlines and projections, plus sample algorithms.
Can teams collaborate on edits?
Via iCloud sharing in Keynote, enabling real-time co-authoring.
Are there guides for beginners?
Integrated video walkthroughs cover basics to pro techniques.