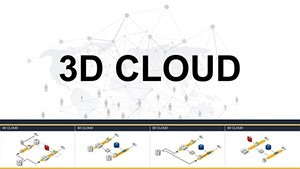
3D Cloud Storage Keynote Charts - Fully Editable | ImagineLayout


Type: Keynote Charts template
Category: Process
Sources Available: .key
Product ID: KC00900
Template incl.: 12 editable slides
Package Contents
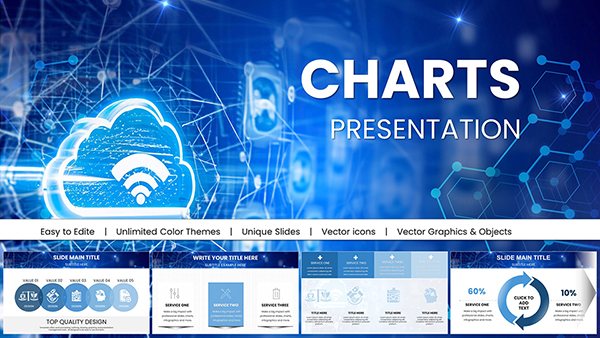
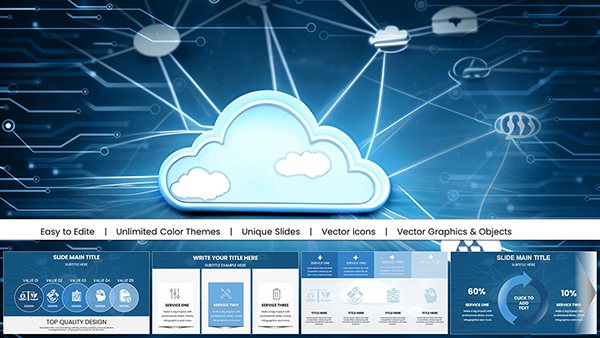
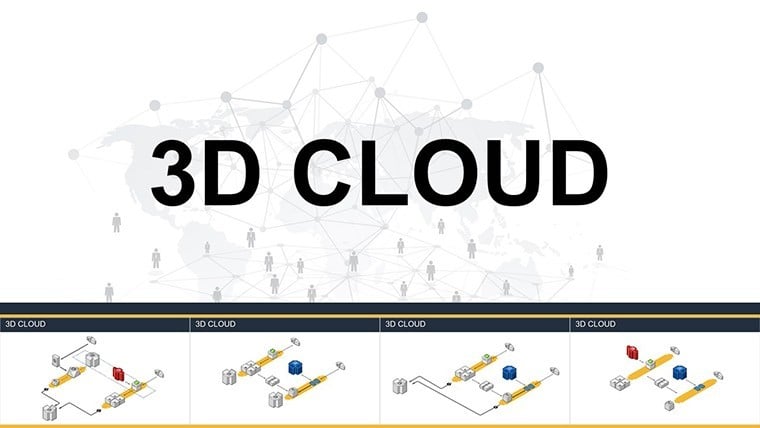
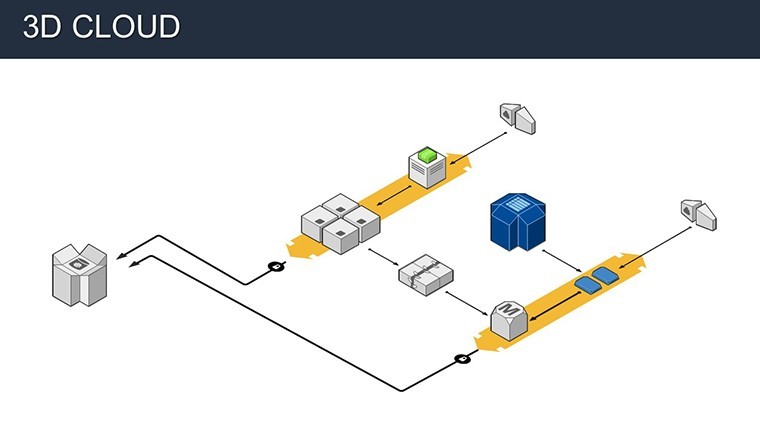
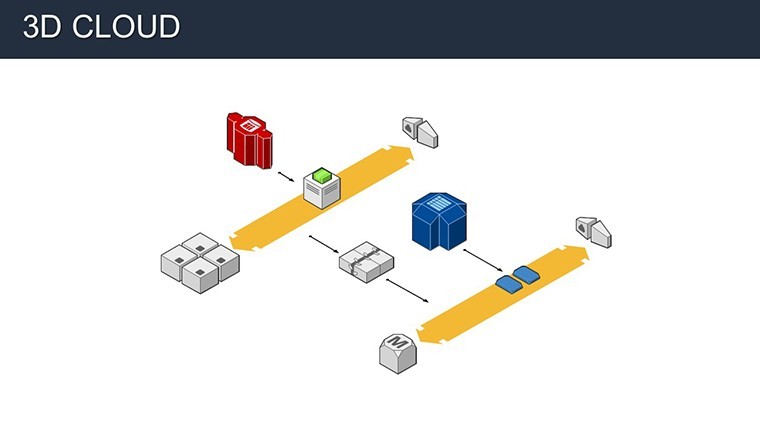
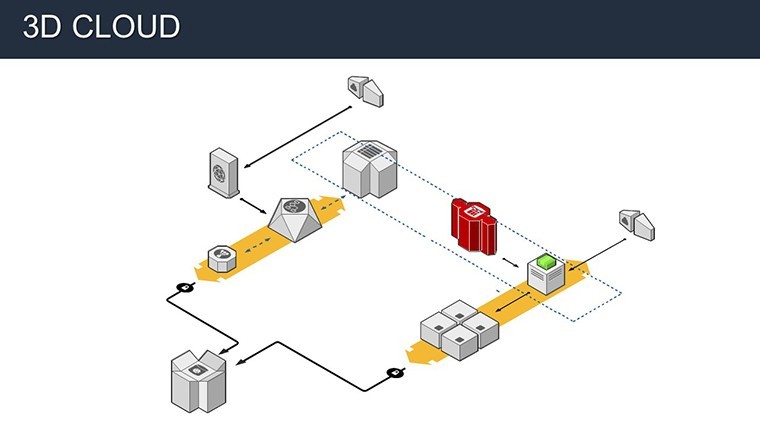
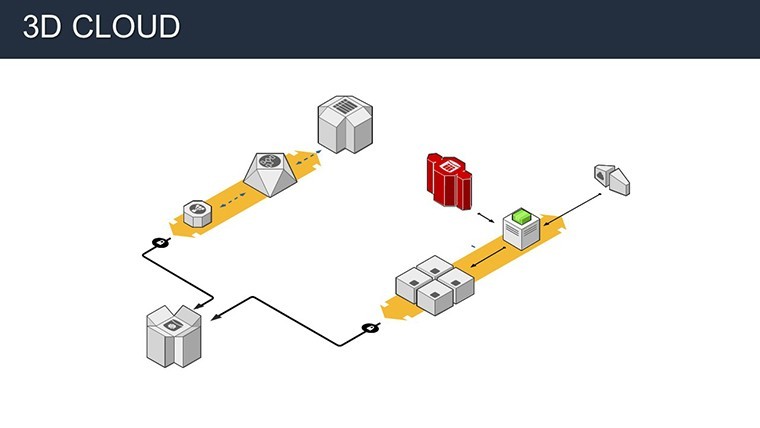
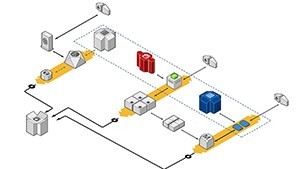
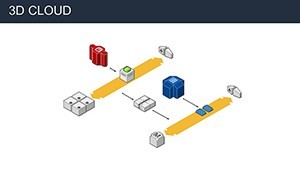
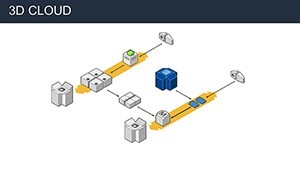
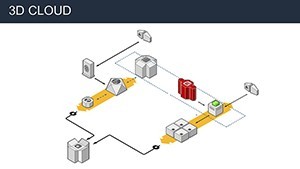
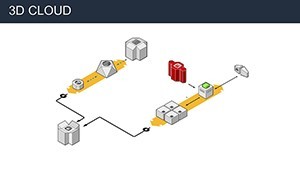
12 diagrams cover spherical models security flowcharts migration pathways and 3D pyramid hierarchies.
One .key file delivers the complete set with editable shapes and icon layers ready for direct import.
Visual hierarchy uses four core colors per slide to keep information spacing clean across all elements.
Editing Capabilities at a Glance
| Feature | Details |
|---|---|
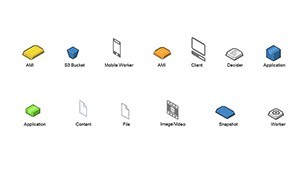
| Editable shapes | Spherical segments resize and recolor independently without breaking layout composition |
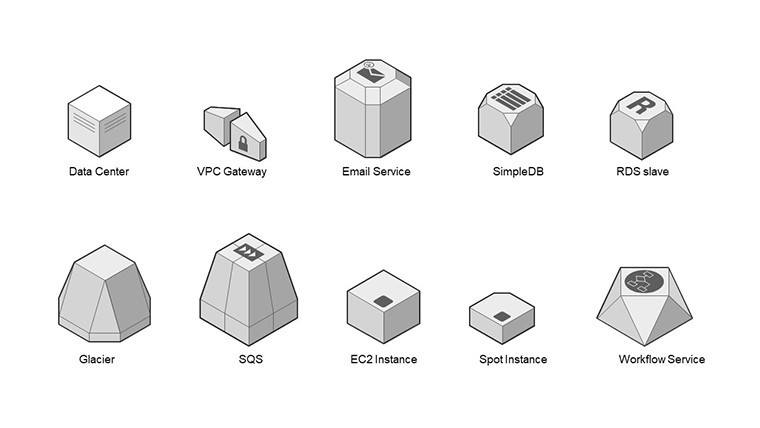
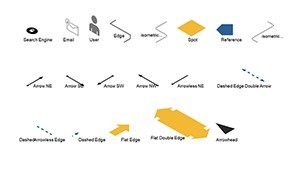
| Icon layers | Security icons replaceable or recolorable without affecting flow direction |
| Text placeholders | Labels outside shapes stay editable even after diagram connectors move |
| Color theme adjustments | Compatible with Keynote slide master palette for instant brand swaps |
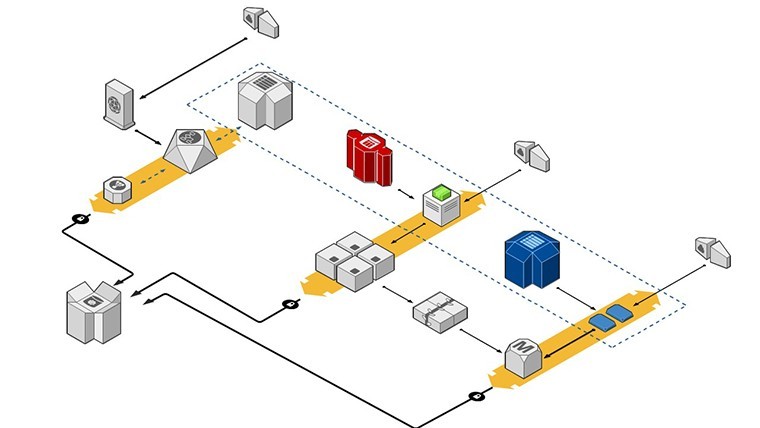
| Diagram connectors | Migration arrows adjustable in weight and direction on large projection screens |
| Export options | PPTX conversion available alongside native .key for client distribution |
Who Reaches for This Template
An IT manager in a SaaS company preparing an investor deck cut diagram creation from 4 hours to 50 minutes by swapping only color themes on the 3D pyramid slide.
A compliance officer in finance used the security flowcharts during a board briefing and reused the same file across three quarterly reports.
Download the 3D Cloud Storage Keynote Charts Template for $18
From Download to Final Deck
Open the .key file in Keynote 12 or newer on macOS or iPadOS.
- Replace placeholder text across all migration pathway slides (3 minutes)
- Adjust brand colors via the slide master panel (2 minutes)
- Edit diagram connectors and spherical model segments (4 minutes)
- Export as PDF or native Keynote (1 minute)
Difficulty level remains moderate even for users with basic design skill.
The Cost of Not Using a Template
Building equivalent 3D cloud diagrams from scratch takes most professionals over two hours and often results in overlapping labels that vanish on projector screens.
This layout keeps labels outside the spherical shapes connected by thin lines improving clarity during live strategy meetings.
Flow direction and zone segmentation stay consistent without advanced vector skills.
Consultants often combine this with the Cloud Network Presentation Template with Charts for Keynote when layering infrastructure visuals in one business presentation.
Project managers reach for the Business Process Modeling Keynote Charts as a complementary piece for full lifecycle overviews.
Which Keynote versions does this template support?
Keynote 12 and newer on macOS or iOS open the file without conversion. Older versions may require import but preserve diagram structure and editable shapes. Test compatibility before client delivery to avoid layout shifts. The .key format works natively across Apple devices for seamless sharing in board briefings.
How do I change the color scheme?
Open the slide master view in Keynote. Select the color palette panel and update theme colors for all slides at once. Apply the new scheme to spherical models and security flowcharts in one click. The change updates diagram connectors and text placeholders automatically across the full set.
What does the license allow for client work?
Use in paid client presentations and internal reports is fully permitted. Resale or redistribution of the .key file itself is prohibited. Sublicensing to third parties requires separate enterprise contact. The template supports unlimited projects within one organization.
What software is required to open the file?
Keynote version 12 or newer on any Apple device handles the native .key format. No PowerPoint or third-party tools needed for editing. Export to PDF works from within Keynote for distribution. The file remains fully editable only inside Keynote.
What does the free version include versus the paid version?
This template has no separate free preview listed on the page. The purchased download delivers the complete 12-slide file with all editable shapes and diagram connectors. Limited samples elsewhere on the site typically restrict to two watermarked slides. Full migration pathways and 3D pyramid elements appear only in the paid package.
Does the template support animations?
Sequential reveals on migration arrows and security flowcharts work via the Keynote transition panel. Apply build-in animations to individual spherical segments without breaking layout composition. Path animations follow flow direction automatically. Disable them entirely for static business presentation exports.