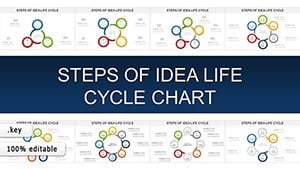
Network Solutions Keynote Charts: IT Data Mastery


Type: Keynote Charts template
Category: Illustrations
Sources Available: .key
Product ID: KC00891
Template incl.: 16 editable slides
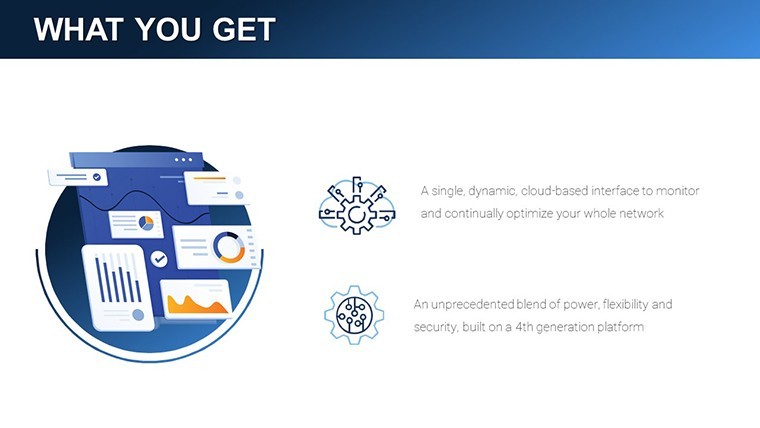
In the intricate web of modern IT infrastructures, clarity isn't optional - it's essential. Our Network Solutions Keynote Charts Template equips you with 16 editable slides to demystify network performance, security threats, and optimization strategies. Designed for IT specialists, network admins, and business analysts who juggle data overload daily, this template turns raw metrics into compelling narratives that inform and impress.
Drawing from standards like those from Cisco's networking certifications (CCNA/CCNP), the template features diagrams for topology mapping, bandwidth allocation, and latency analysis. Its tech-inspired design - featuring a sleek palette of blues and silvers - evokes reliability and innovation, compatible with Keynote for fluid editing and exportable to PowerPoint or Google Slides for hybrid teams. Whether troubleshooting a downtime incident or pitching infrastructure upgrades, these visuals align with ITIL frameworks, helping you communicate with precision.
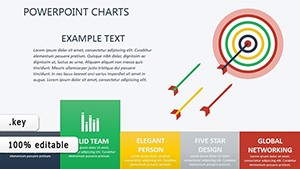
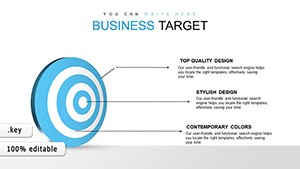
Envision a boardroom scenario: Instead of jargon-heavy spreadsheets, Slide 4's network topology chart reveals bottlenecks at a glance, inspired by real deployments like those in Google's data centers for scalable cloud solutions. Or use Slide 9's performance dashboard to forecast growth, mirroring how enterprises like IBM visualize AI-driven networks to cut costs by 20%, as per Gartner reports.
Core Features for Seamless Network Visualization
This template shines with purpose-built elements that prioritize functionality. The 16 slides include layered diagrams, interactive flowcharts, and metric gauges, all vector-scaled for high-res displays.
- Intuitive Data Handling: Drag-and-drop placeholders for importing from tools like Wireshark or SolarWinds, with auto-updating graphs.
- Professional Aesthetics: Subtle grid backgrounds and node icons (routers, switches, firewalls) for authentic IT representation.
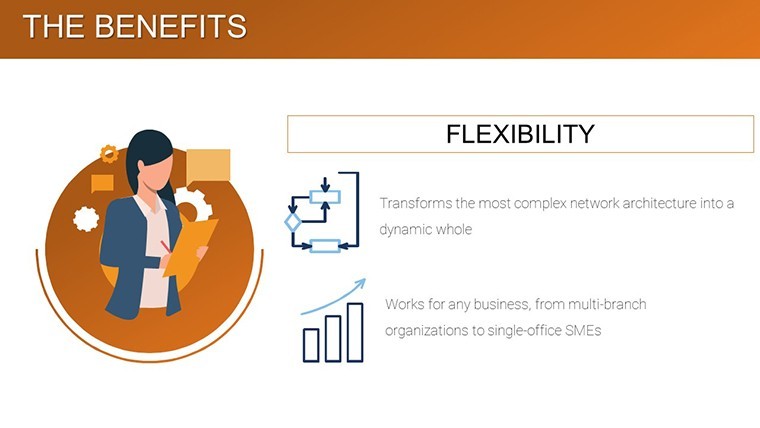
- Adaptive Layouts: Responsive designs that work on widescreen or standard formats, with master slides for quick theming.
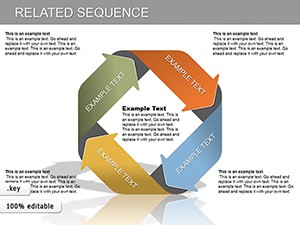
- Dynamic Elements: Built-in animations to simulate data flow, enhancing live demos.
Outpacing basic diagramming software, it integrates directly into presentations, saving time on exports and ensuring cohesion. For compliance-heavy environments, it supports annotations for audit trails, vital in sectors like finance under PCI-DSS.
Navigating Your Network Presentation: Step by Step
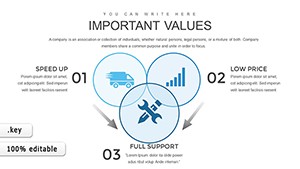
- Overview Setup: Slide 1's summary infographic outlines key metrics, like uptime percentages.
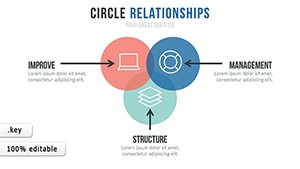
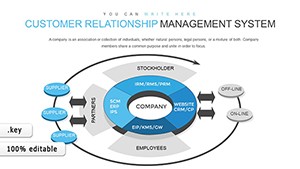
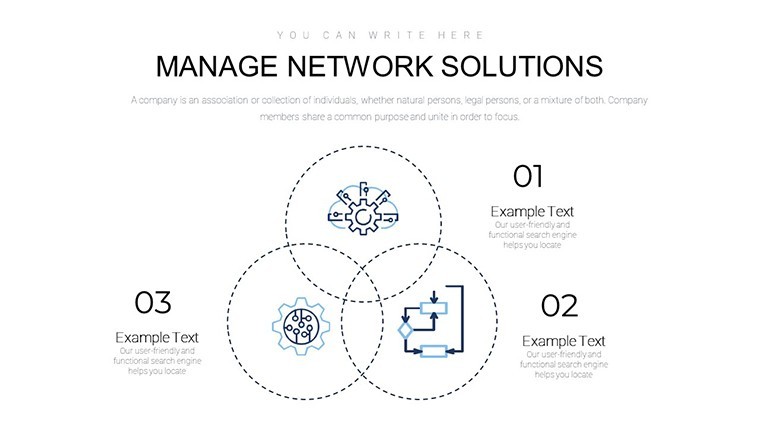
- Topology Breakdown: Slides 2-5 map connections, highlighting vulnerabilities with color-coded alerts.
- Performance Analysis: Use Slides 6-9 for trend lines on throughput and error rates.
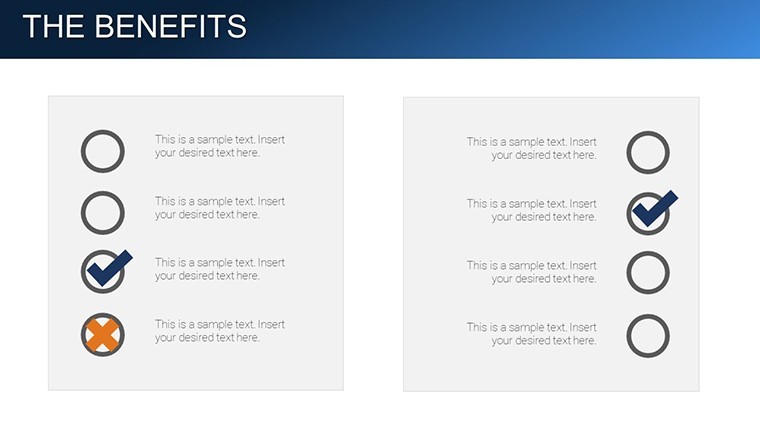
- Solution Proposals: Slides 10-13 feature before-after comparisons for upgrades.
- Future Projections: Close with Slides 14-16's predictive charts, using simple formulas for scalability.
This workflow echoes best practices from CompTIA Network+, streamlining from diagnosis to resolution, much like how telecom giants like Verizon use visuals for outage post-mortems.
Practical Applications in IT and Beyond
For IT pros, it's indispensable for status reports - chart packet loss in Slide 7 to justify budget asks. Network admins can illustrate firewall rules, preventing breaches as in the Equifax case study where visualization aided recovery planning.
Business analysts extend it to ROI analyses, linking network health to operational efficiency. In education, teach cybersecurity with interactive threat models, aligning with NIST guidelines. For cloud migrations, visualize hybrid setups, akin to AWS case studies on seamless transitions.
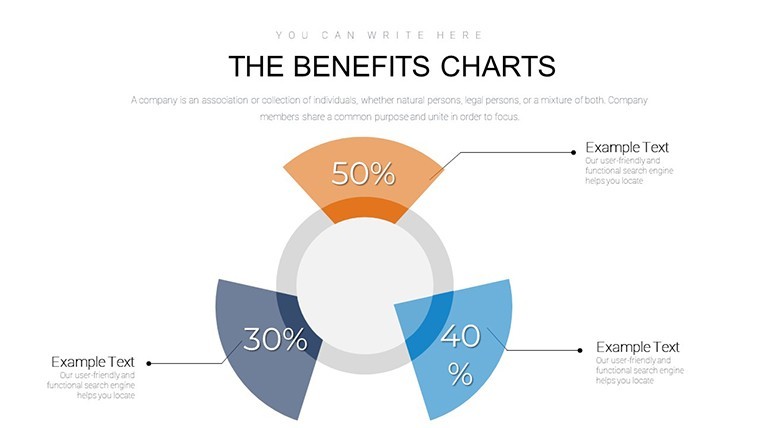
Even in consulting, use it for client audits, breaking down legacy systems into upgrade paths with pie charts for cost distributions.
Expert Tips to Amplify Your Tech Talks
Layer context: Start with a real-world hook, like "In 2023, network downtime cost businesses $5K per minute - let's prevent that." Opt for dark mode variants for late-night reviews. Add light levity, captioning a congested node as "The Digital Traffic Jam." Integrate with Lucidchart for advanced exports, and rehearse with screen-sharing tools for remote efficacy.
For global teams, embed multilingual labels, broadening accessibility. This ensures your presentations aren't just technical - they're transformative.
Why Choose This for Your IT Arsenal
In an era of escalating cyber threats and data explosion, this Network Solutions Keynote Charts Template is your clarity compass. Customize, deploy, and dominate discussions. Download today and network like never before - your infrastructure deserves it.
Frequently Asked Questions
What types of charts are included for network analysis?
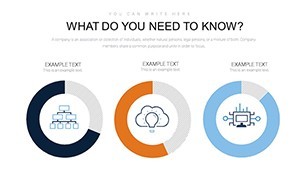
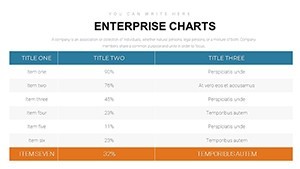
Topology maps, performance dashboards, flowcharts, and predictive graphs tailored for IT metrics.
Is compatibility limited to Keynote?
No - exports to PowerPoint and Google Slides retain full functionality for versatile use.
Can it handle large datasets?
Yes, with linked data features that update charts dynamically from external sources.
How does the design support professional IT presentations?
Tech-themed palettes and icons ensure a credible, modern look aligned with industry standards.
Are animations customizable?
Fully - adjust timing and sequences in Keynote to fit your narrative pace.
What's the slide count and focus?
16 slides, emphasizing data management, adaptability, and visual purpose for network pros.