Drive Awareness with Preventing Sexual Violence Keynote Template


Type: Keynote Charts template
Category: Relationship, Silhouettes & People
Sources Available: .key
Product ID: KC00879
Template incl.: 14 editable slides
Addressing sexual violence requires sensitivity, clarity, and compelling communication. Our Preventing Sexual Violence Keynote template empowers educators, advocates, and organizations to create presentations that inform and inspire action. Featuring 14 editable slides, this tool combines thoughtful design with practical visuals to tackle a critical issue. Envision using graphs to highlight prevalence statistics or infographics to outline prevention strategies, making complex topics accessible. Compatible with Keynote, it's ideal for workshops, community sessions, or policy discussions. By using this template, you're not just presenting data - you're fostering understanding and change, drawing on evidence-based approaches from organizations like RAINN.
Core Features for Sensitive Topic Handling
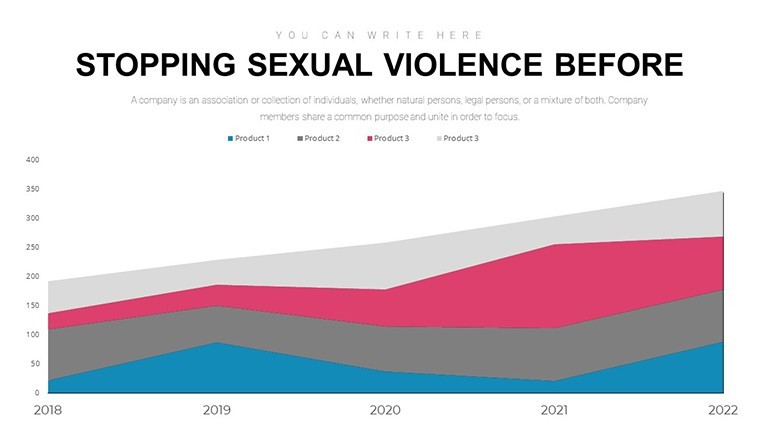
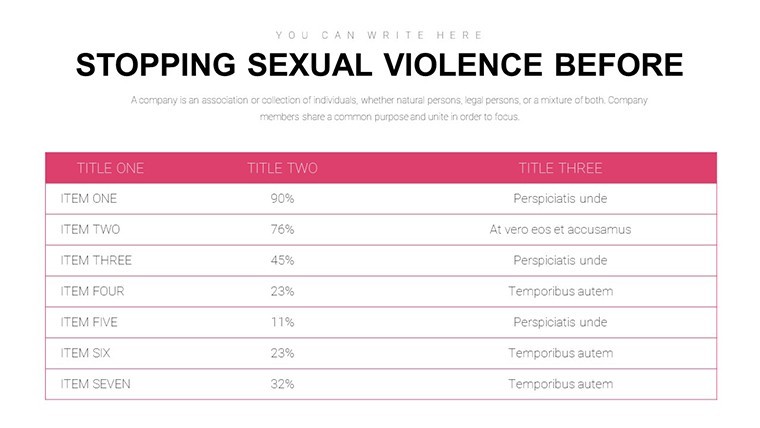
Crafted with care, the template offers full customization: alter colors for a calming palette, adjust fonts for emphasis, and rearrange layouts to suit your flow. Charts include bar graphs for victim demographics, line charts for trend analysis, and tables for resource listings. High-quality, relevant images are included, ensuring respectful representation without sensationalism.
Comprehensive Slide Overview
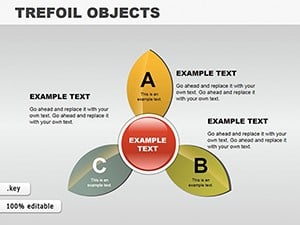
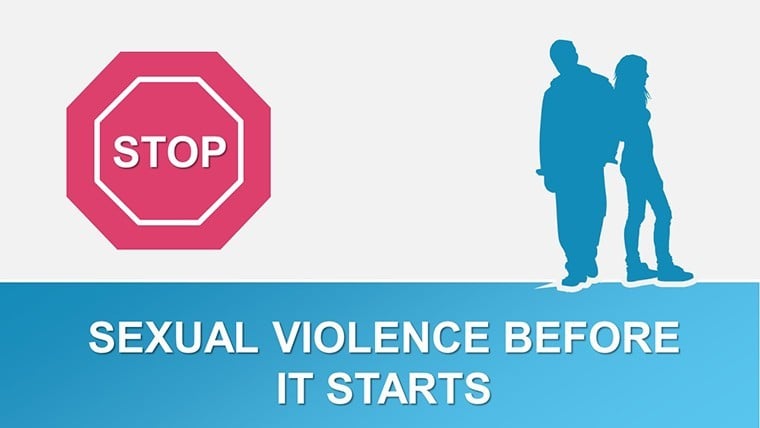
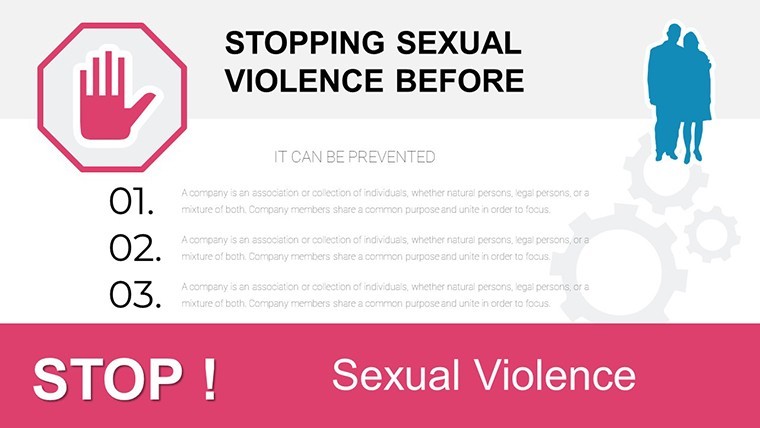
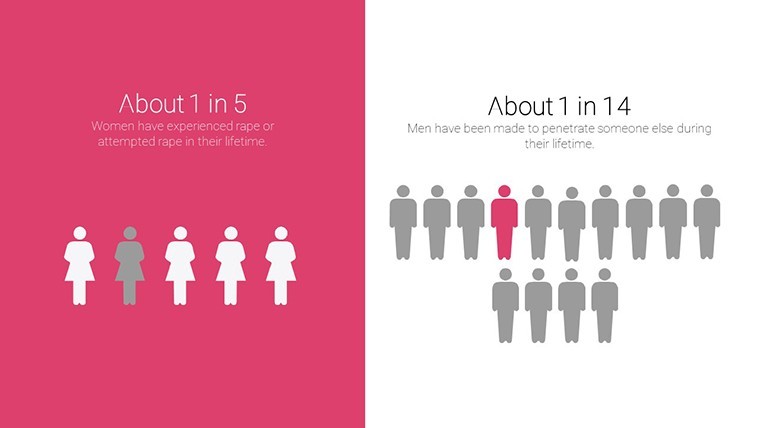
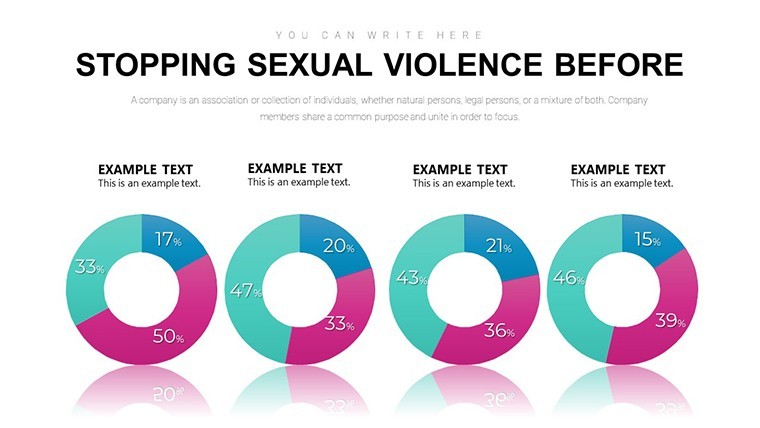
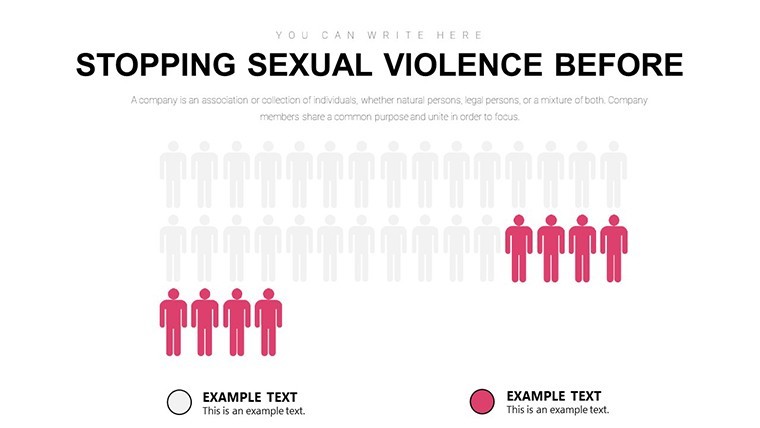
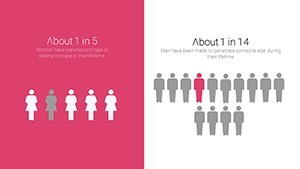
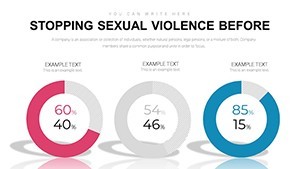
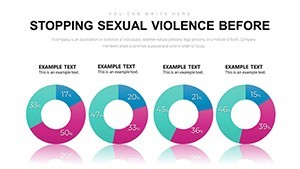
Slide 1: A somber yet hopeful title slide with subtle imagery and key messaging. Slides 2-4: Definitional charts, like pie diagrams categorizing types of violence and bar graphs on impacted groups, editable with local stats.
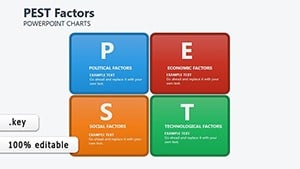
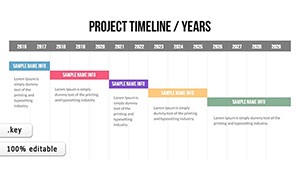
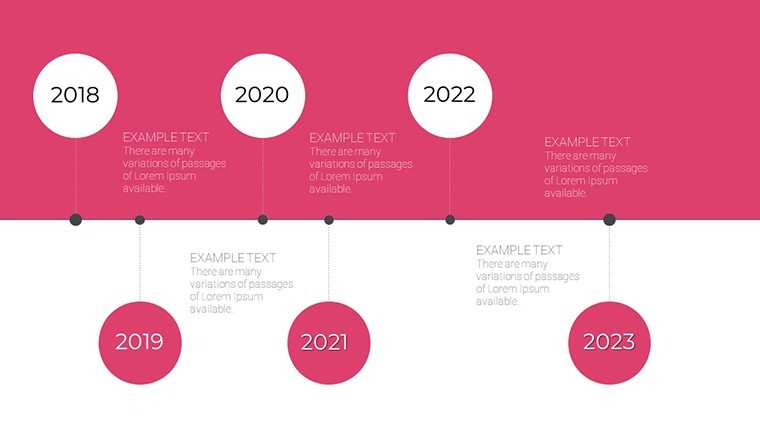
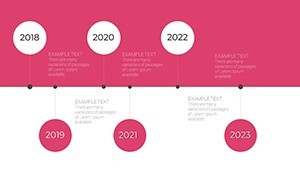
Slides 5-8: Impact sections with timelines showing long-term effects, matrix charts for psychological vs. physical consequences, and flowcharts for reporting processes. These draw on WHO guidelines for accuracy.
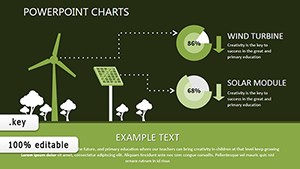
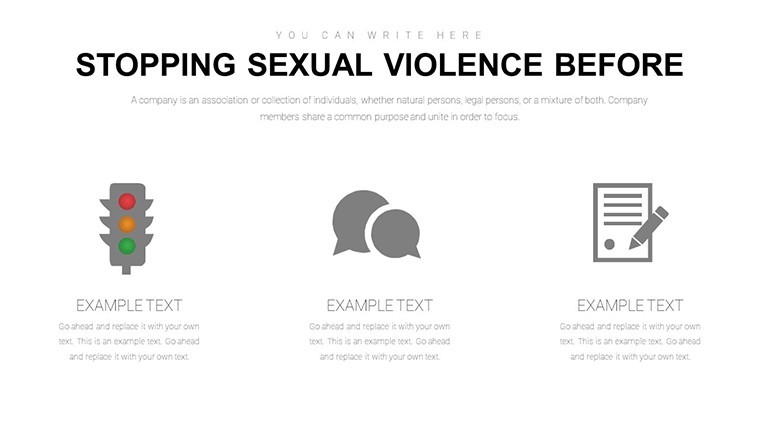
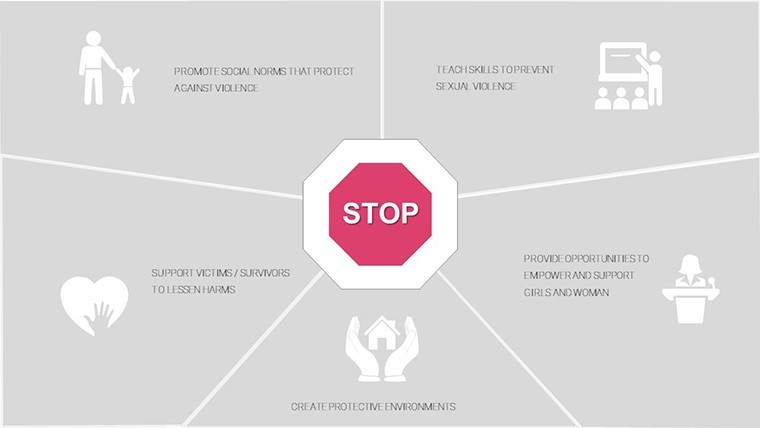
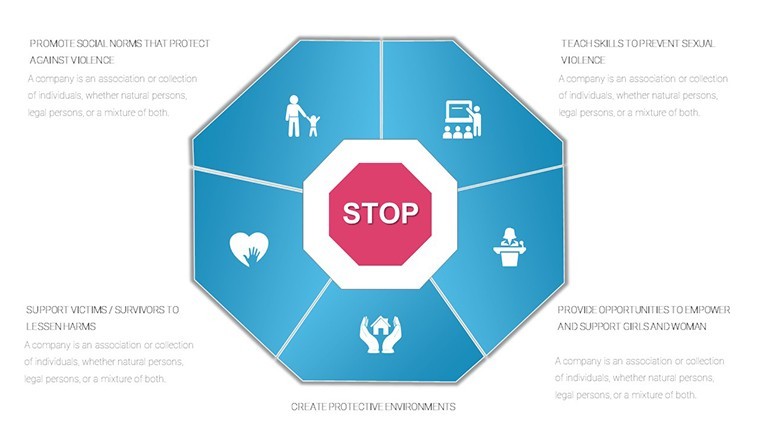
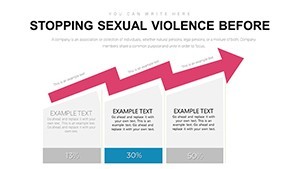
Slides 9-11: Prevention focus - infographics on bystander intervention, step-by-step guides for consent education, and comparative graphs of program efficacy.
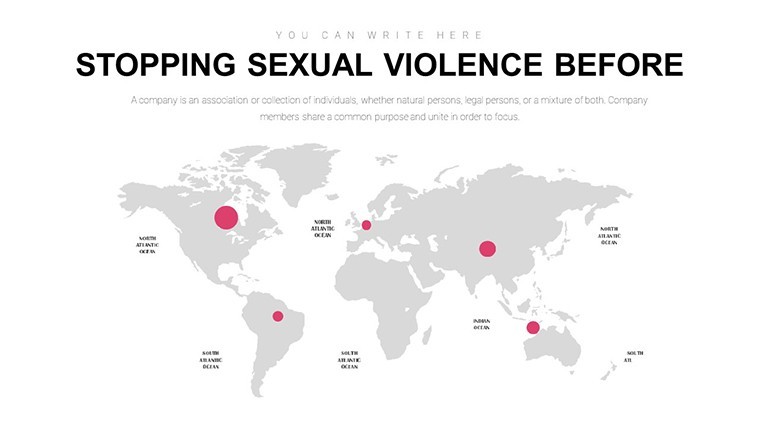
Slides 12-14: Action and resources: Dashboards with helpline contacts, maps for support networks, and CTA slides encouraging engagement.
Applications in Advocacy and Education
Use it for school assemblies, visualizing stats to engage youth on consent. Nonprofits can customize for fundraising, showing intervention impacts. Corporate trainers might adapt for workplace policies, using tables to outline protocols.
Benefits include heightened empathy through visuals - research indicates stories with graphs increase retention by 50%. It saves time on design, allowing focus on content curation. Builds credibility by aligning with standards from the National Sexual Violence Resource Center.
Guidance from Advocacy Experts
Start with empathy statements, use inclusive language. Incorporate survivor stories ethically. For virtual sessions, optimize animations for smooth Zoom sharing. Reference studies like CDC surveys for data integrity.
Case in point: A university used this for orientation, reporting increased reporting rates post-presentation.
Why This Template Matters
It's more than slides; it's a catalyst for dialogue. In a field needing precision, it provides structure without rigidity.
Join the movement - customize and present to make a difference.
Frequently Asked Questions
How sensitive are the images included?
Images are chosen for respectfulness, focusing on empowerment rather than trauma.
Can I adapt this for other awareness topics?
Yes, though core charts are violence-specific; modify for related issues like bullying.
Is commercial use allowed?
Yes for presentations, but not resale; suitable for paid workshops.
How do I update statistics?
Edit chart data directly in Keynote; sources can be footnoted.
What if I need more slides?
Duplicate and customize existing ones for expansion.
Compatible with iPad Keynote?
Fully, for on-the-go editing.