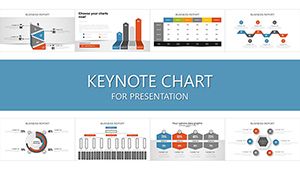
Business Infographic Keynote Charts for Compelling Data Narratives


Type: Keynote Charts template
Category: Business Models, Analysis
Sources Available: .key
Product ID: KC00875
Template incl.: 36 editable slides
Step into a realm where business data transcends spreadsheets and becomes a visual masterpiece. The Business Infographic Keynote Charts Template, boasting 36 editable slides, is crafted to empower professionals in turning intricate information into digestible, eye-catching infographics. This isn't just about charts; it's about crafting stories that captivate stakeholders, from board members to clients. Aimed at business leaders, marketers, educators, and entrepreneurs, it fulfills the intent of simplifying complex datasets - be it sales forecasts, market analyses, or strategic plans. By blending high-quality graphics with flexible layouts, it draws on design principles from organizations like the Data Visualization Society, ensuring your presentations are not only informative but also aesthetically superior. Benefits include enhanced audience retention, quicker decision-making, and a professional edge over competitors using stock templates. Whether pitching a new venture or teaching business concepts, this template integrates effortlessly, saving you design time while amplifying your message's reach and resonance.
Elevating Data with Professional Infographic Designs
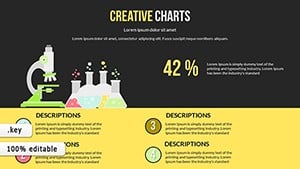
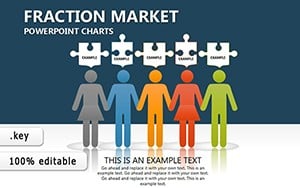
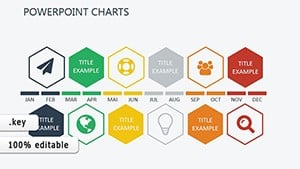
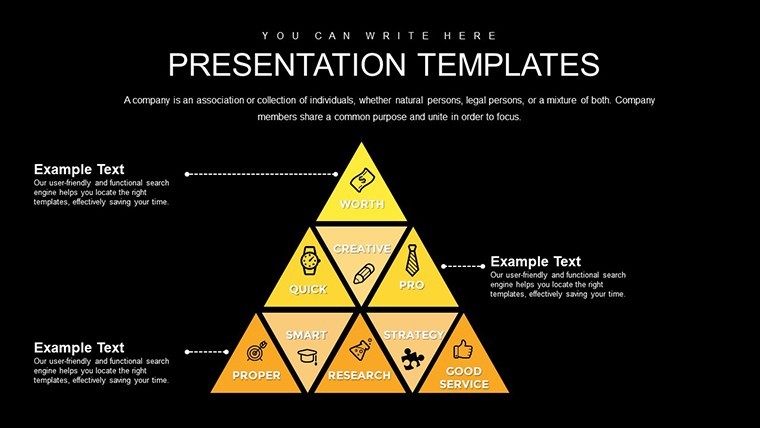
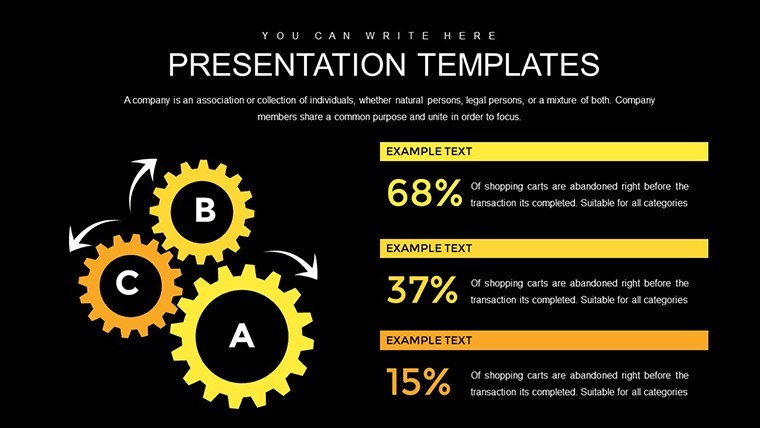
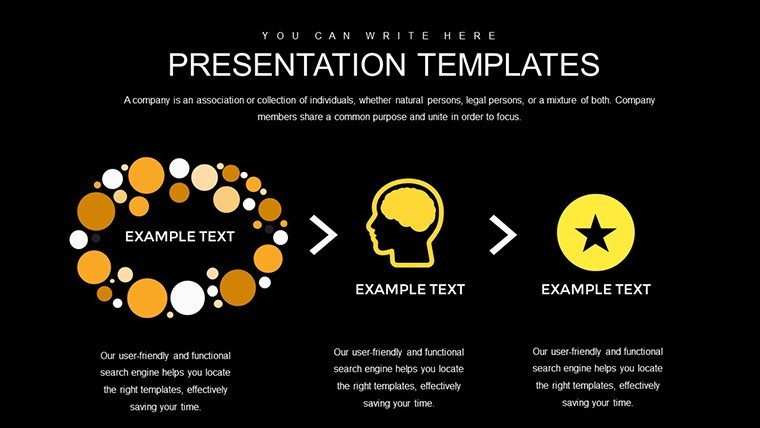
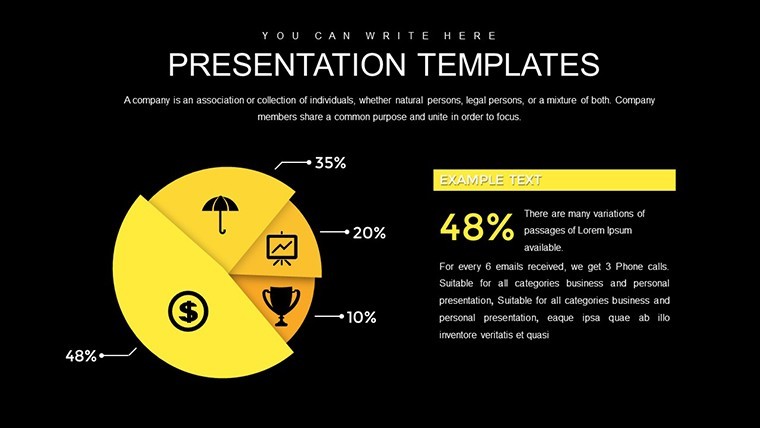
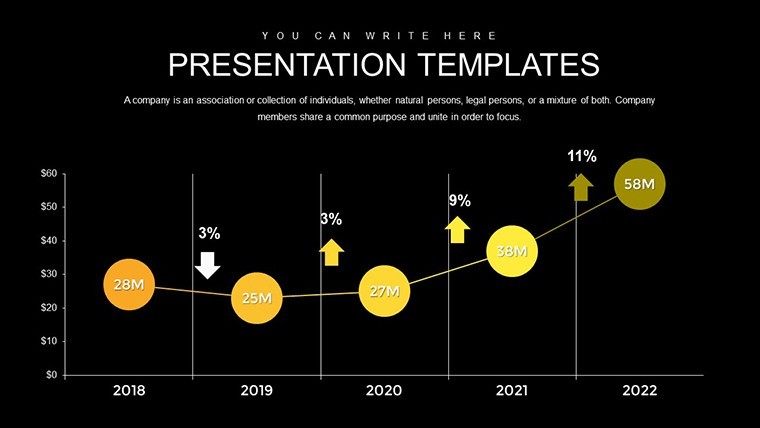
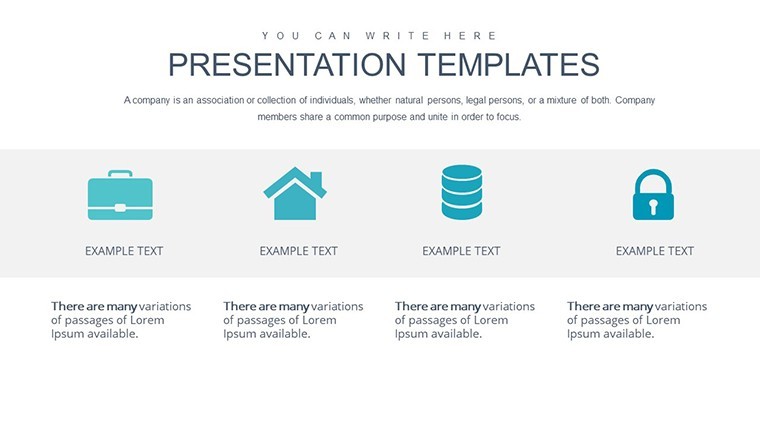
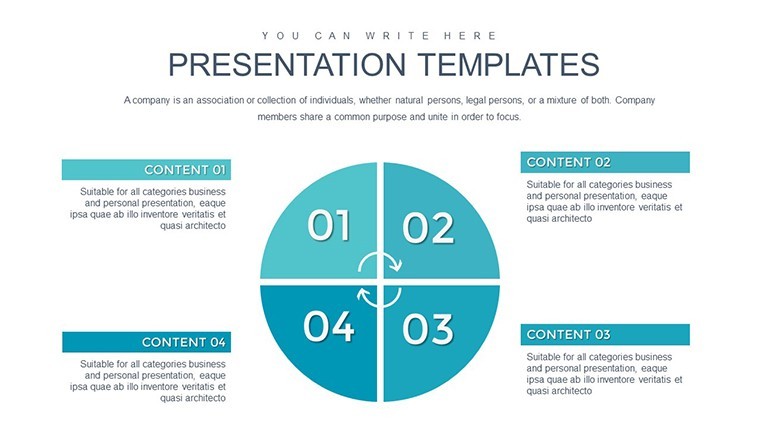
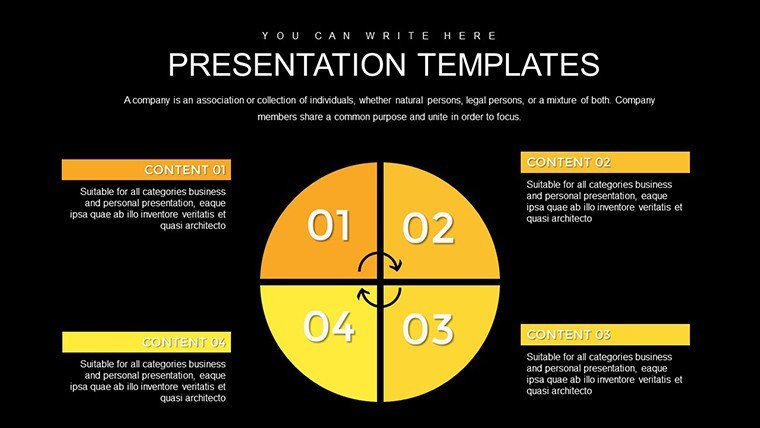
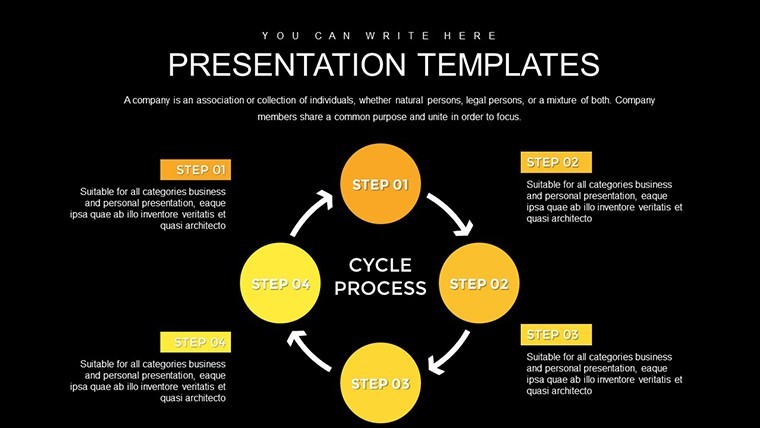
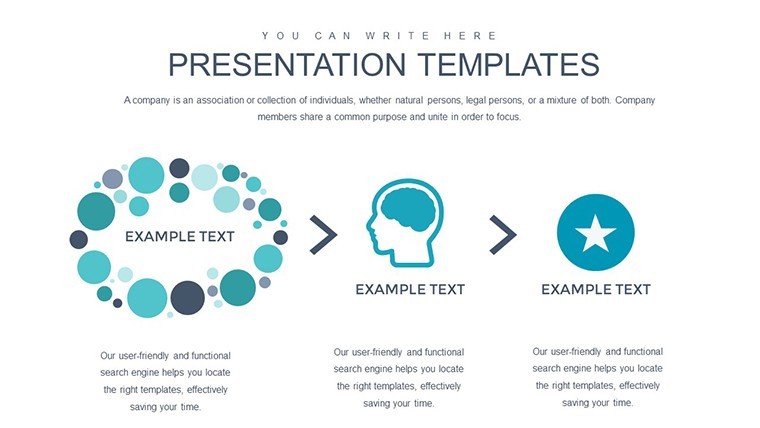
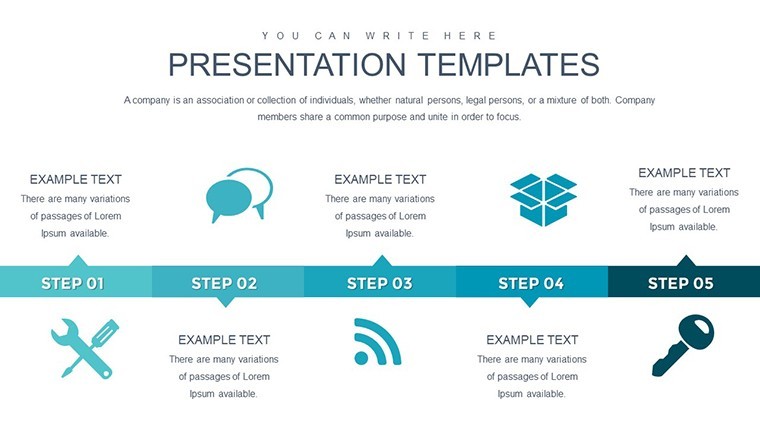
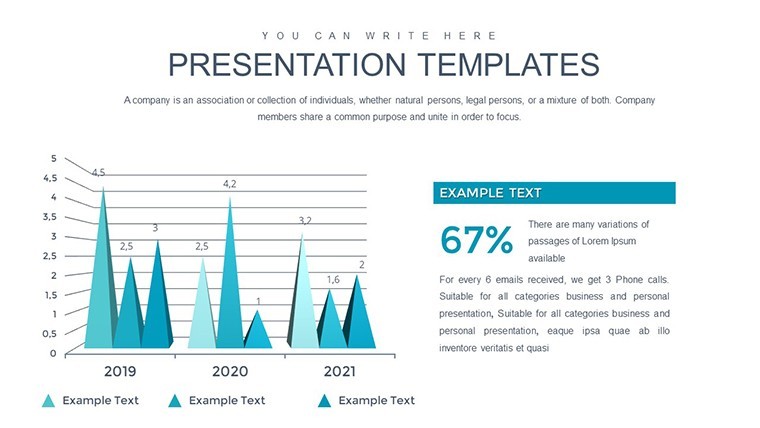
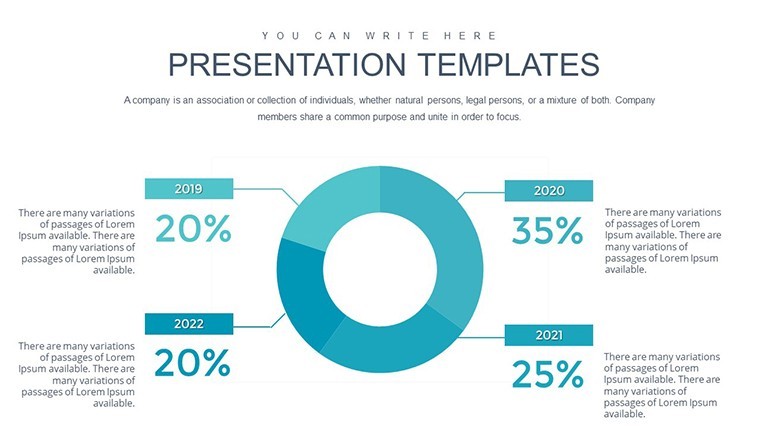
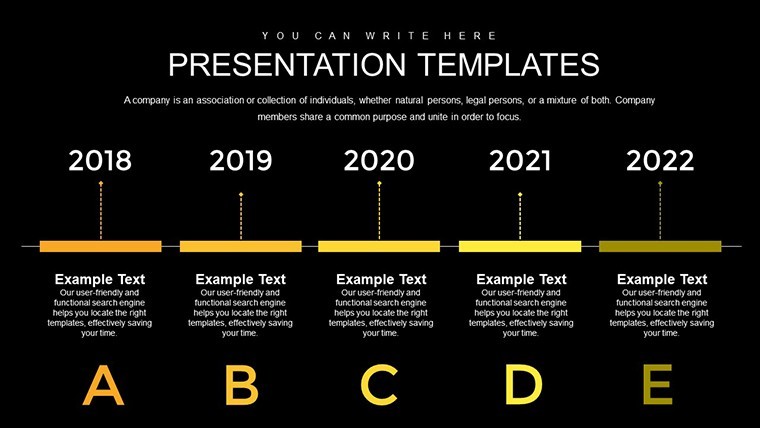
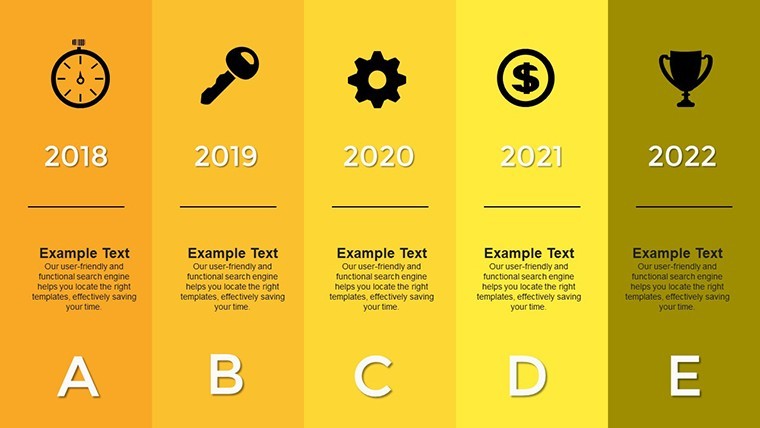
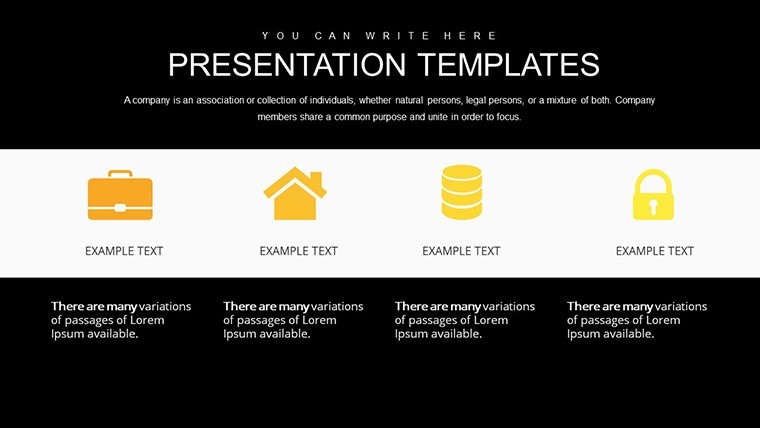
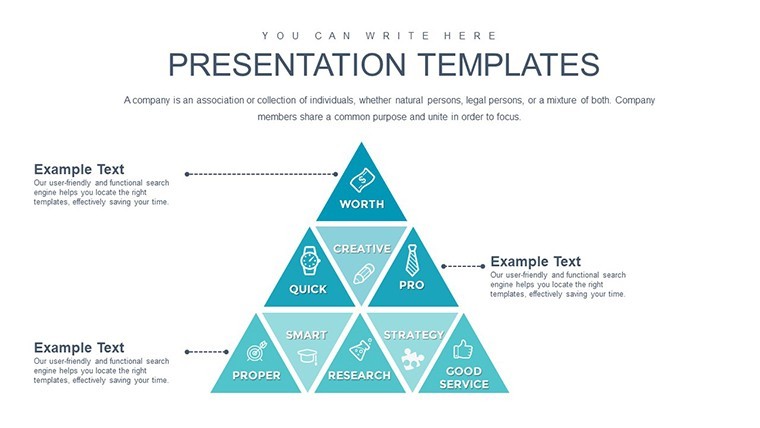
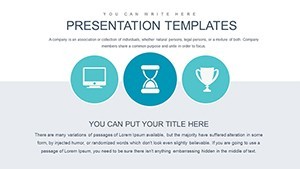
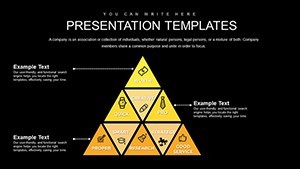
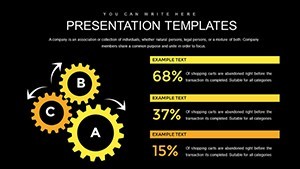
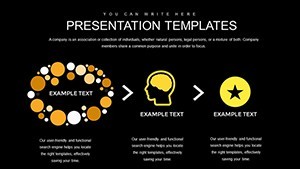
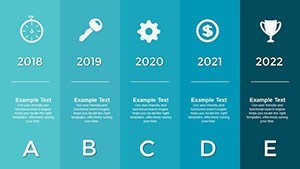
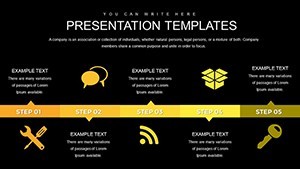
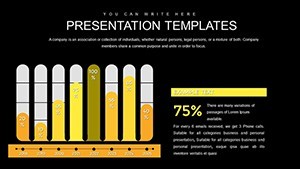
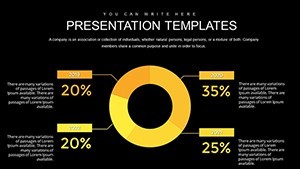
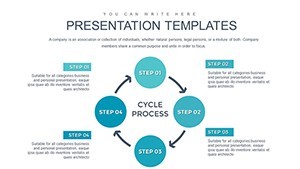
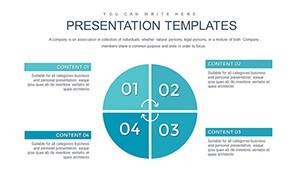
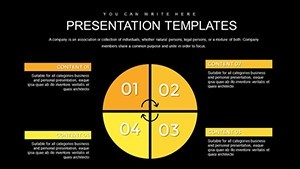
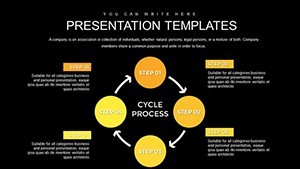
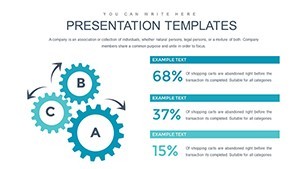
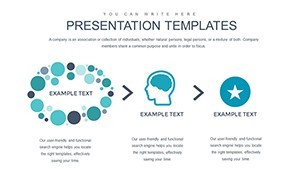
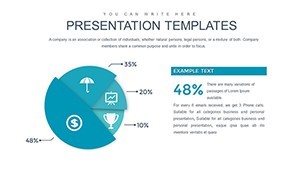
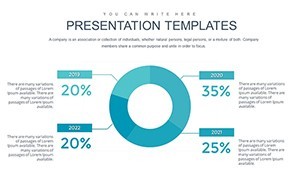
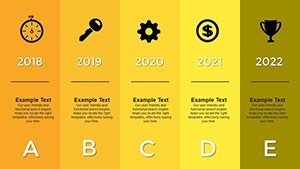
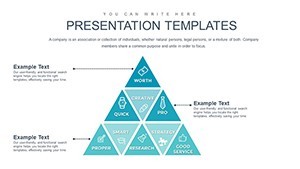
Infographics bridge the gap between data and understanding, and this template excels at that. Featuring diverse chart types like flow diagrams for processes, donut charts for proportions, and pyramid structures for hierarchies, it caters to business-specific needs. The color schemes - corporate blues, energetic oranges, and neutral grays - promote brand alignment while maintaining visual harmony. As per insights from Forbes' design contributors, such visuals can boost comprehension by 80%. In practice, use a slide to illustrate a business model canvas, with icons representing components like value propositions, making abstract strategies tangible and discussable.
Core Features Driving Presentation Excellence
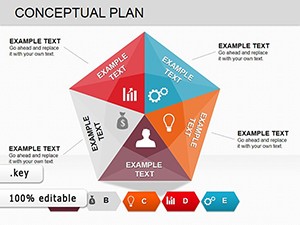
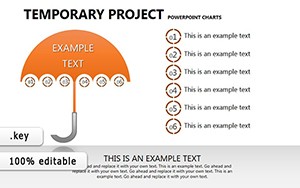
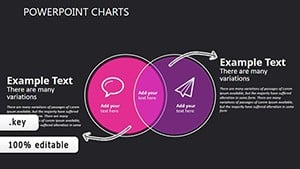
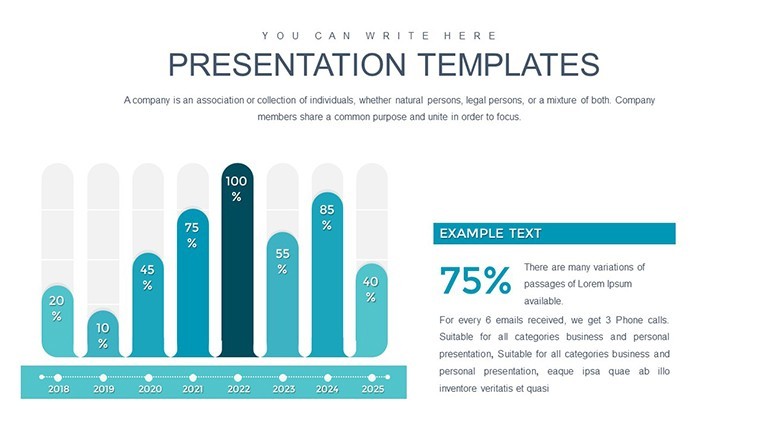
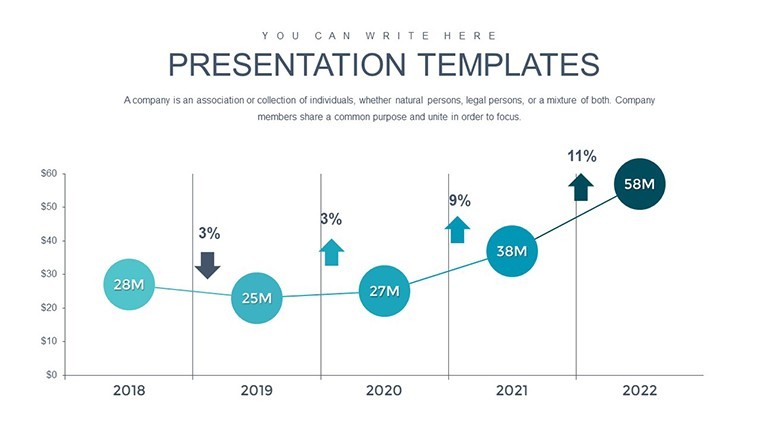
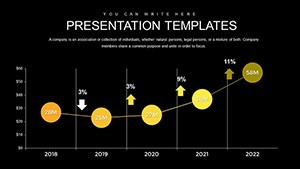
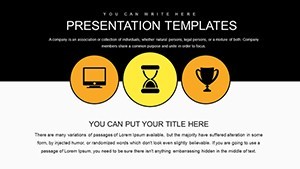
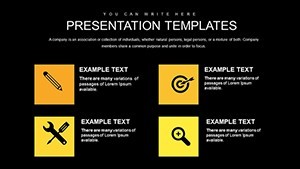
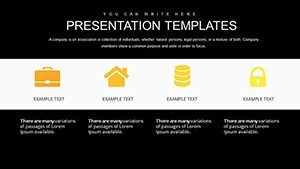
The template's strength lies in its user-centric features: fully customizable elements for personalization, vector-based graphics for sharp scaling, and intuitive placeholders for rapid content addition. It supports advanced customizations like gradient fills or shadow effects, elevating basic data to premium visuals. Notable inclusions: area charts for cumulative trends, Venn diagrams for overlaps in market segments, and gauge charts for performance metrics.
Comprehensive Slide Catalog
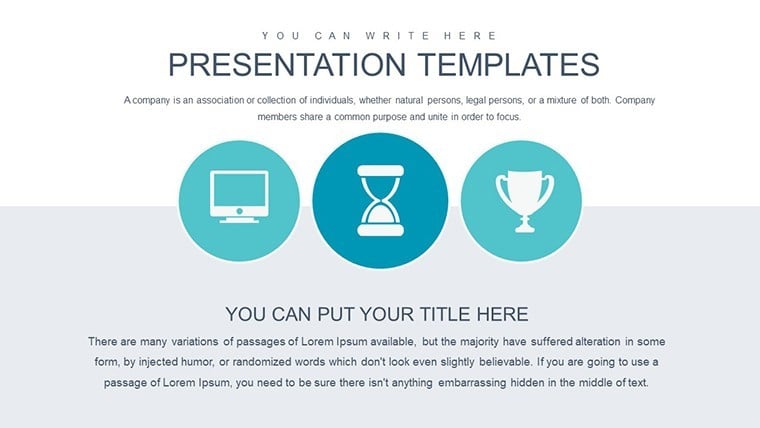
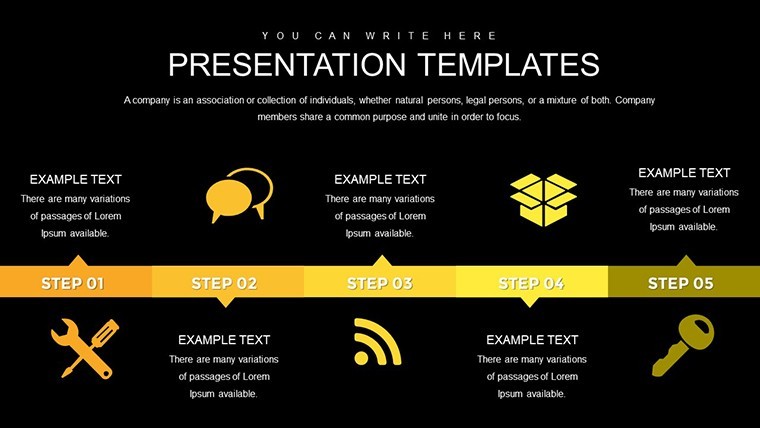
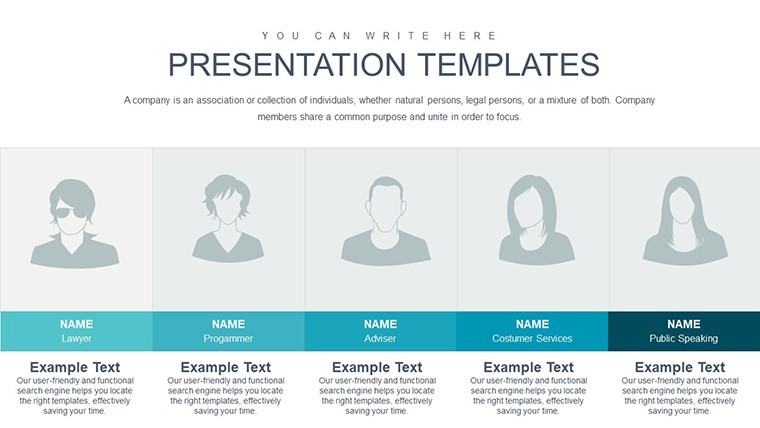
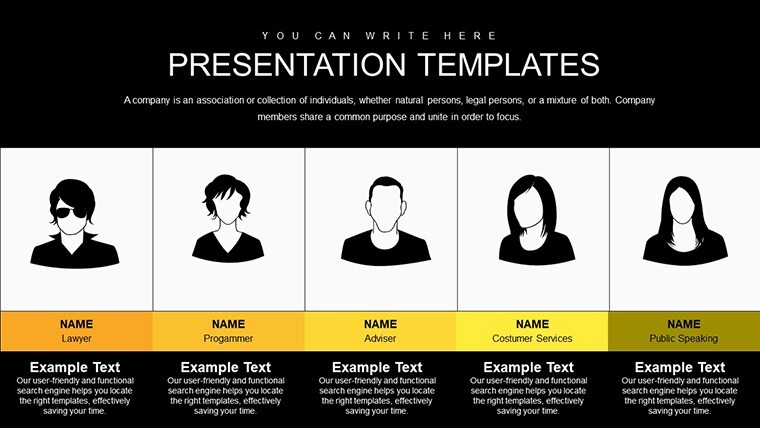
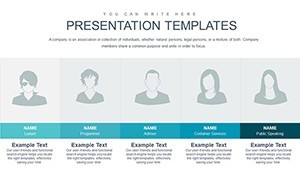
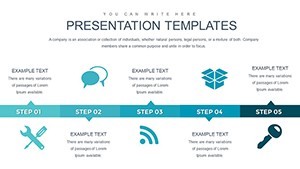
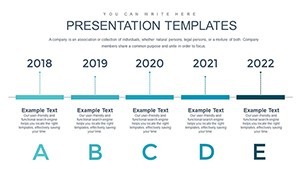
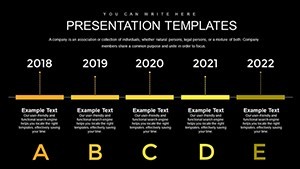
- Opening Slides (1-6): Title pages, agendas, and team intros with sleek infographic backdrops.
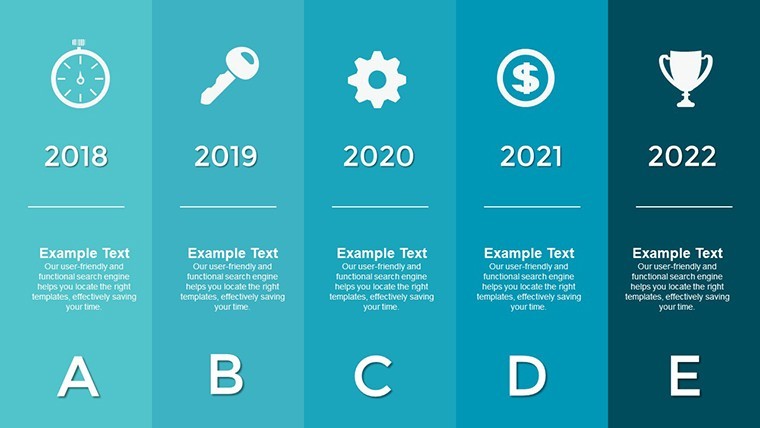
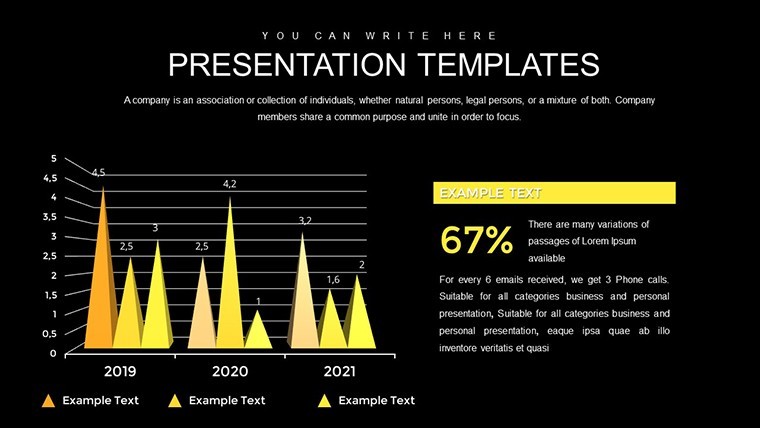
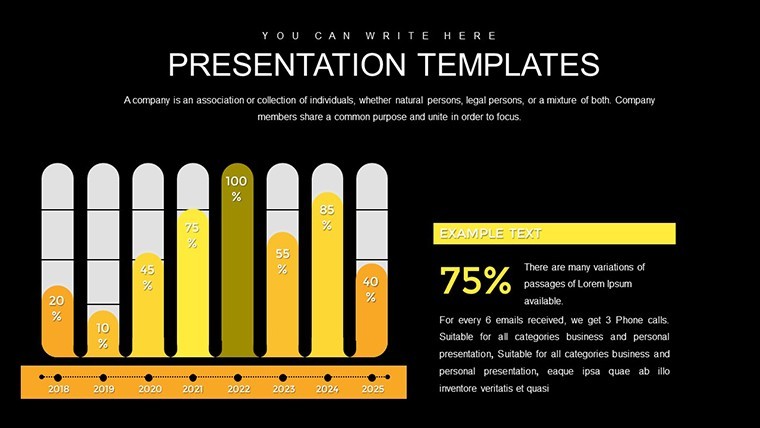
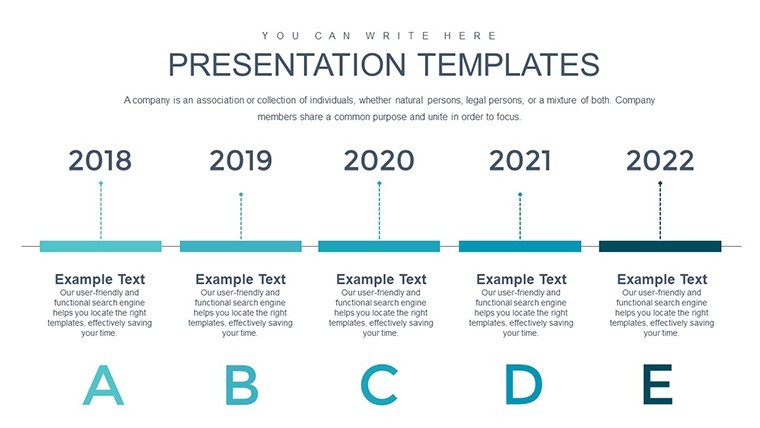
- Data Core Slides (7-22): Graphs and charts for financials, KPIs, and analytics.
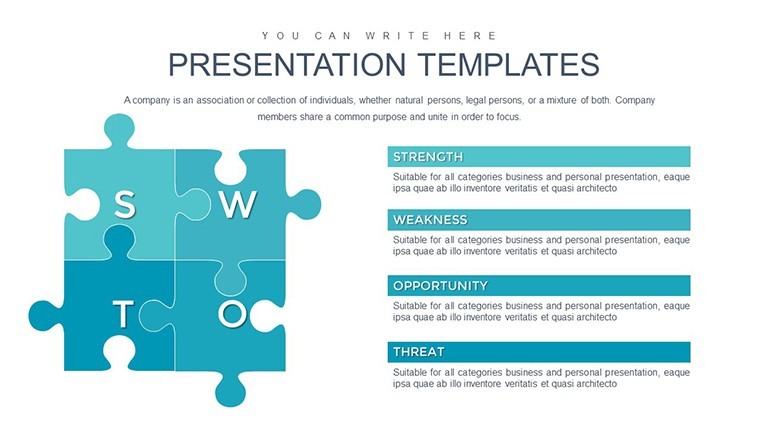
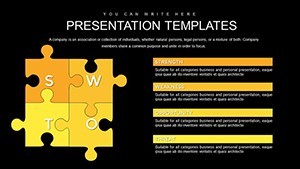
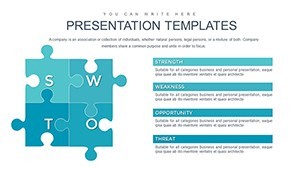
- Strategic Slides (23-30): Models like SWOT or PESTLE visualized intuitively.
- Wrap-Up Slides (31-36): Conclusions, next steps, and contact infographics.
This organization facilitates a logical flow, enhancing persuasive power.
Use Cases and Success Stories in Action
Entrepreneurs have utilized akin templates to secure investments, with visuals clarifying revenue models - echoing successes shared on Shark Tank analyses. Marketers deploy them for campaign recaps, highlighting ROI through engaging charts. Educators find them invaluable for case study breakdowns, fostering interactive learning. A step-by-step application: Select a slide, populate with data, refine aesthetics, add narratives, and present. Pro tips: Layer text overlays for emphasis and ensure color accessibility for diverse audiences, aligning with ADA guidelines.
Enhancing Your Business Workflow
- Launch in Keynote and browse slide options.
- Input metrics and watch auto-adjustments.
- Tailor designs to fit your branding.
- Incorporate feedback loops for iterations.
- Share or export in multiple formats.
These methods streamline creation, boosting productivity.
Seamless Compatibility and Advanced Tips
Works flawlessly with Keynote on Apple ecosystems, outshining free alternatives with its depth and polish. Optimize by minimizing text per slide and using consistent typography, as advised by presentation gurus like Nancy Duarte.
Unlock Your Data's Potential Today
Embrace the Business Infographic Keynote Charts Template to craft presentations that inspire action. It's your key to visual mastery - download now and elevate your business communications.
Frequently Asked Questions
What chart varieties are in this template?
A mix including flows, donuts, pyramids, and more for business data.
Can I customize colors and fonts?
Yes, full editing freedom in Keynote.
Ideal for which professionals?
Business leaders, marketers, educators, entrepreneurs.
Supports high-res exports?
Absolutely, for prints or digital shares.
How does it handle complex data?
Through layered infographics that simplify intricacies.
Better than built-in Keynote tools?
Yes, with professional designs and efficiency gains.