Desired Result Keynote Charts for Marketing Research


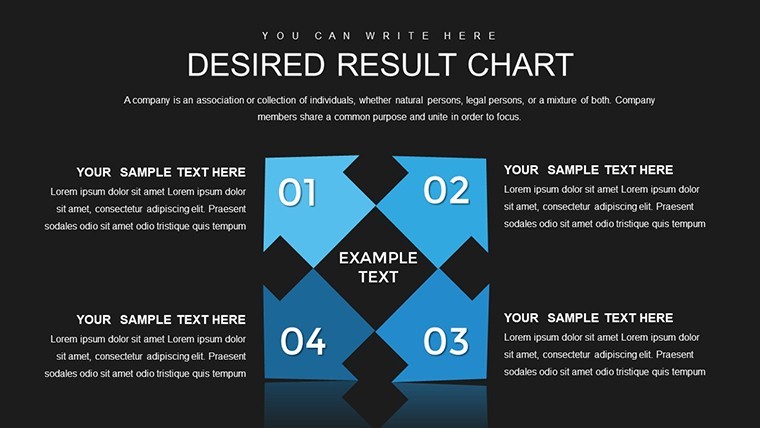


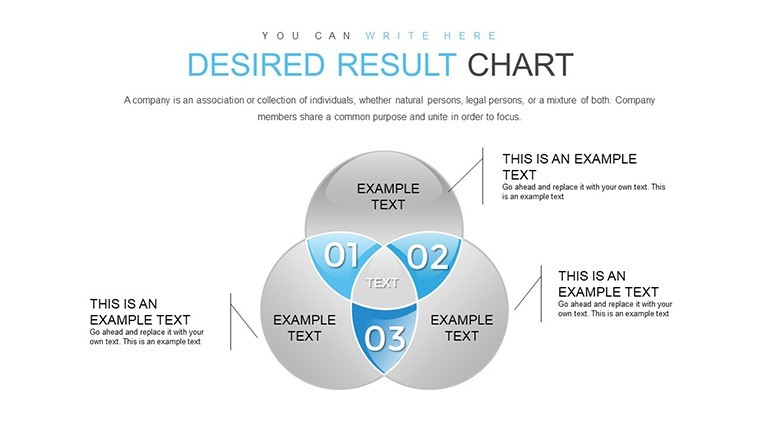
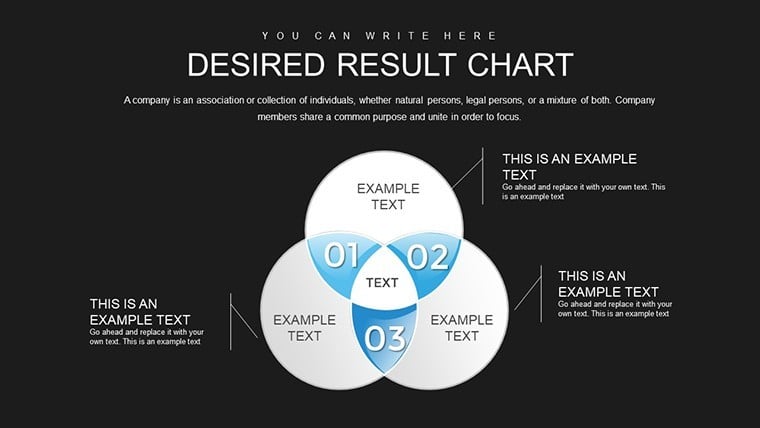

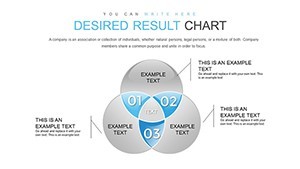


Reaching the pinnacle of marketing research demands a finale that's as polished as it is insightful. The Desired Result Keynote charts template delivers exactly that with 28 editable slides, ideal for compiling comprehensive technical reports. Focused on Venn and analysis elements, this tool helps you present findings with clarity and conviction. Marketers, researchers, and consultants will find it invaluable for wrapping up studies, where visualizing end goals and intersections turns data into decisive strategies.
Think of culminating a campaign analysis: Use Venn overlaps to show aligned objectives and pieced-together insights. From my vantage as a copywriter versed in market dynamics, this aligns with methodologies from the Market Research Society (MRS), emphasizing accurate representation. It's more than a template - it's a bridge to desired outcomes, enhancing presentations with professional flair that builds trust and drives decisions.
Core Features Driving Research Excellence
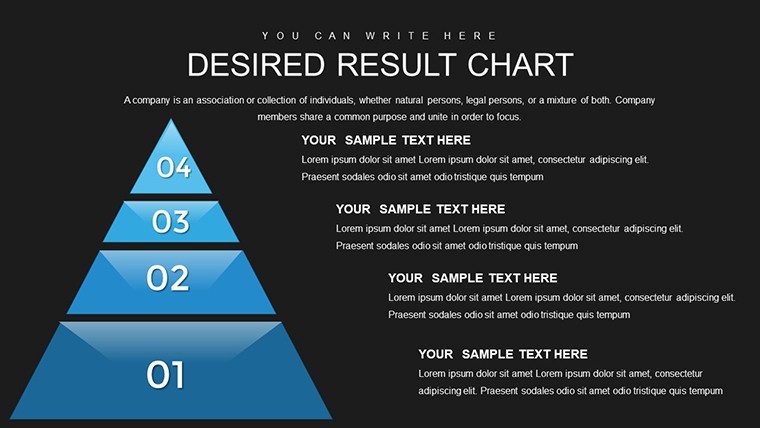
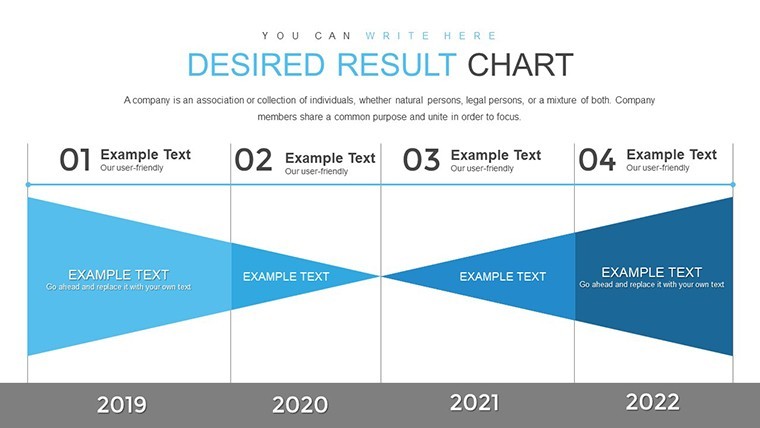
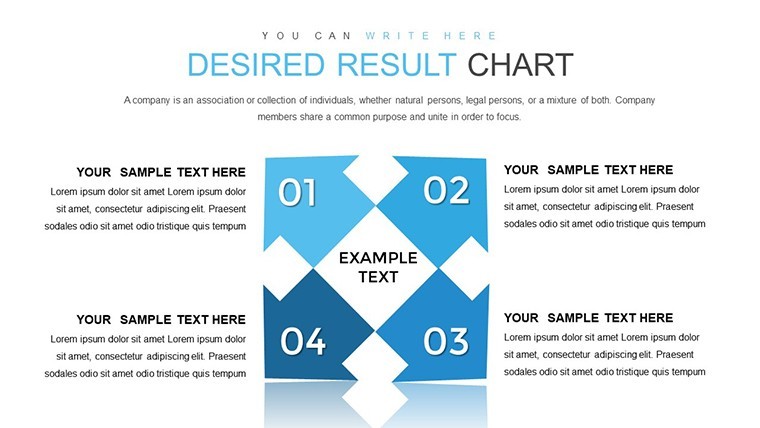
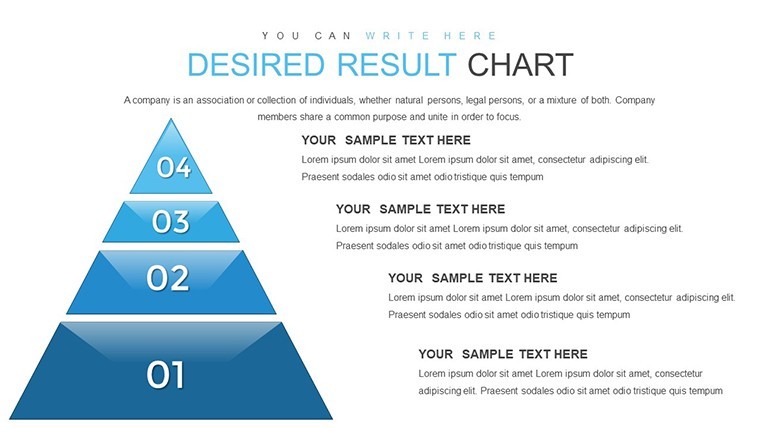
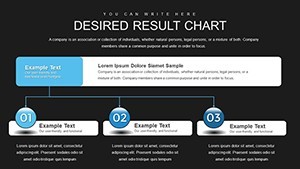
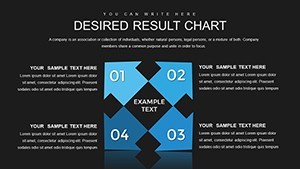
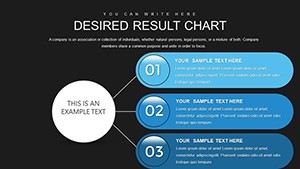
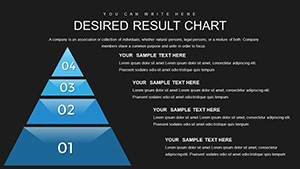
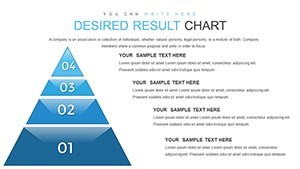
Built for precision, the features include Venn diagrams for comparisons and analytical charts for depth, across 28 slides.
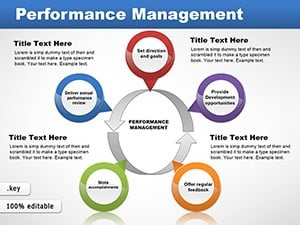
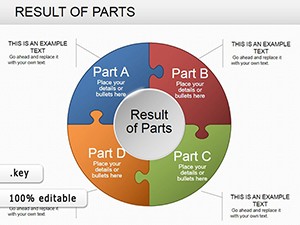
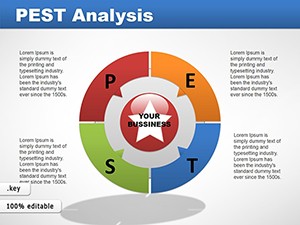
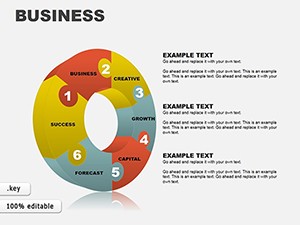
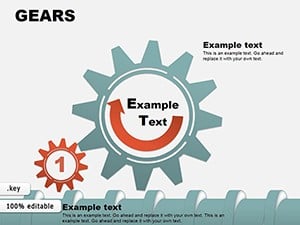
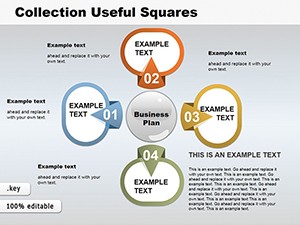
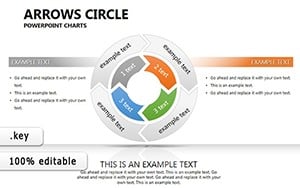
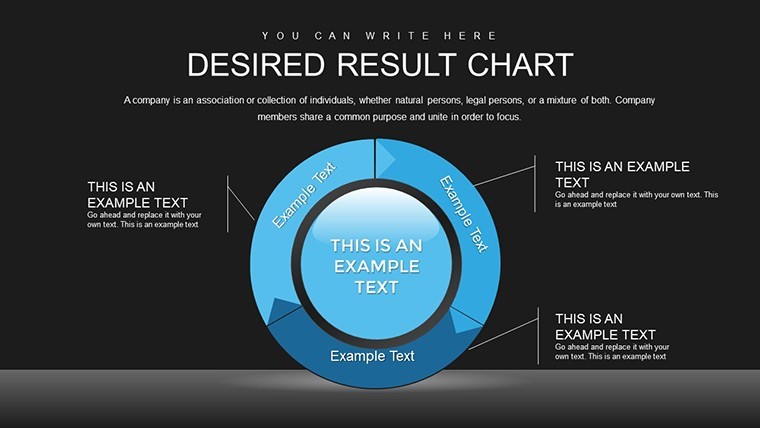
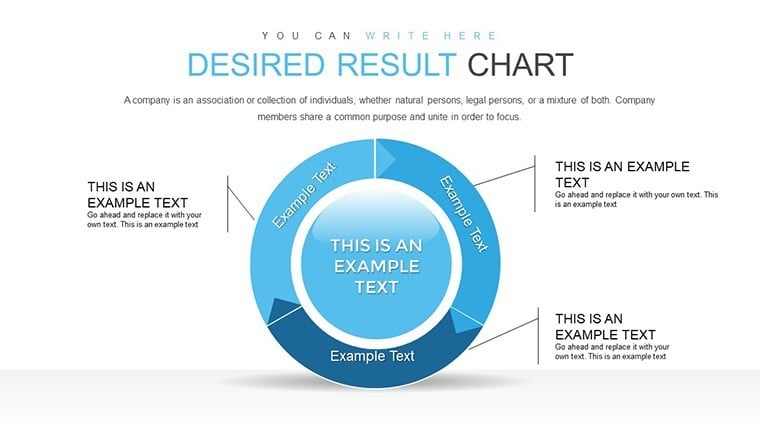
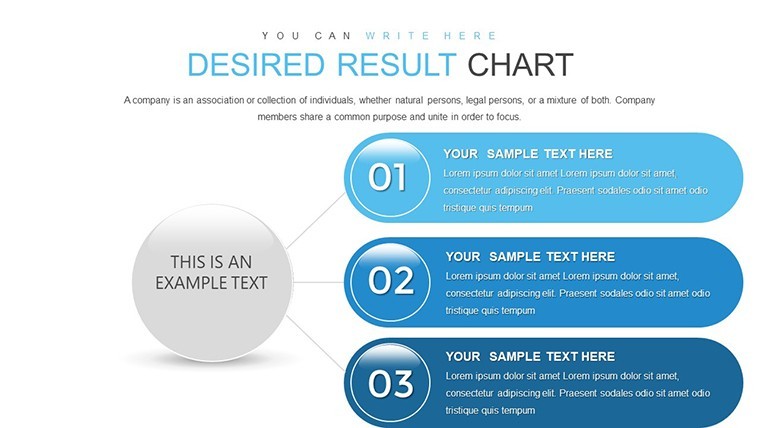
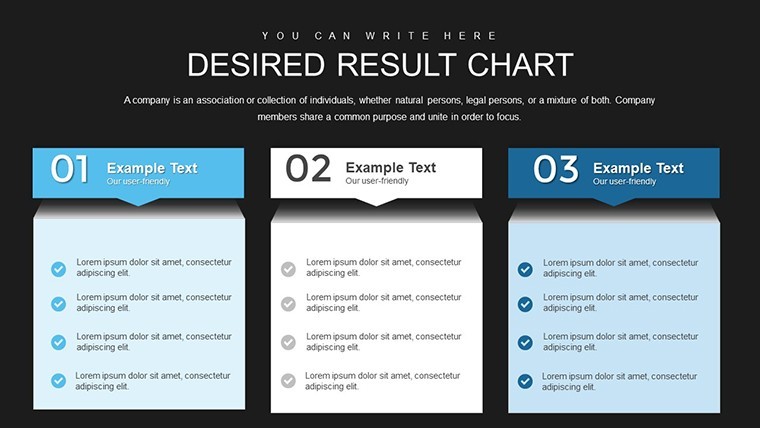
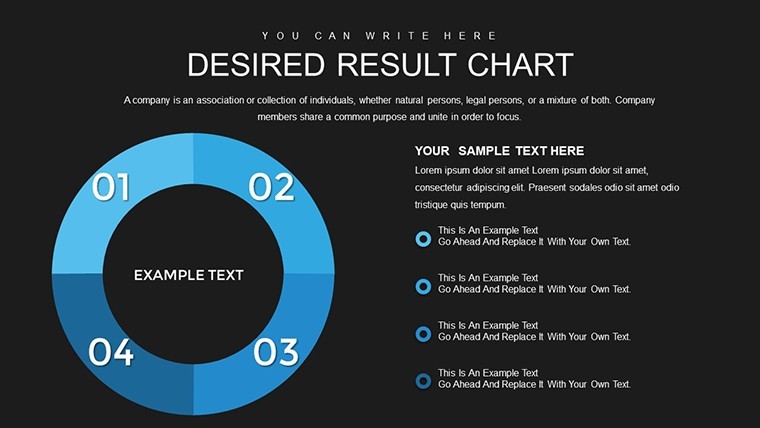
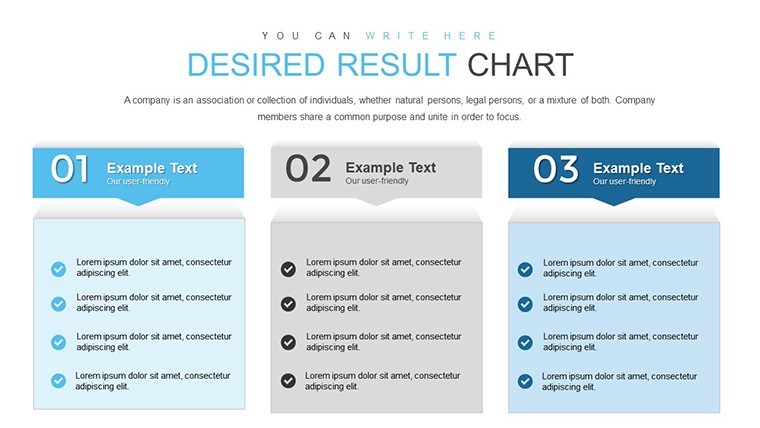
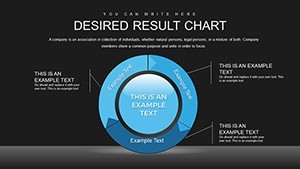
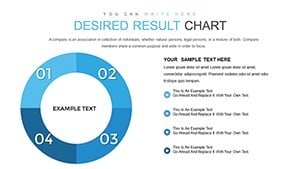
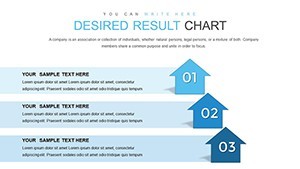
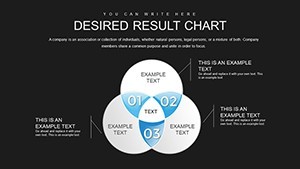
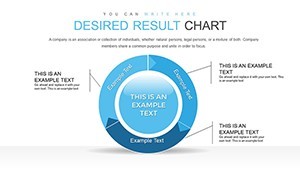
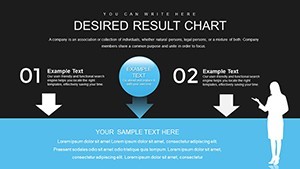
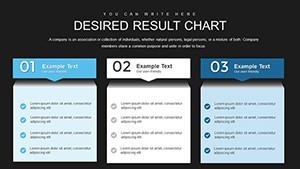
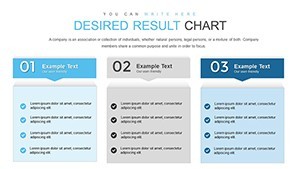
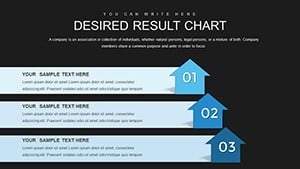
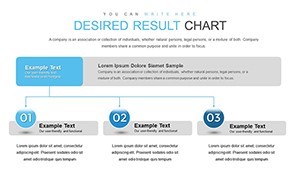
- Venn-Focused Designs: Highlight intersections in research data.
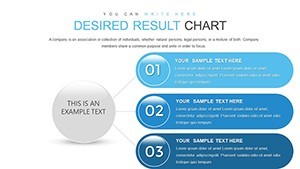
- Analysis Tools: Tables and graphs for metric breakdowns.
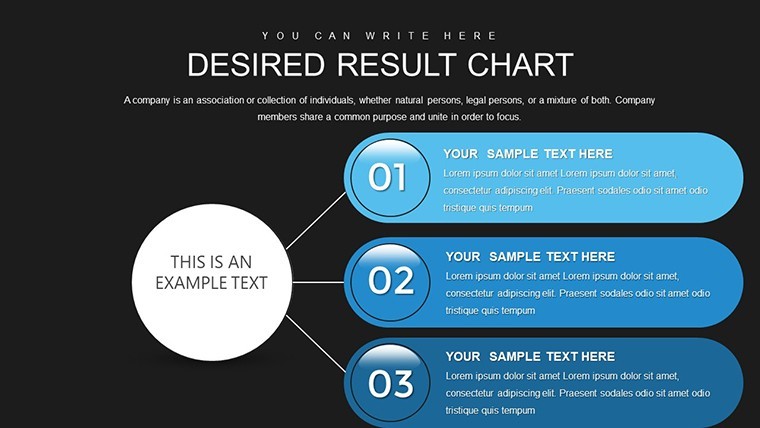
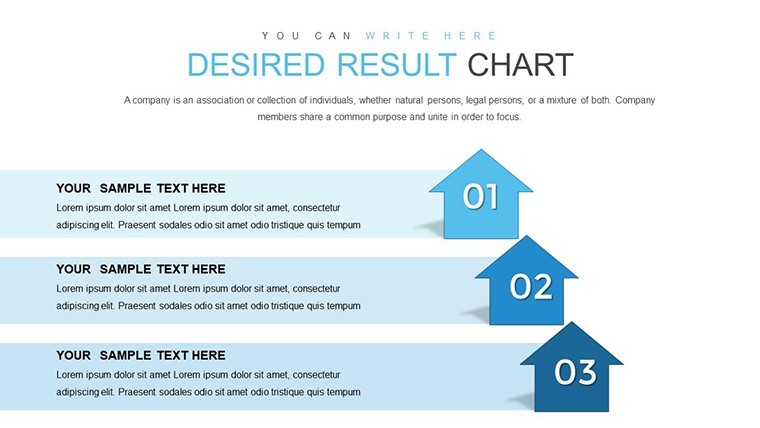
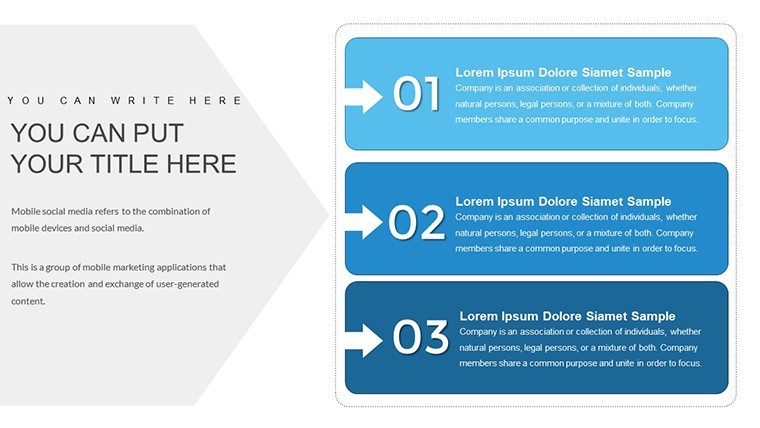
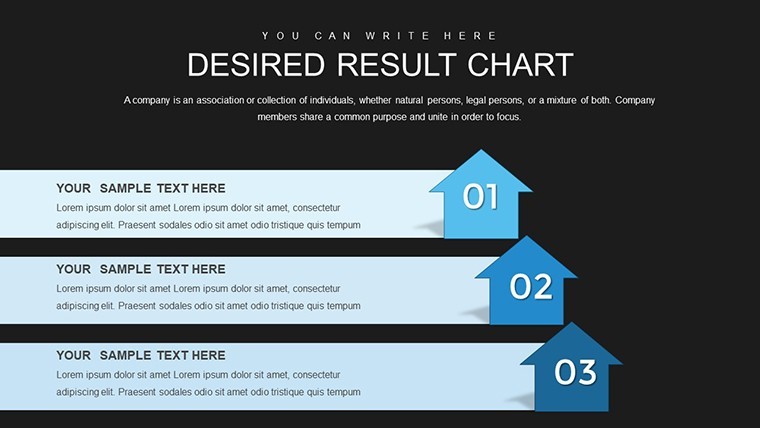
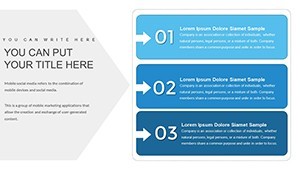
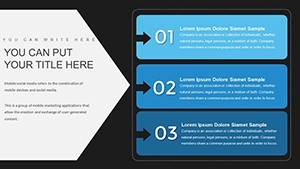
- Full Editability: Tailor to specific report needs.
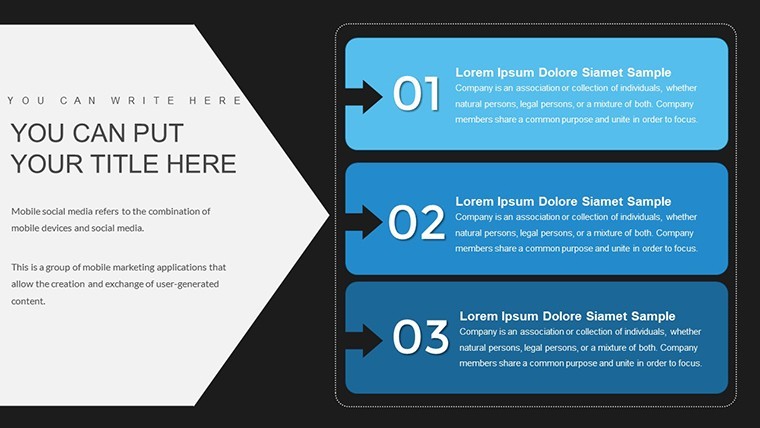
- Report-Ready Layouts: Structured for technical documentation.
These echo standards from Nielsen's research guidelines, ensuring authoritative outputs. Case in point: A brand used Venn charts to finalize consumer insights, refining product launches successfully.
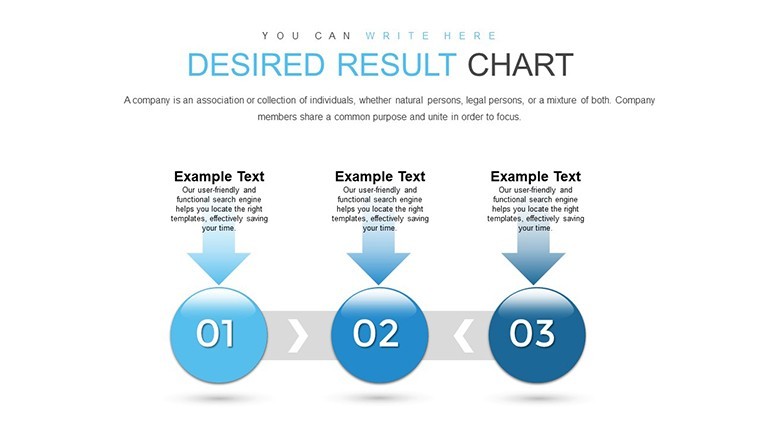
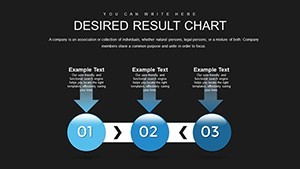
Slide-by-Slide Insights
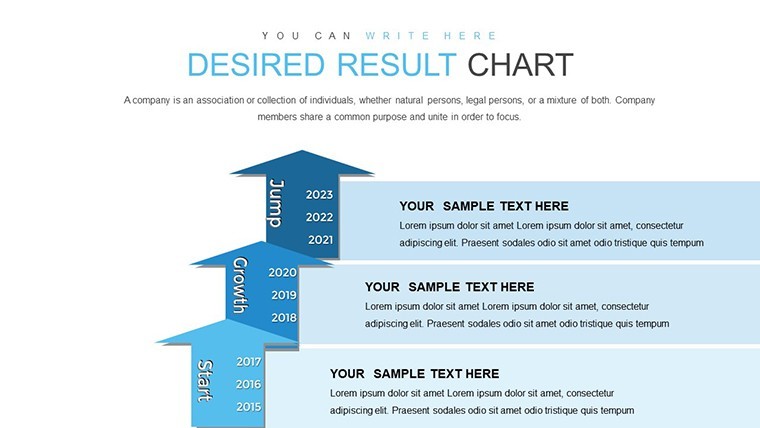
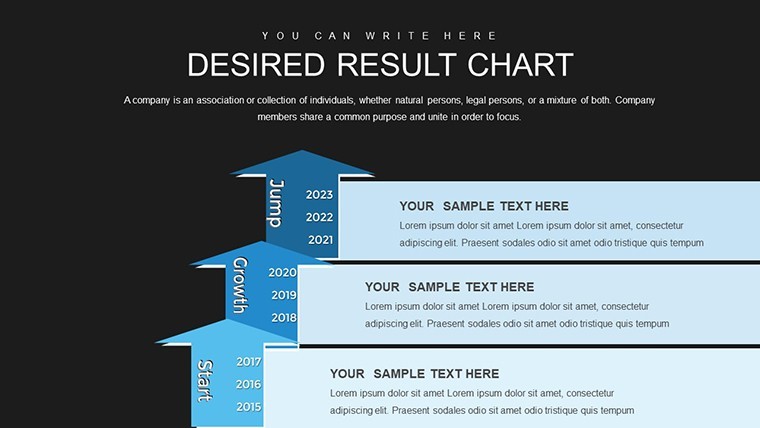
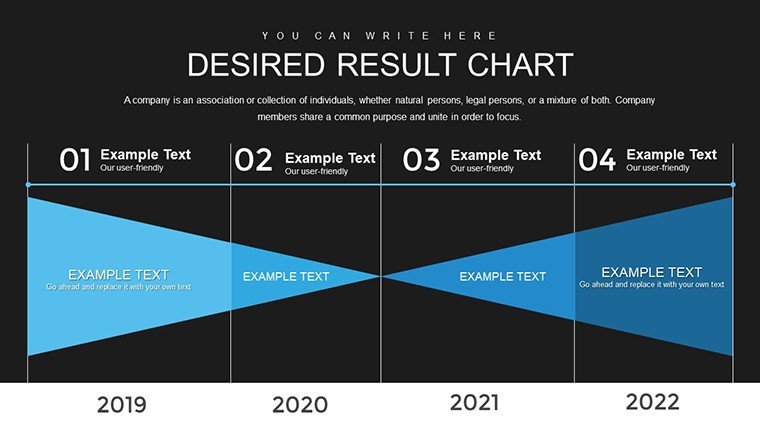
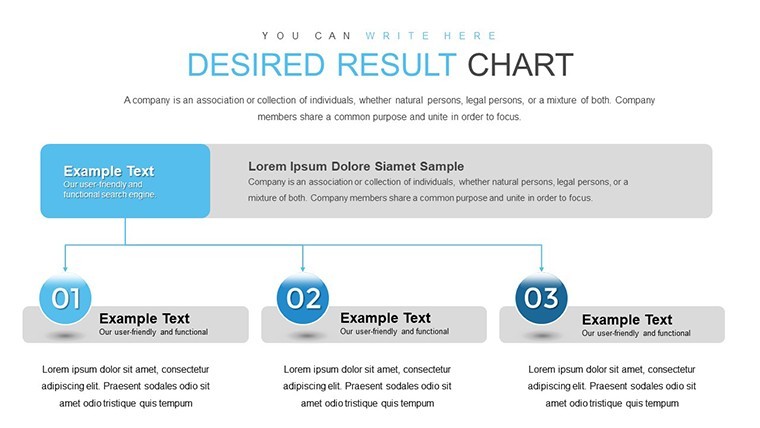
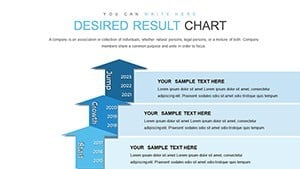
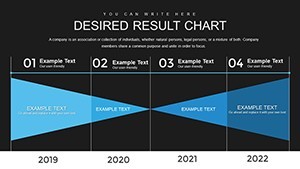
Intro slides set research context, core ones (10-20) feature Venn for result overlaps and charts for trends, finales summarize with action plans. Designs prioritize readability, fostering through structured flow.
Targeted Use Cases in Marketing
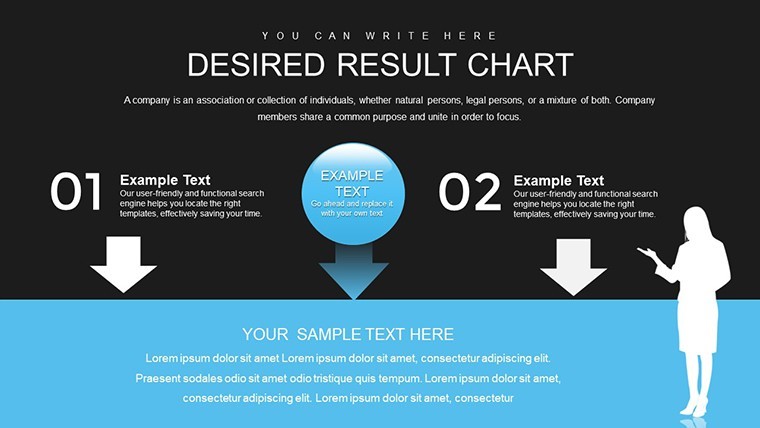
Excel in final research phases: Campaign evaluations, consumer behavior reports.
- Report Compilation Steps: Aggregate data in Venns, analyze trends, visualize results, append recommendations.
- Stakeholder Reviews: Use charts to justify strategies.
- Training Sessions: Teach research closure techniques.
Backed by Journal of Marketing insights, these applications yield results. Example: Agency finalized a study with these, boosting client retention - picture the triumph of a "desired result" achieved, with a witty twist on exceeding expectations.
Optimization Strategies for Results
Enhance with data validation, thematic consistency, MRS-compliant ethics, and feedback loops. These build expertise and trustworthiness.
Achieve your marketing zenith - secure this template and deliver results that matter.
Frequently Asked Questions
- Ideal for which research stage?
- Final stages, for technical reports.
- Venn customization options?
- Extensive - edit shapes, data, colors.
- Suitable for team collaborations?
- Yes, shareable in Keynote.
- How to integrate external data?
- Import via copy-paste or links.
- File specifics?
- .key for Keynote compatibility.
- Any report templates included?
- Slides structured as full reports.