Reading Books Keynote Template: Infographics That Inspire Literacy


Type: Keynote Charts template
Category: Illustrations
Sources Available: .key
Product ID: KC00843
Template incl.: 18 editable slides
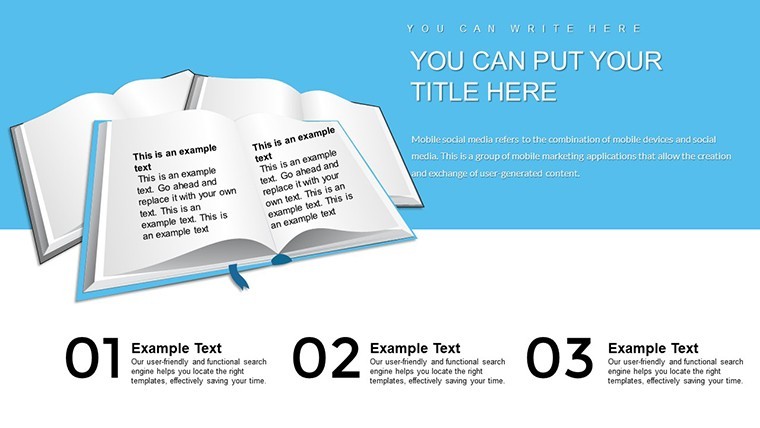
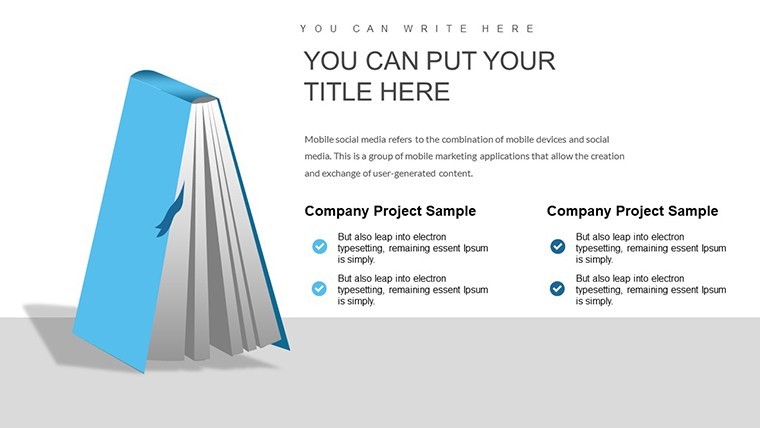
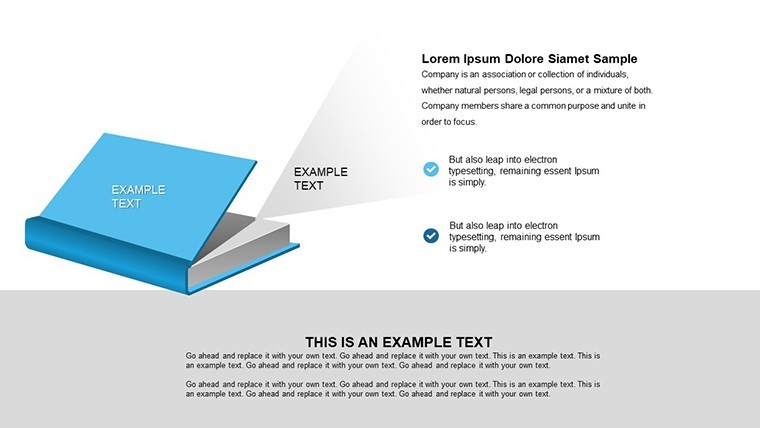
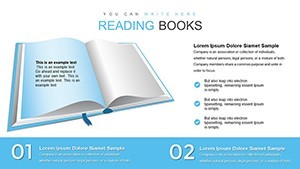
Books open worlds, and presenting their value shouldn't be confined to words alone. The Reading Books Keynote template brings literacy and education to life through 18 editable infographic slides, crafted for educators, librarians, and professionals who aim to promote reading in engaging ways. Whether you're advocating for library programs or teaching literature analysis, this template turns data on reading habits, benefits, and trends into vibrant visuals. Envision slides that not only display statistics but weave narratives around the joy of reading, helping your audience - be it students, parents, or colleagues - appreciate books' transformative power. It's more than a template; it's a catalyst for fostering lifelong learning habits.
The Art of Engaging Infographics in Education
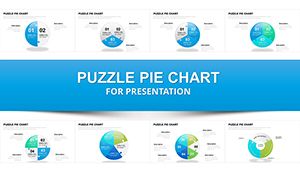
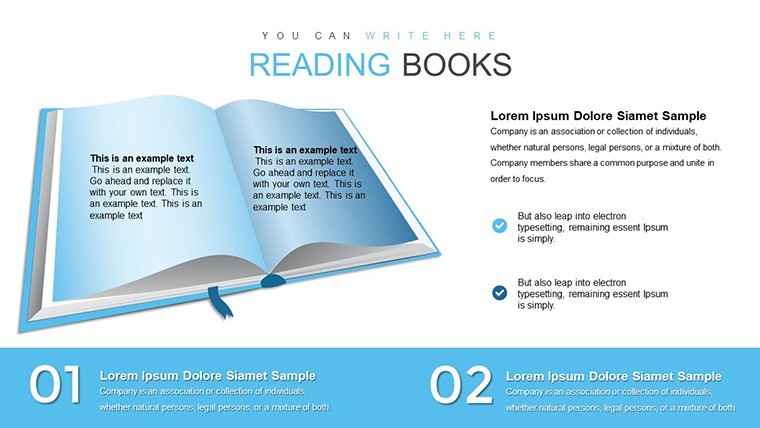
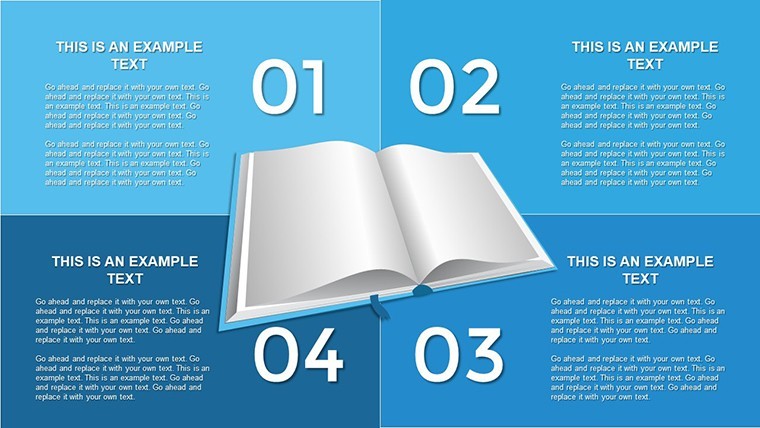
Infographics excel at distilling complex information, and this template leverages that for reading-themed content. Aligned with educational standards from bodies like the International Literacy Association, it features designs that highlight book genres, reading statistics, and motivational elements. Move past dull lists; use these slides to create timelines of literary history or pie charts showing genre preferences, all with a touch of whimsy to keep viewers hooked. The minimalist to vibrant options ensure versatility, suiting formal lectures or interactive workshops alike.
Core Features for Creative Customization
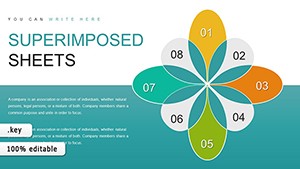
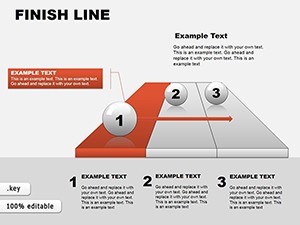
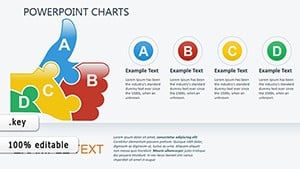
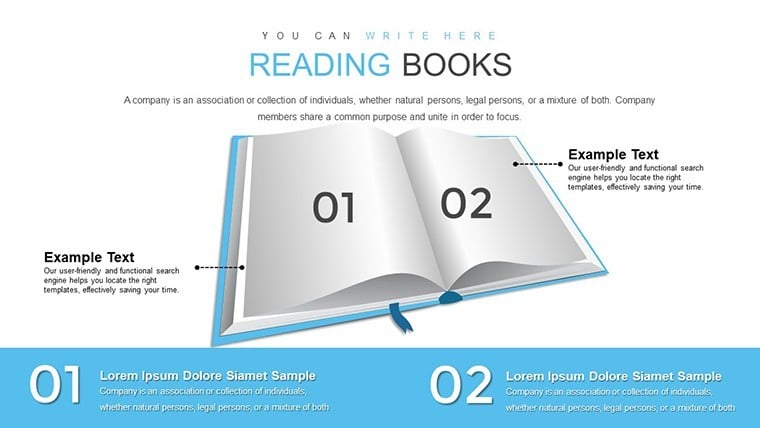
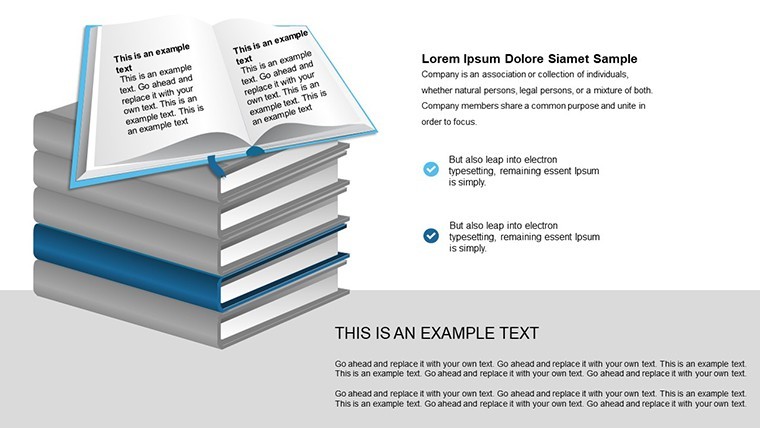
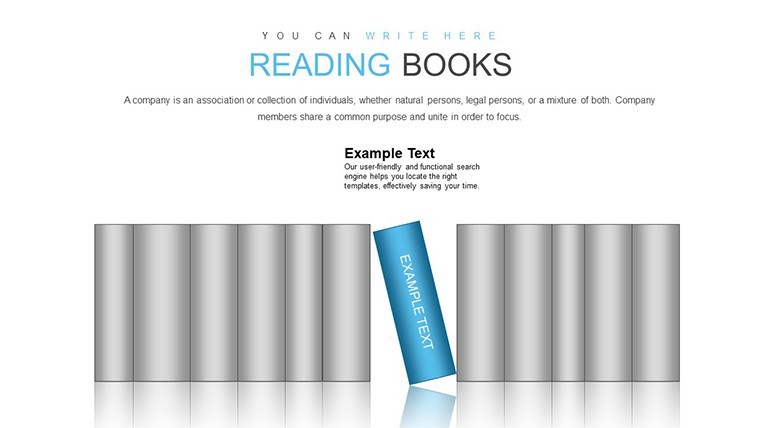
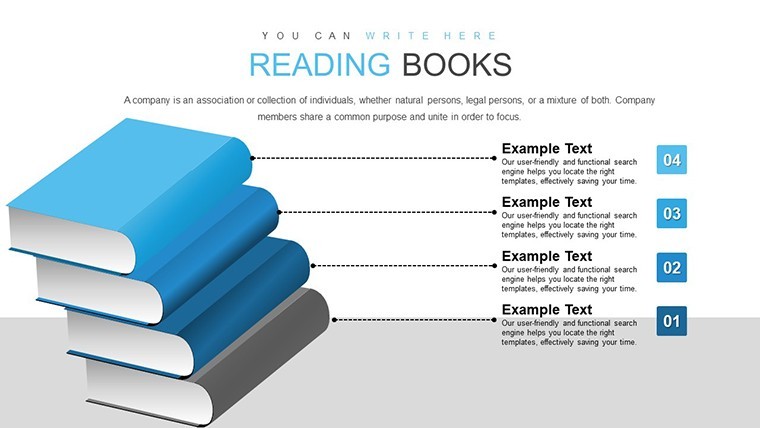
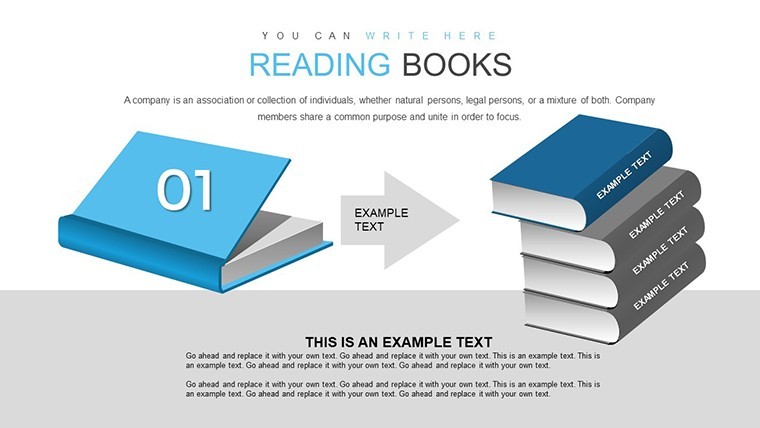
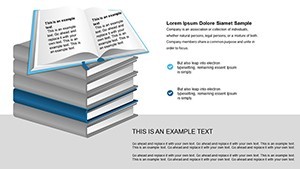
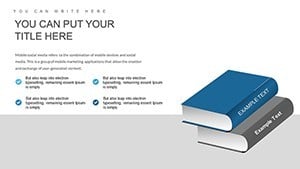
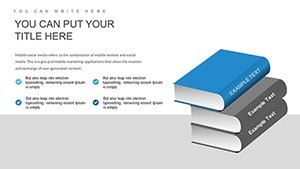
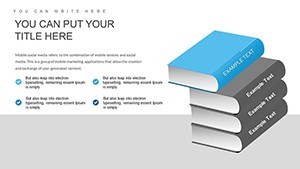
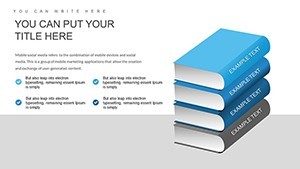
- 18 Diverse Slides: From book stacks visuals to progress trackers for reading goals.
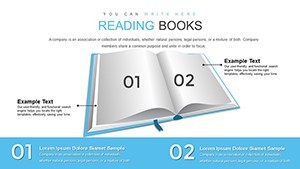
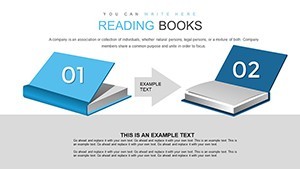
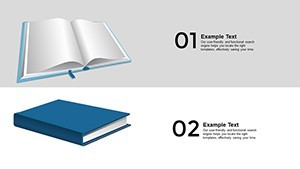
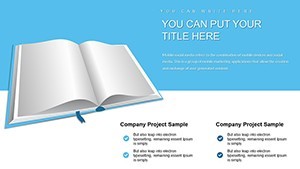
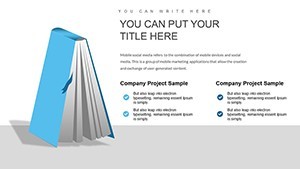
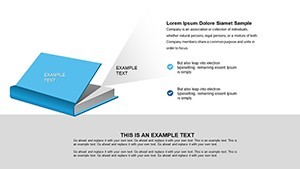
- Varied Layouts: Minimalist for clean stats, colorful for youth-oriented presentations.
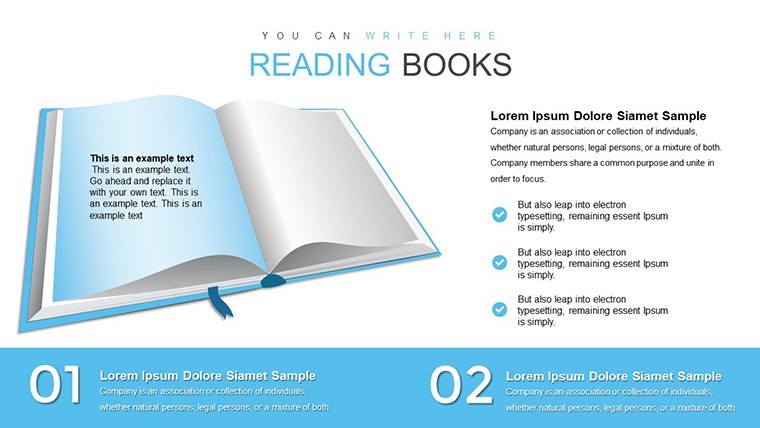
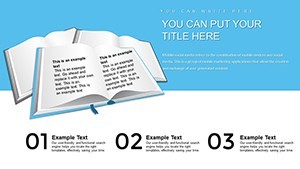
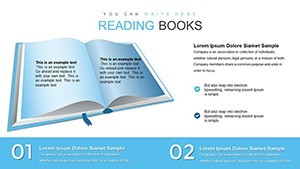
- Icon Integration: Book-related graphics that enhance thematic relevance.
- Full Editability: Adjust in Keynote with .key format for quick tweaks.
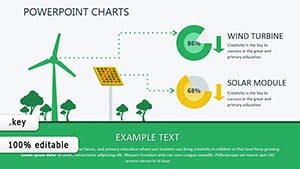
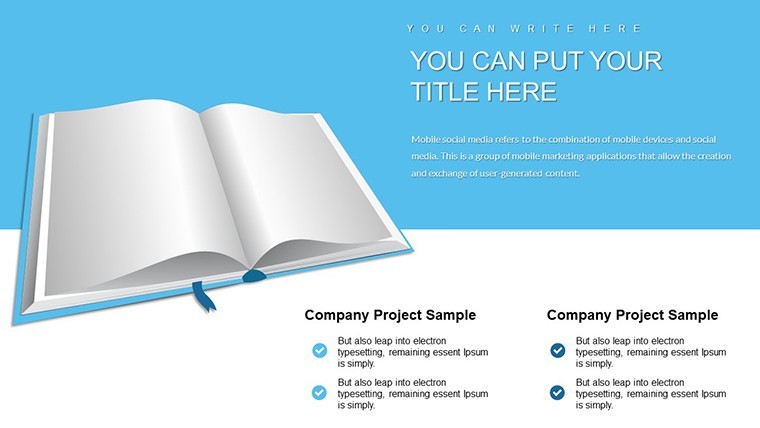
- Data-Driven Elements: Easy-to-update charts for fresh insights.
These are inspired by successful educational tools, ensuring they meet real classroom needs.
Use Cases: Sparking Interest in Reading Across Scenarios
An educator might use this for a back-to-school assembly, illustrating how reading boosts cognitive skills with infographics backed by studies from the National Endowment for the Arts. In corporate training, highlight professional development through book clubs, showing ROI via engagement metrics. Librarians can promote events with visuals on community reading trends. Unlike basic slides, this template offers pre-designed harmony, saving time while amplifying message delivery - as seen in case studies where visual aids increased participant retention by 40%.
Step-by-Step: Building Your Reading Presentation
- Select the template in Keynote and choose a slide that fits your topic.
- Insert your data, like reading hours per demographic, into infographic placeholders.
- Customize colors and fonts to align with your institution's branding.
- Add personal touches, such as quotes from authors like J.K. Rowling.
- Apply subtle animations for reveal effects on key stats.
- Share via export or present directly for immediate impact.
Integrate with apps like Goodreads for real-time data, enhancing interactivity.
Captivating Audiences with Visual Storytelling
The template's infographics go beyond charts, incorporating elements like illustrated book paths to represent reader journeys. This addresses engagement drops in traditional talks, using visuals to make data relatable. For example, in a literacy campaign, depict global reading rates with maps, drawing from UNESCO reports for authority. The result is presentations that not only inform but motivate action, like encouraging book challenges.
Tips to Make Your Slides Unforgettable
- Use high-contrast visuals for accessibility.
- Incorporate humor with light book puns in captions.
- Layer information to build curiosity.
- Test with peers for feedback.
- Pair with handouts for reinforced learning.
From veteran teachers, these enhance educational outcomes.
Download and Ignite Reading Passion Now
For $15, gain a tool that elevates your advocacy. Users love how it turns stats into stories. Begin your journey - customize and inspire today.
Frequently Asked Questions
How do I update the infographics?
Simply edit placeholders in Keynote for instant refreshes.
Suitable for virtual teaching?
Yes, optimized for screen sharing with clear visuals.
Can I add videos?
Absolutely, embed clips of book readings easily.
What if I want more colors?
Unlimited customization via Keynote's tools.
Is it for beginners?
Yes, intuitive design for all skill levels.