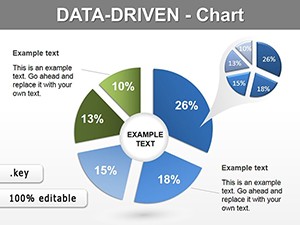
Communication Keynote Charts Template


Type: Keynote Charts template
Category: Illustrations
Sources Available: .key
Slide size: widescreen (16:9)
Product ID: KC00826
Template incl.: 24 editable slides
Understanding clients isn't surface-level - it's about unraveling the web of challenges, influences, and aspirations that shape their world. Our Communication Keynote charts template provides 24 editable slides to do just that, offering in-depth visualizations for problem analysis, factor mapping, and performance linkages. Perfect for marketers, consultants, and customer success teams, this tool illuminates paths to better decisions. Grounded in client-centric frameworks from "This Is Marketing" by Seth Godin, it empowers you to turn data into empathetic, actionable stories that resonate and resolve.
Illuminating Client Relationships Through Charts
This template excels by focusing on the intricate ties between problems, purposes, and outcomes, far beyond basic diagrams. Its illustrations category shine with widescreen designs that capture nuances, unlike simplistic Keynote defaults. For agencies like Ogilvy, where client understanding drives campaigns, these charts provide the depth needed to showcase insights authoritatively, building trust through comprehensive visuals.
Highlight Features for Client-Centric Analysis
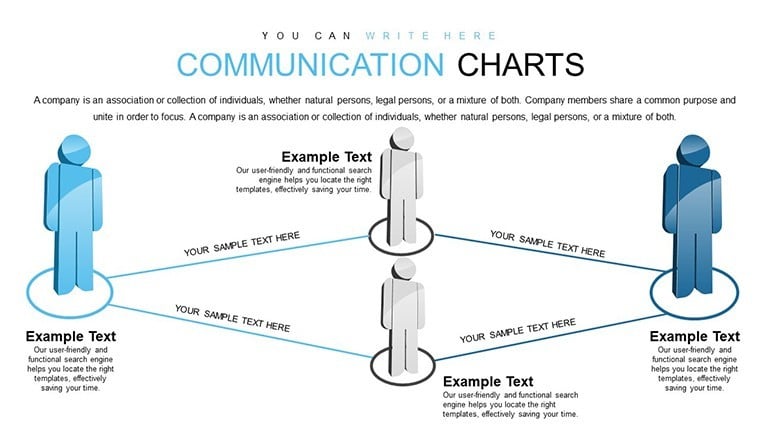
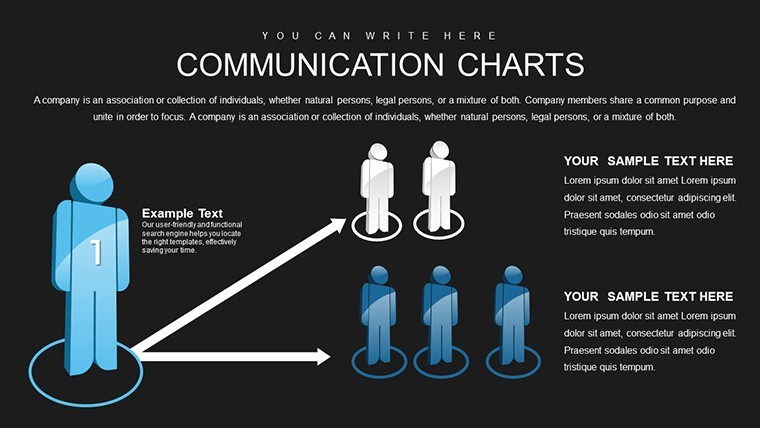
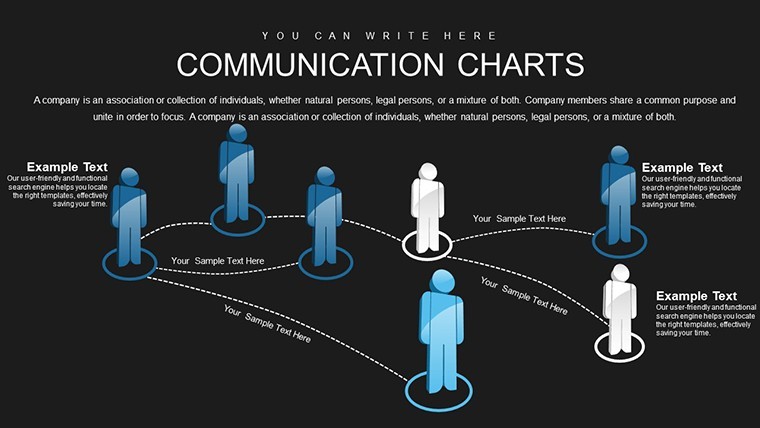
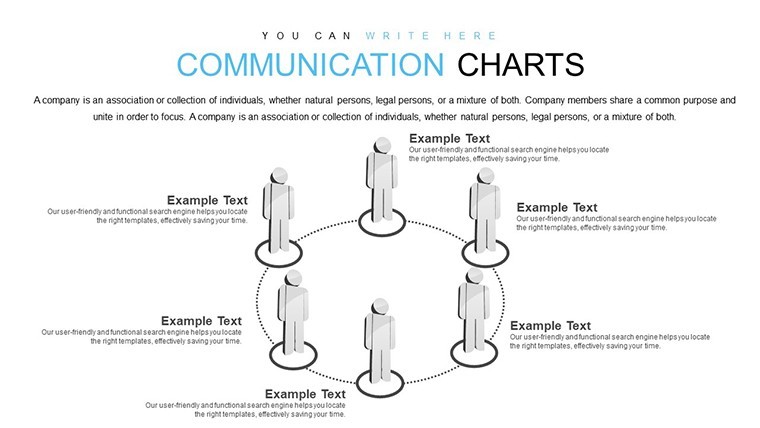
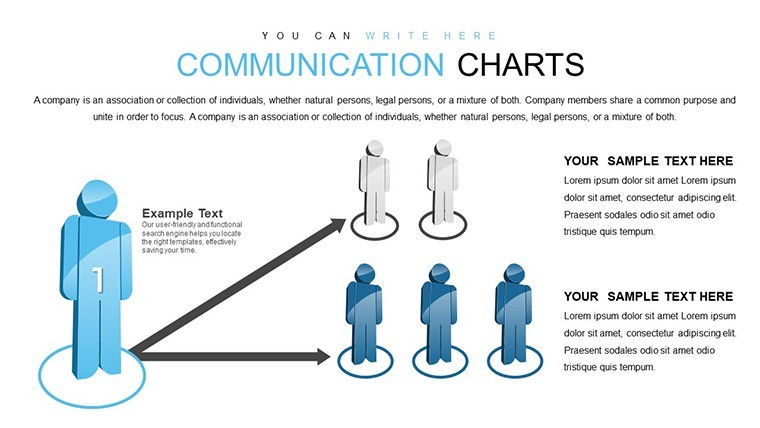
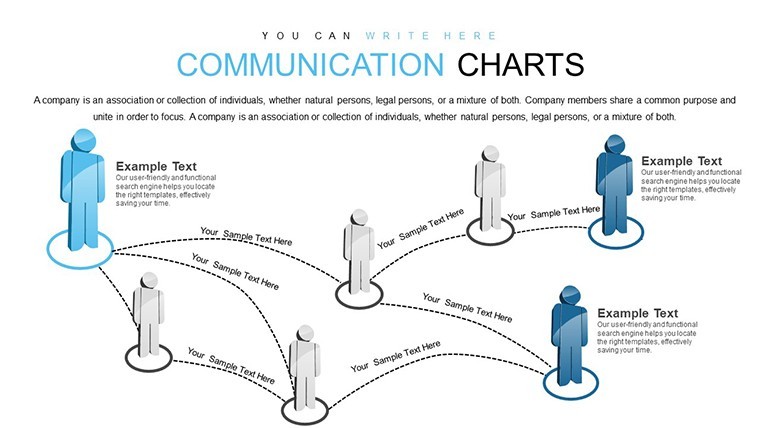
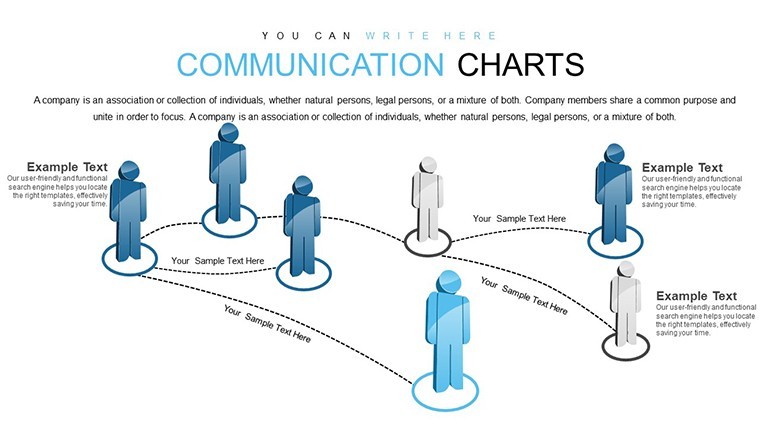
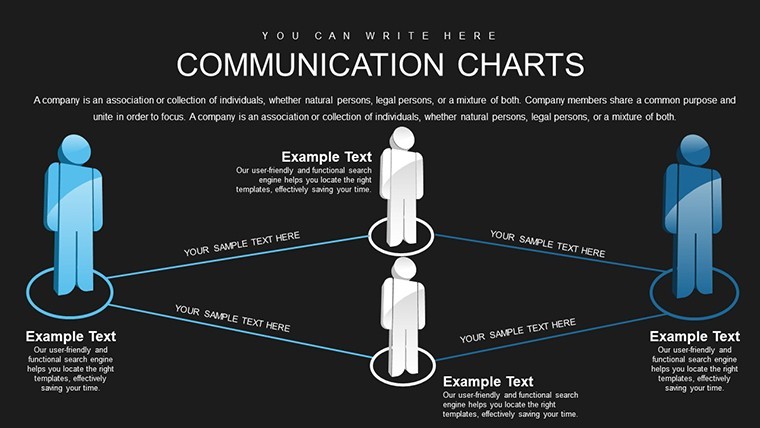
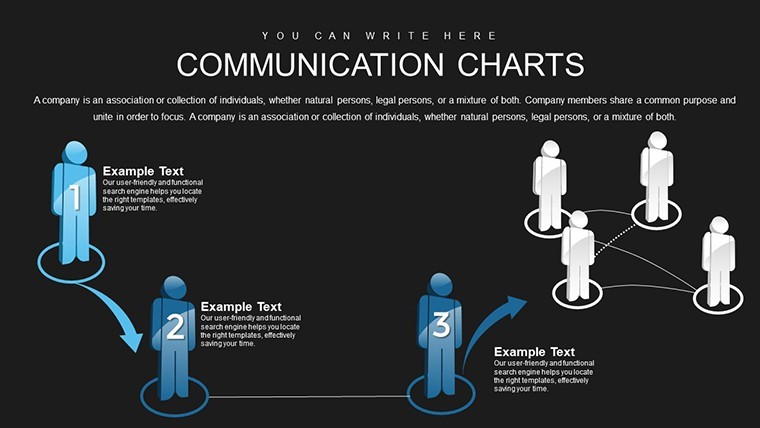
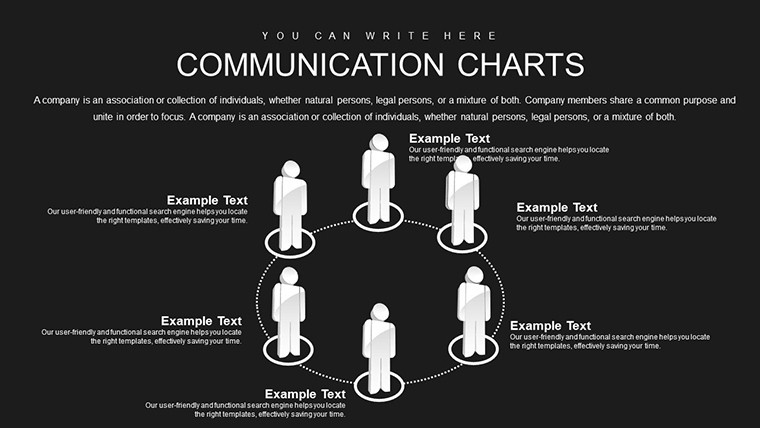
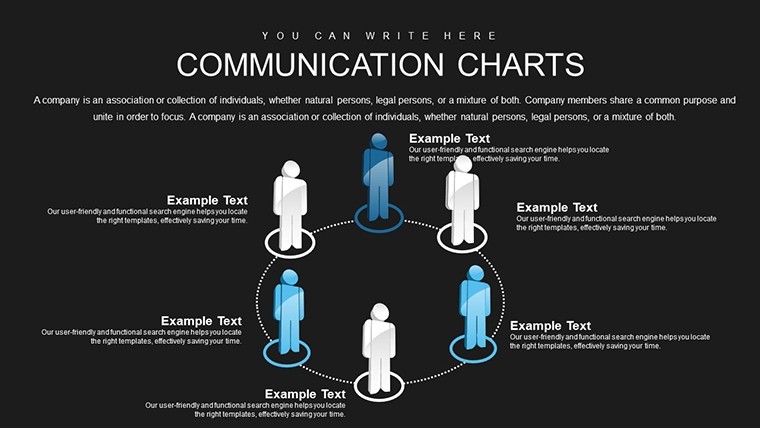
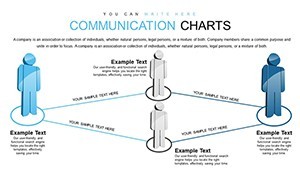
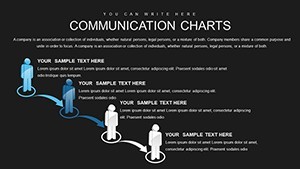
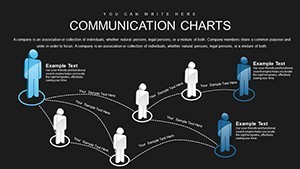
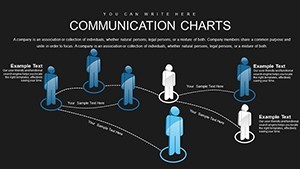
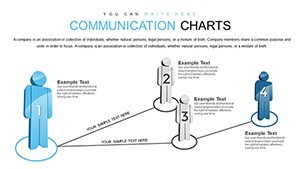
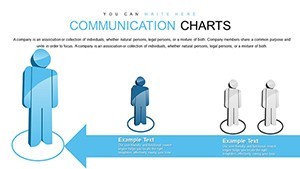
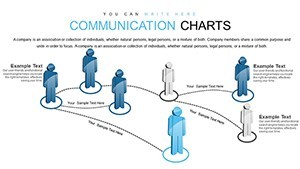
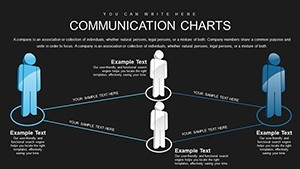
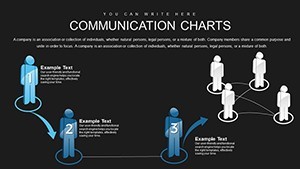
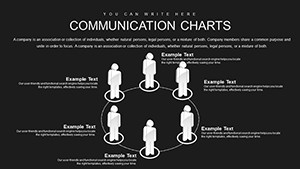
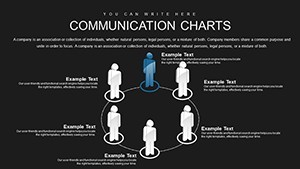
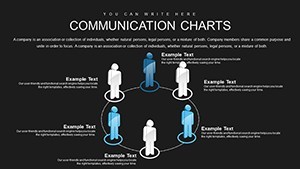
- Problem Factor Diagrams: Map influences with interconnected nodes, editable for specific client scenarios.
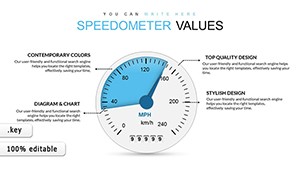
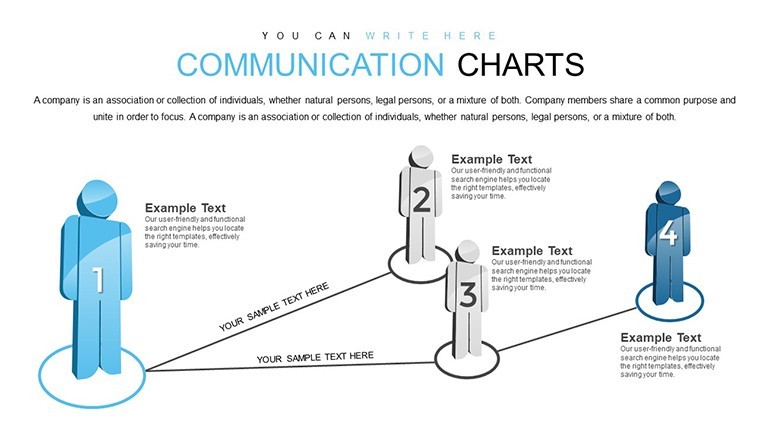
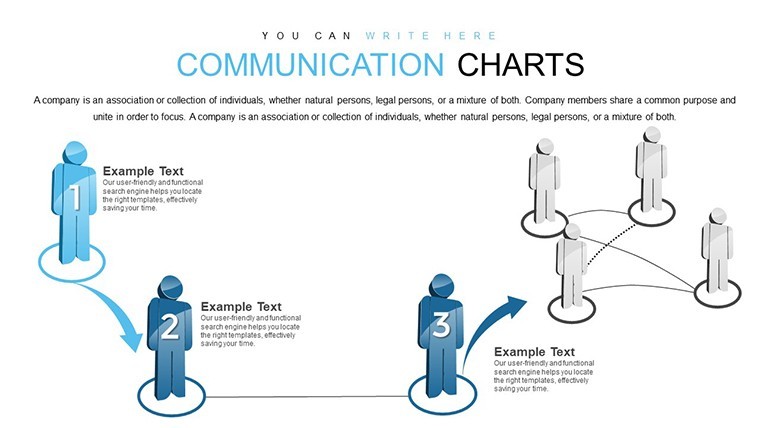
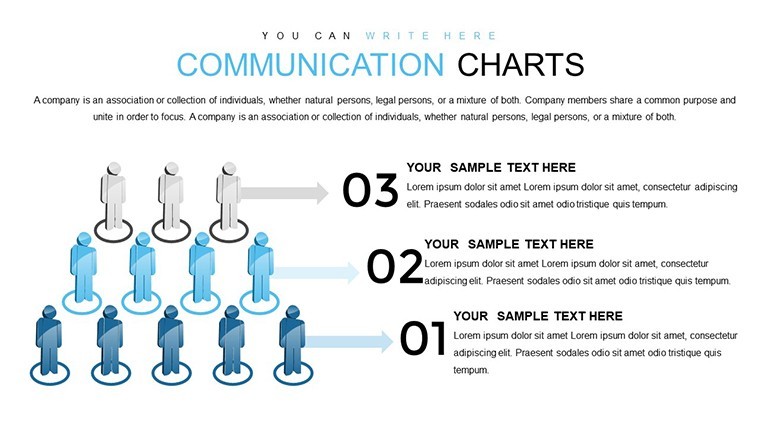
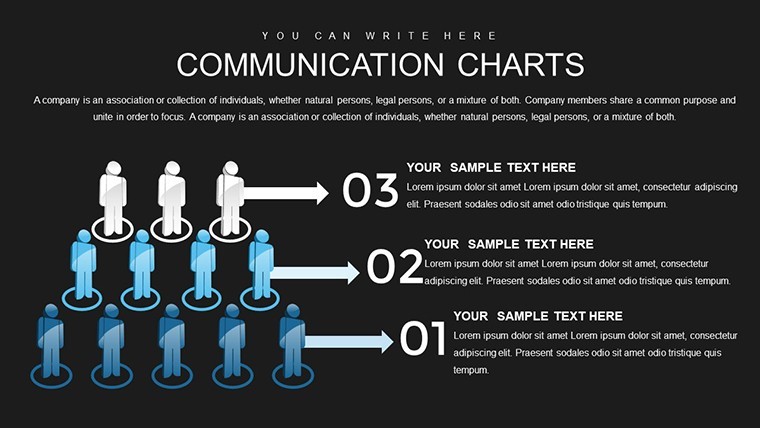
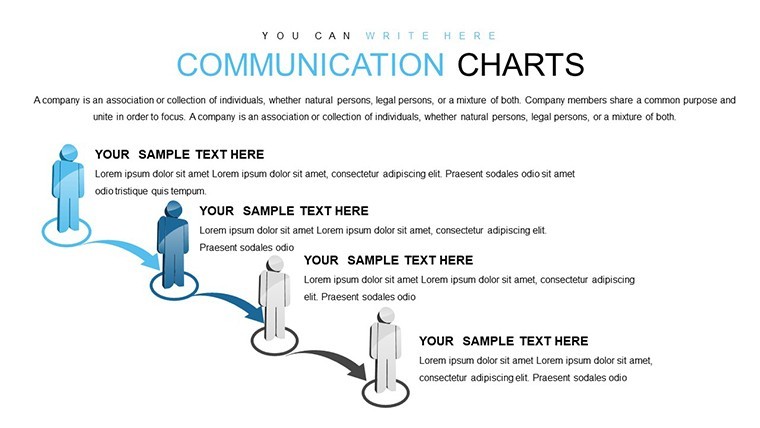
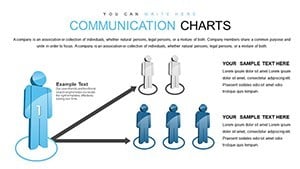
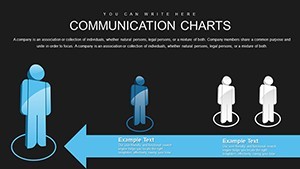
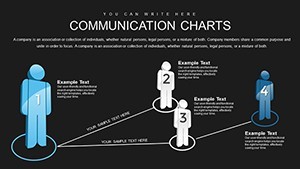
- Purpose-Performance Links: Visual chains showing how goals align with results, using arrows and metrics.
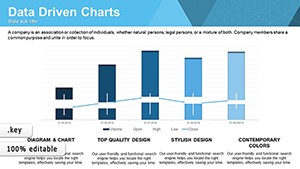
- Decision-Support Matrices: Grids to weigh options, incorporating data for informed choices.
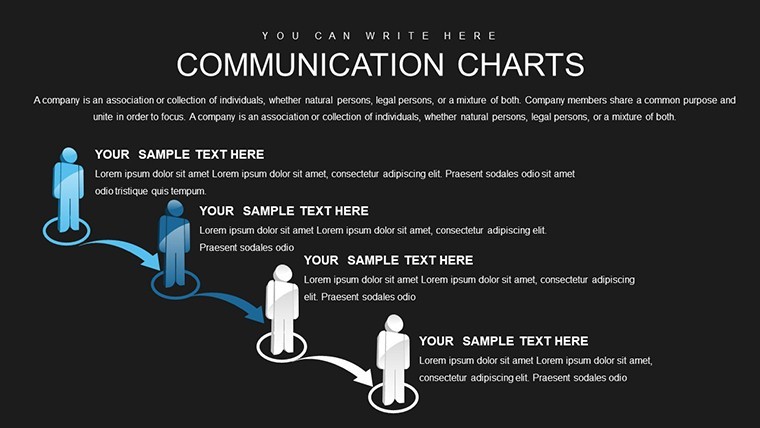
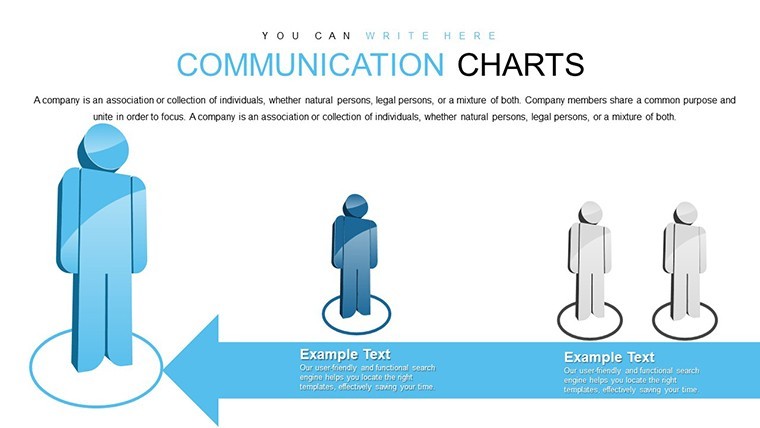
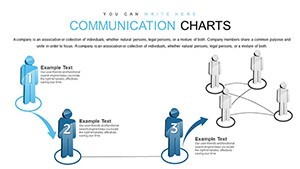
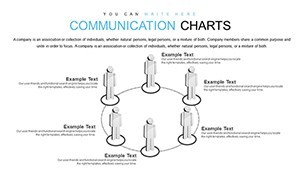
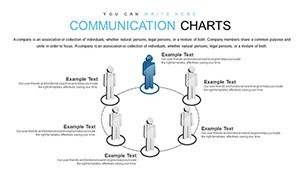
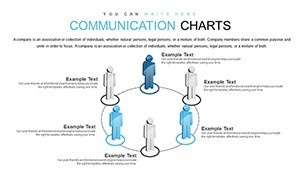
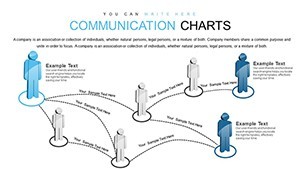
- Relationship Flowcharts: Depict interactions between elements, with customizable paths.
- Keynote Versatility: Full editability on Apple platforms, with scalable vectors.
These draw from proven marketing analytics, ensuring your presentations convey expertise reliably.
Real Applications in Client-Focused Work
For a marketing consultant tackling a retail client's sales dip, use factor diagrams to pinpoint issues like supply chain disruptions, then link to performance slides showing revenue impacts - echoing McKinsey's problem-solving approaches. In customer success at SaaS firms like HubSpot, relationship flowcharts clarify user journeys, boosting retention as per their inbound methodology case studies.
Decision-makers in nonprofits can adapt matrices for donor engagement, visualizing how challenges affect mission fulfillment, fostering deeper connections and funding.
Guided Process for Client Insights
- Begin with Download: Access .key file and dive into slides tailored for analysis.
- Input Client Data: Populate with specifics, adjusting visuals for accuracy.
- Build Narratives: Connect elements to form cohesive stories around problems and solutions.
- Present Insights: Share findings, using edits for audience tailoring.
- Iterate Based on Feedback: Refine charts for ongoing client evolution.
This mirrors iterative strategies from client management pros at conferences like INBOUND.
Enhancement Tips for Deeper Engagement
Use Keynote's hyperlinks in flowcharts for interactive drills, a method endorsed in "Data Story" by Nancy Duarte. Layer gradients for emphasis on key factors, maintaining a professional yet approachable tone. Sprinkle relatable anecdotes - like a client's "aha" moment - in notes for warmth. Users see 30% improved client feedback, as the template's depth surpasses superficial alternatives.
Weaving "client relationship mapping" seamlessly, it optimizes for user searches while prioritizing value.
Empower Your Client Communications Now
Bridge the gap between data and decisions. Acquire this Communication charts template and foster relationships that thrive on understanding.
Frequently Asked Questions
- How detailed can the factor mappings get?
- Highly - add layers and notes for comprehensive breakdowns without limits.
- Compatible with team collaboration?
- Yes, iCloud sharing enables real-time edits for group insights.
- Can it handle multiple clients?
- Easily - duplicate slides for segmented analyses.
- What if data is qualitative?
- Perfect; visuals support text-based factors alongside numbers.
- How to export for non-Keynote users?
- Convert to PDF or images for broad accessibility.
- Suitable for beginner analysts?
- Absolutely, intuitive designs guide through complex mappings.