Revolutionize Corporate Strategy with BCG Matrix Keynote Charts


Type: Keynote Charts template
Category: Business Models, Tables
Sources Available: .key
Product ID: KC00807
Template incl.: 26 editable slides
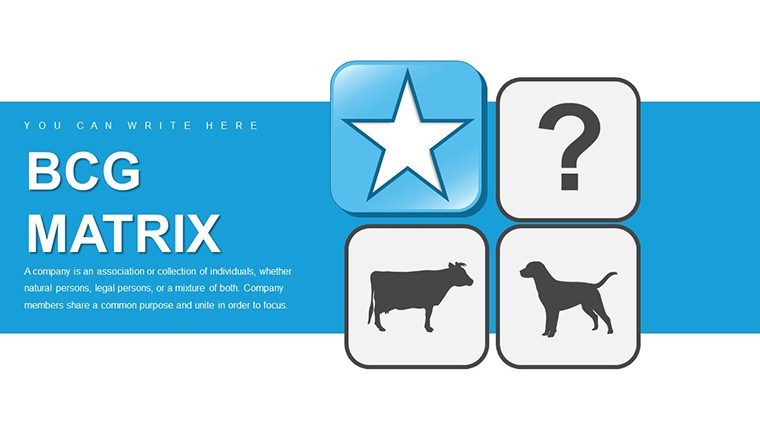
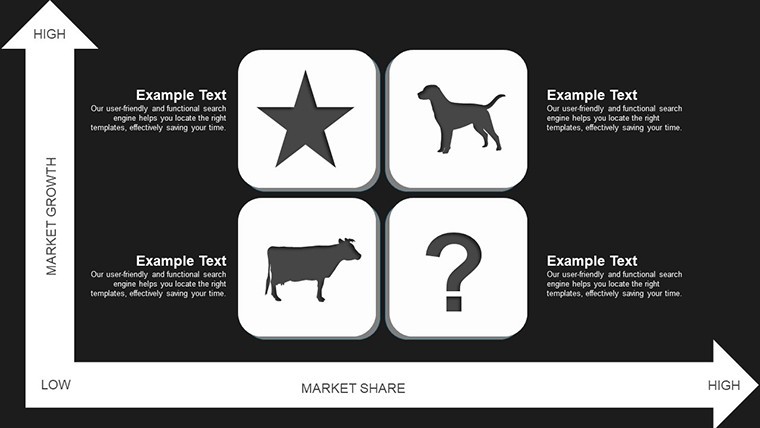
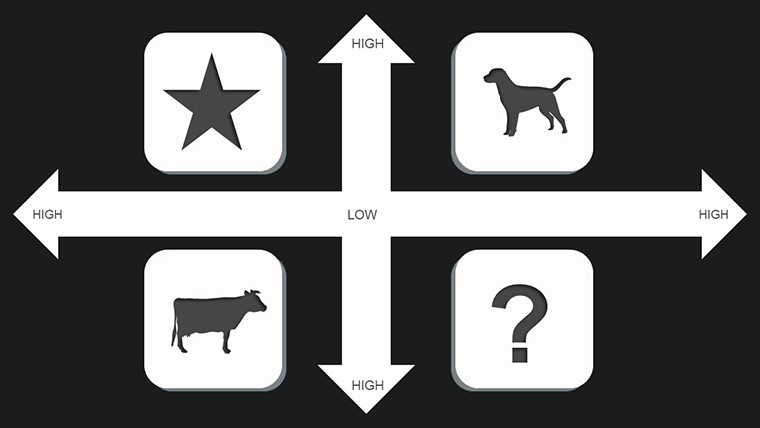
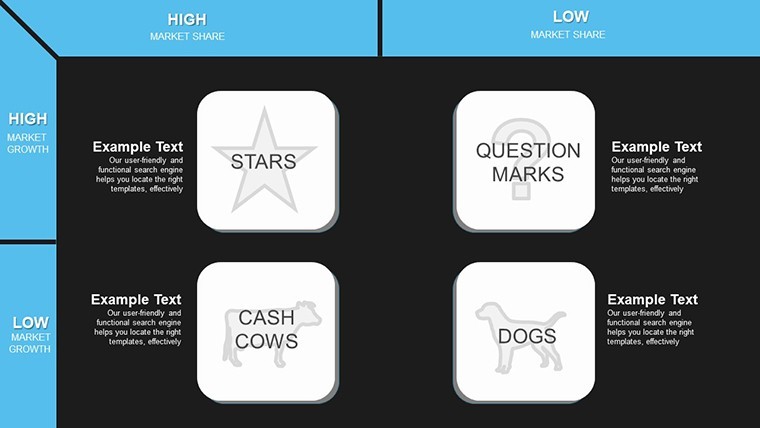
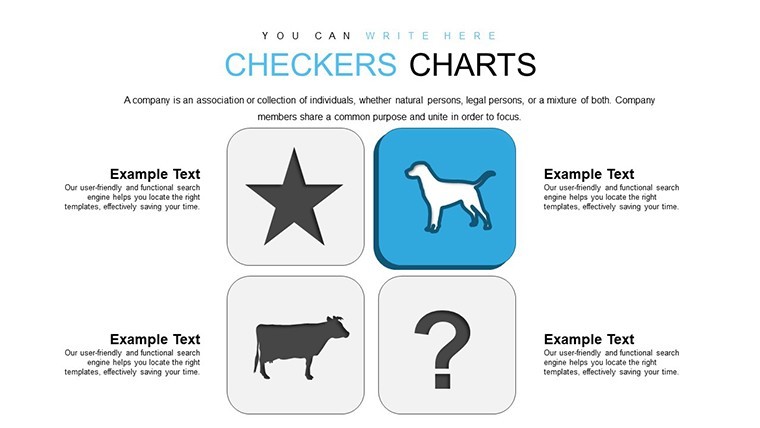
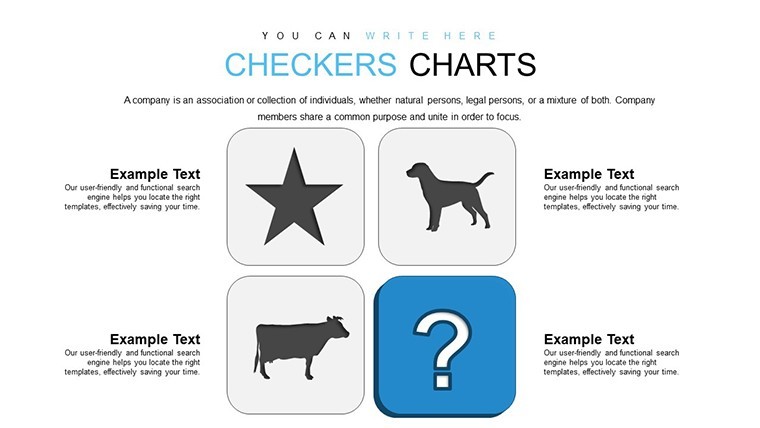
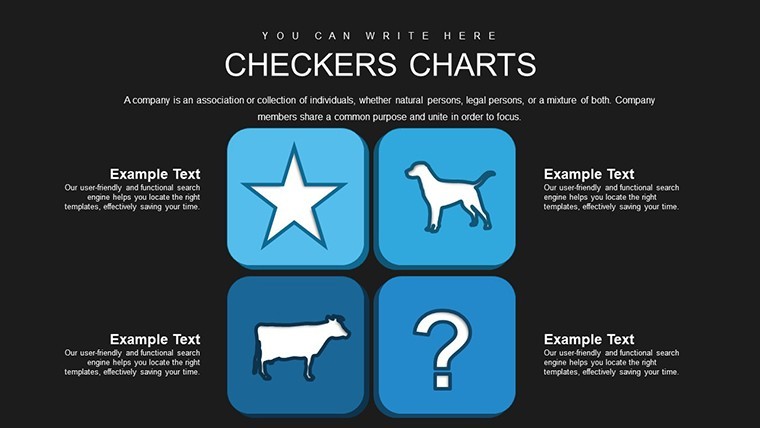
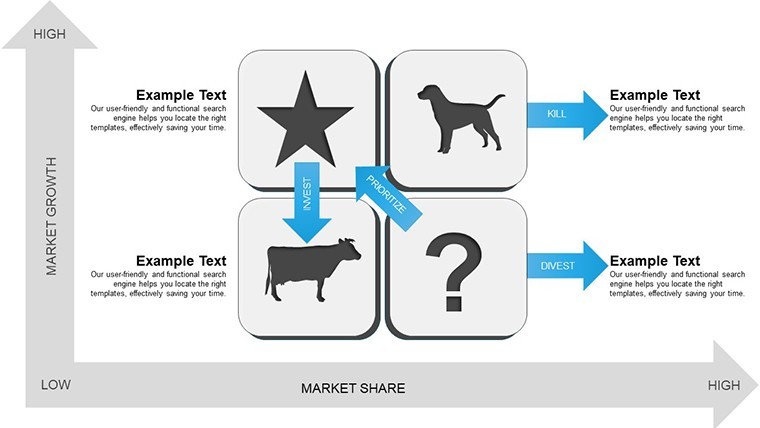
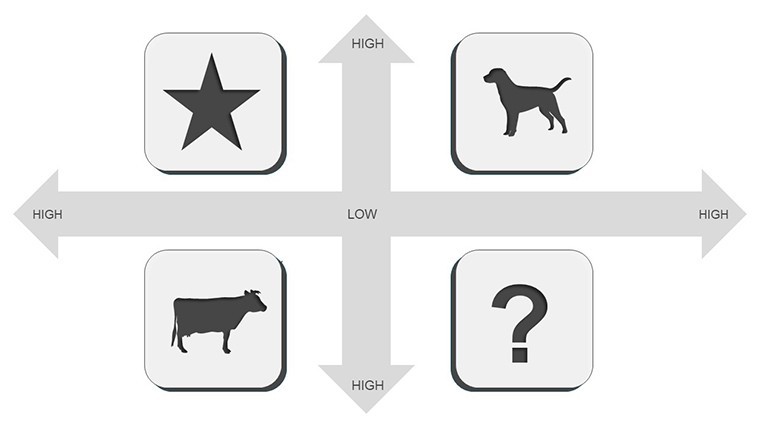
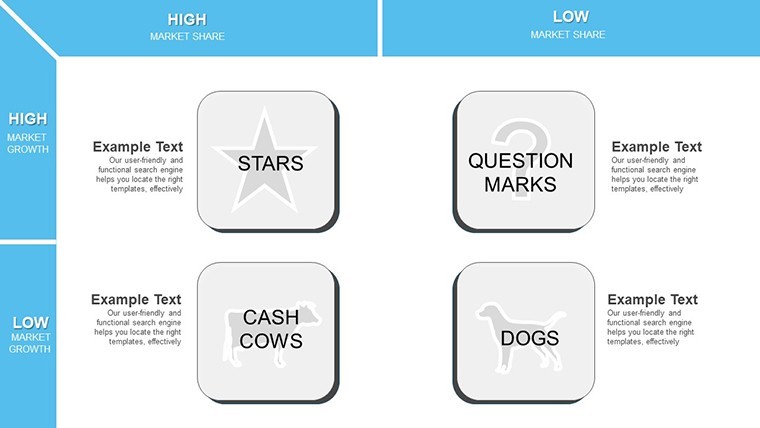
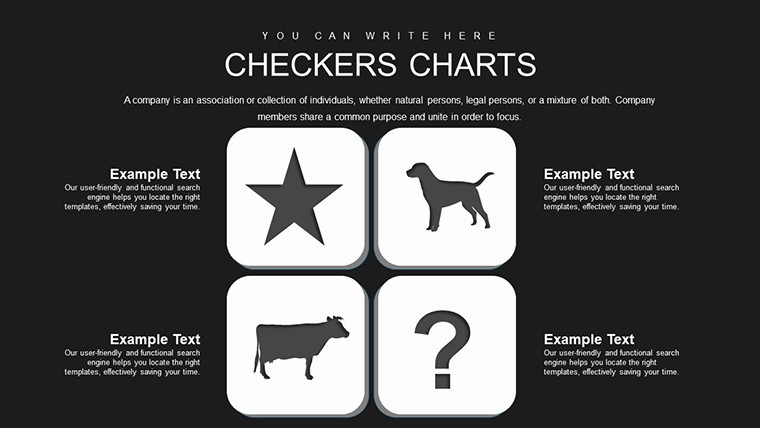
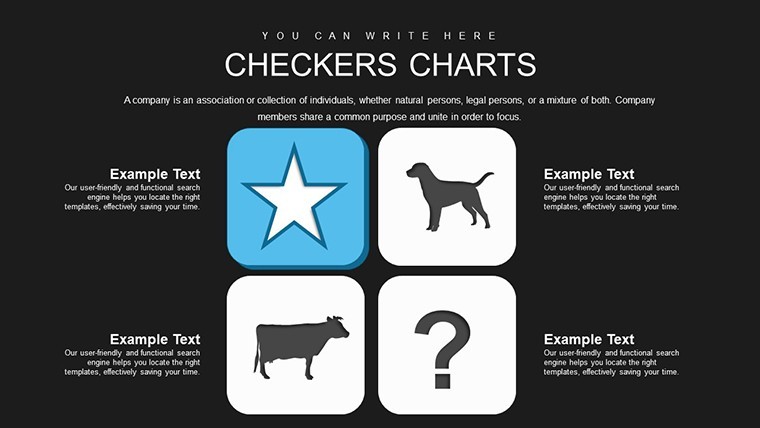
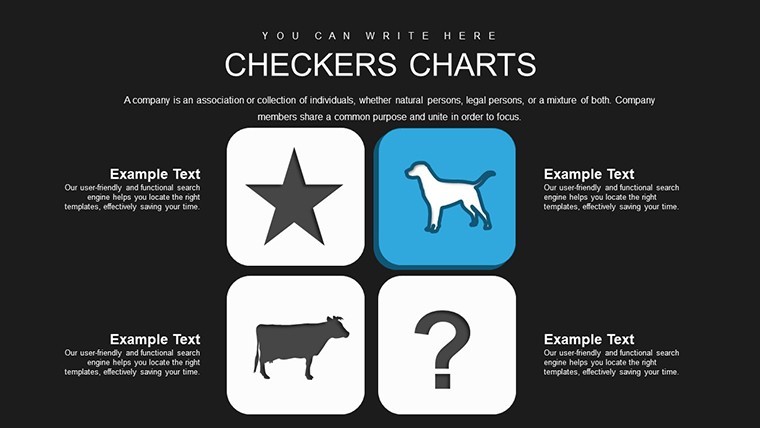
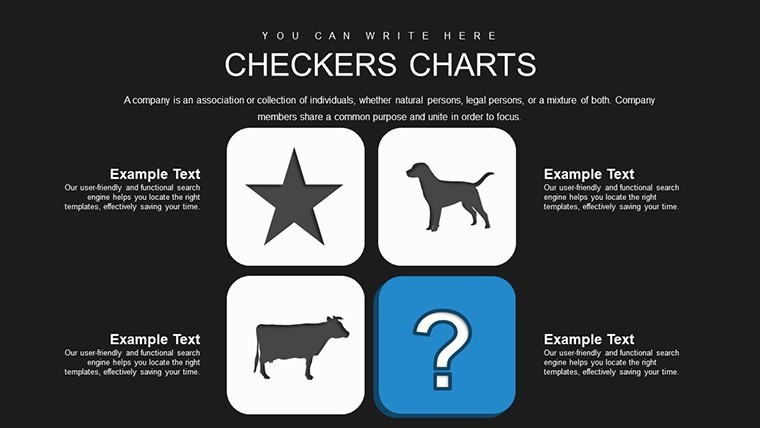
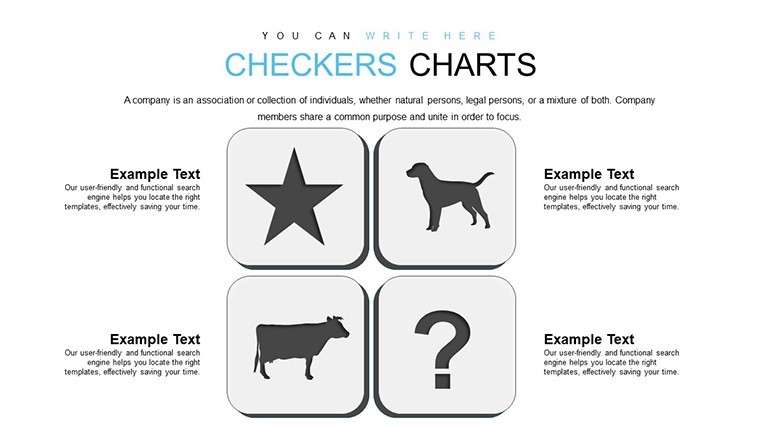
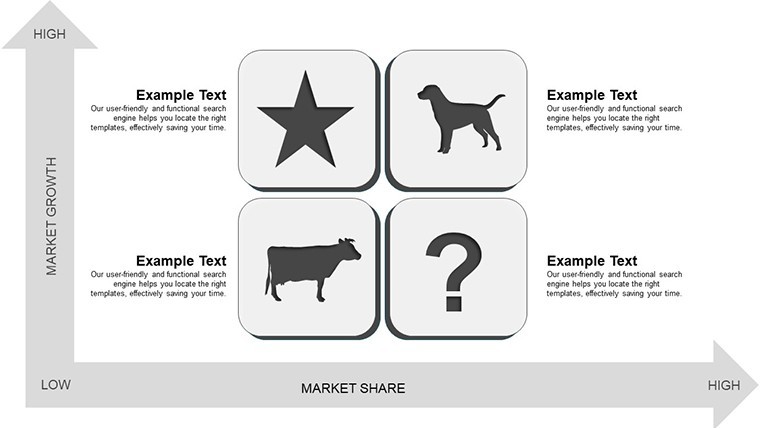
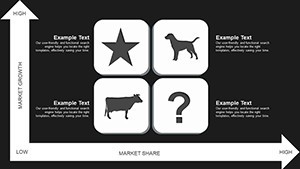
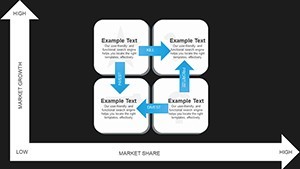
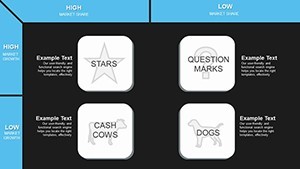
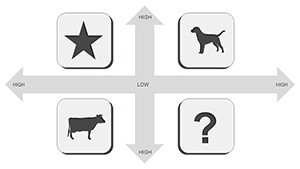
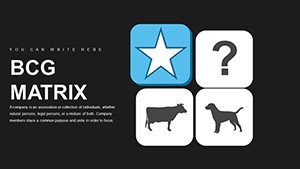
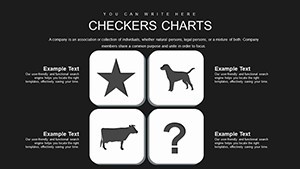
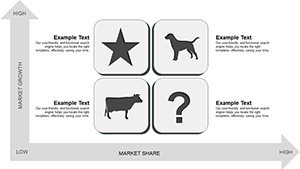
In the competitive arena of corporate strategy, allocating resources wisely across diverse business units can define success. Our BCG Matrix Keynote Charts Template, encompassing 26 editable slides, serves as a powerhouse for visualizing growth-share dynamics. Tailored for executives, strategists, and analysts in large corporations, it demystifies portfolio management by plotting market growth against relative share. Beyond the classic BCG framework, it incorporates the GE Matrix for nuanced evaluations, addressing multifaceted factors like industry attractiveness. Inspired by strategic triumphs in companies like General Electric, this template equips you to identify stars, cash cows, question marks, and dogs with clarity. Fully editable in Keynote, it streamlines your workflow, allowing rapid adaptations to real-time data. Whether refining product lines or pitching to boards, these charts transform abstract strategies into actionable visuals, fostering informed decisions that drive profitability. Step away from spreadsheet drudgery and into a realm of insightful presentations - grab this template and chart your path to strategic excellence today.
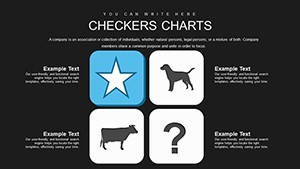
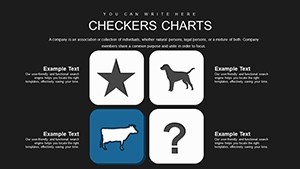
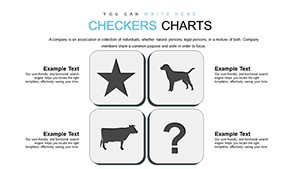
Exploring the BCG and GE Matrix Frameworks
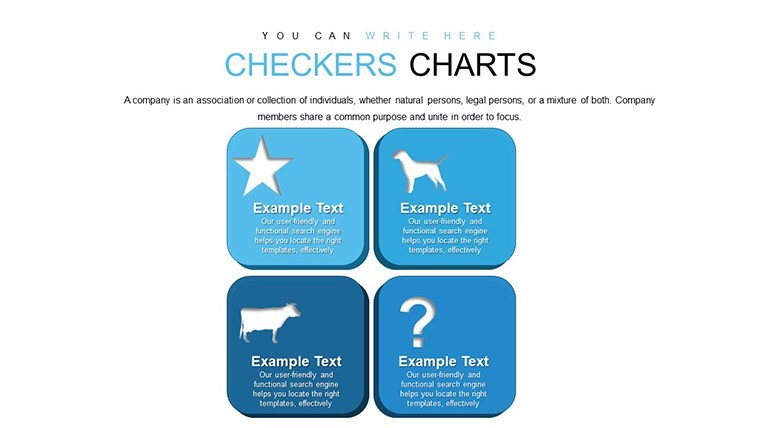
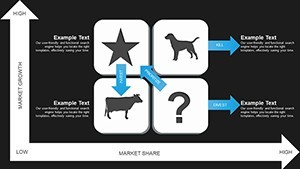
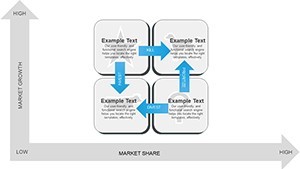
The BCG Matrix, pioneered by Boston Consulting Group, categorizes business units based on market growth and share, guiding investment priorities. Our template elevates this with 3D renditions and color-coded quadrants for immediate impact. For instance, in a tech firm like Apple, it could highlight iPhone as a star while assessing emerging products. The integrated GE Matrix refines this by factoring in business strength and industry appeal, as utilized in McKinsey collaborations. This dual approach mitigates BCG's simplicity, offering a robust tool for complex portfolios. Backed by strategic literature from Harvard Business School, it ensures your analyses are not only visually appealing but theoretically sound.
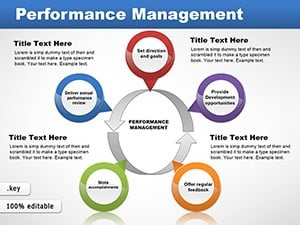
Essential Features for Strategic Depth
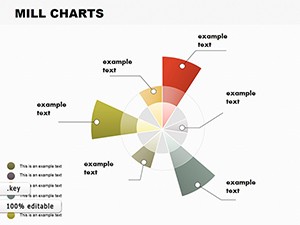
- Quadrant-Based Charts: Customizable matrices with drag-and-drop positioning for units.
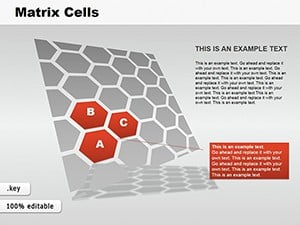
- Multi-Factor Integration: GE overlays for deeper metrics like competitive positioning.
- Editable Tables: Input data seamlessly, with auto-scaling visuals.
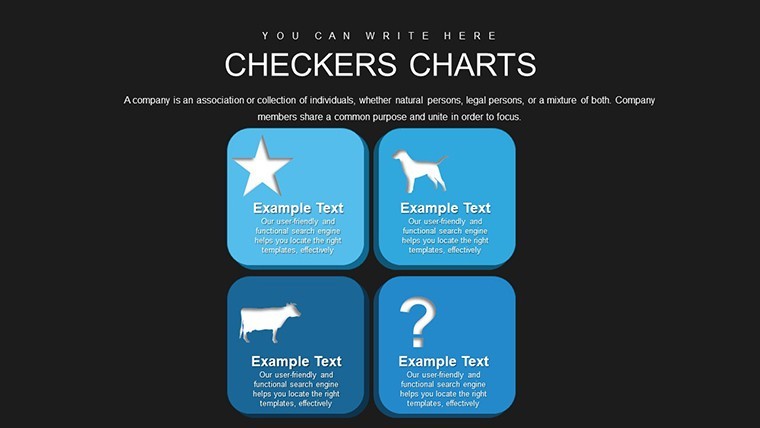
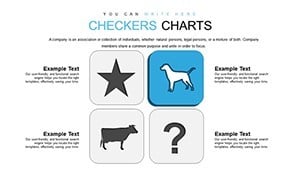
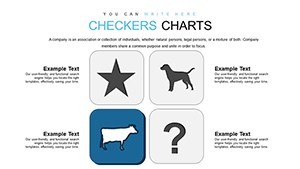
- Visual Enhancements: Icons and gradients to denote growth potentials.
- Export Flexibility: Share as PDFs or integrate into larger decks.
These surpass basic Keynote matrices, providing enterprise-level sophistication without the learning curve.
Strategic Applications in Business
Deploy this template in high-stakes scenarios. For conglomerates, map diversified portfolios to prioritize divestments, echoing Procter & Gamble's restructuring. In startups scaling up, use it to evaluate product viability amid market shifts. Consultants benefit by delivering client reports with embedded GE analyses, showcasing investment rationales. Educational facilitators can illustrate concepts in MBA classes, drawing from case studies like Coca-Cola's brand management. Its adaptability extends to non-corporate uses, such as NGO resource allocation for program efficacy.
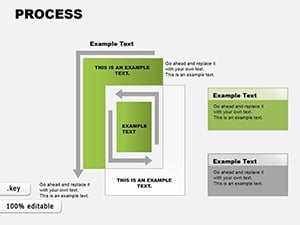
Implementation Roadmap
- Launch in Keynote and select a matrix slide.
- Enter unit data: growth rates, shares, and strengths.
- Adjust visuals: color quadrants for emphasis.
- Add annotations: explain strategic implications.
- Present dynamically: use zooms for detailed dives.
This efficient path accelerates strategy sessions, far outpacing manual builds.
Advanced Strategies for Matrix Mastery
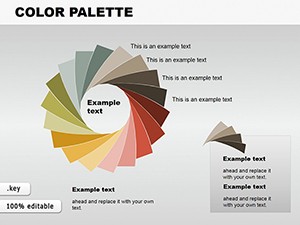
Amplify effectiveness with these insights. Balance quantitative data with qualitative notes to avoid over-reliance on numbers, as cautioned in strategic texts. Employ scenario modeling: duplicate slides for 'what-if' analyses. For visuals, use consistent palettes aligned with corporate branding. Collaborate via Keynote's sharing, incorporating team feedback in real-time. These methods, refined through consulting for multinationals, position your presentations as catalysts for change.
As markets evolve, so must your strategies. Our BCG Matrix Template provides the visual backbone to navigate uncertainty, blending classic and advanced tools for superior outcomes. From boardrooms to strategy retreats, it empowers decisive action. Embrace this resource - download now and forge ahead with confidence in your corporate vision.
FAQ
What differentiates BCG from GE Matrix in this template?
BCG focuses on growth-share; GE adds business strength and industry factors for comprehensive strategy.
Are the slides fully editable?
Yes, from data points to layouts, ensuring tailored fits.
Is it compatible with Keynote on iPad?
Certainly, for on-the-go editing.
How does it help in resource allocation?
By visualizing priorities, guiding investments to high-potential areas.
Can I use it for small businesses?
Absolutely, scalable for any size with adaptable matrices.