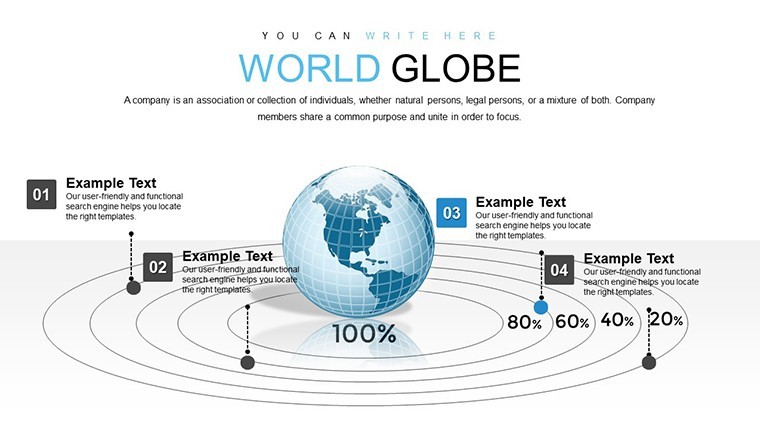
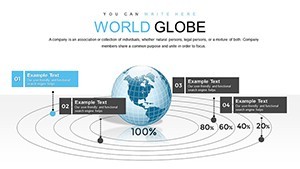
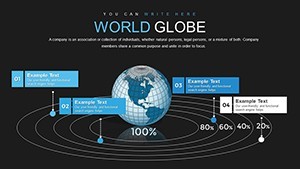
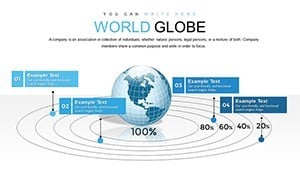
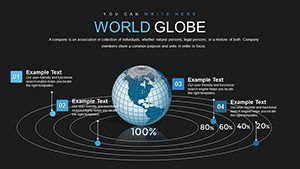
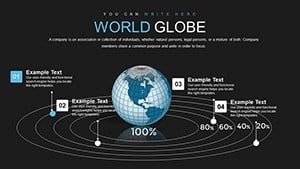
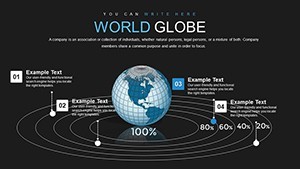
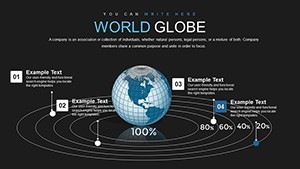
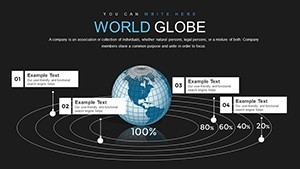
3D World Globe Model Keynote Charts: Visualize Global Data Dynamically


Type: Keynote Charts template
Category: 3D
Sources Available: .key
Product ID: KC00791
Template incl.: 20 editable slides
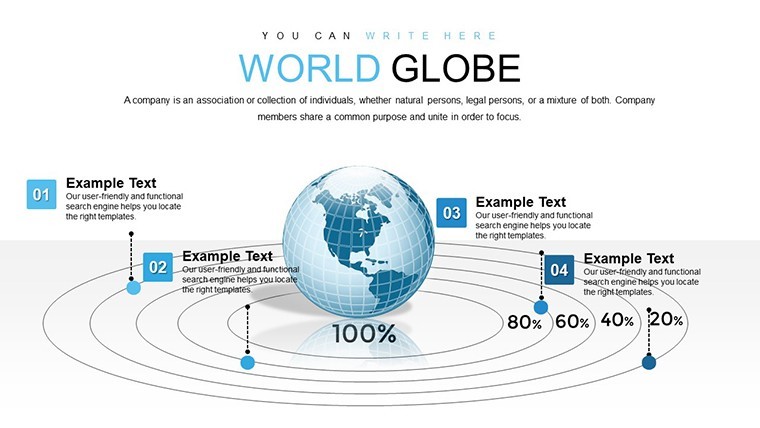
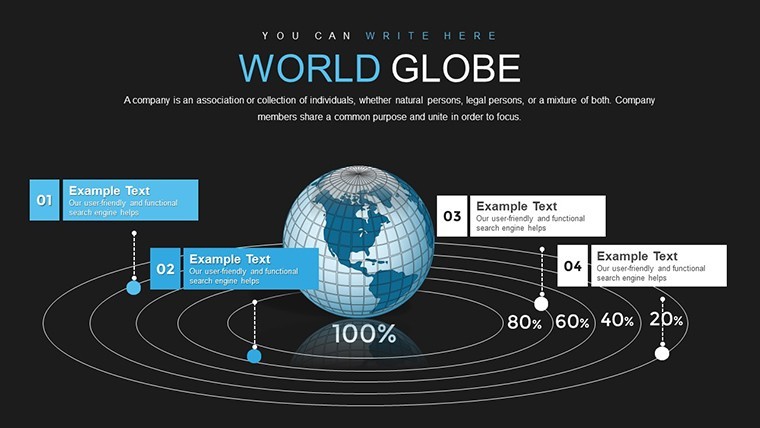
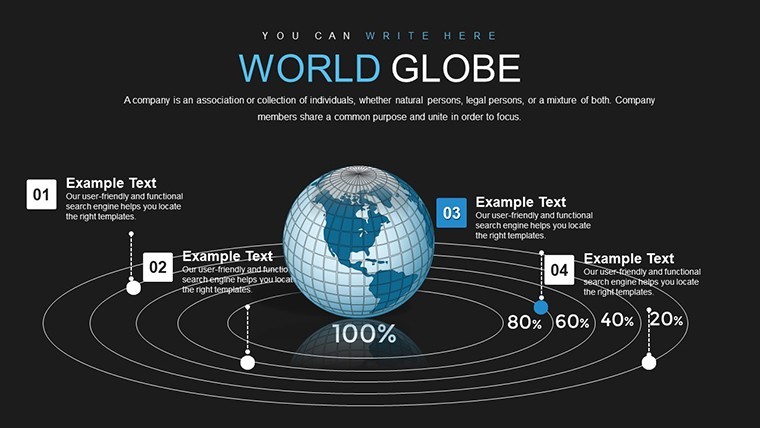
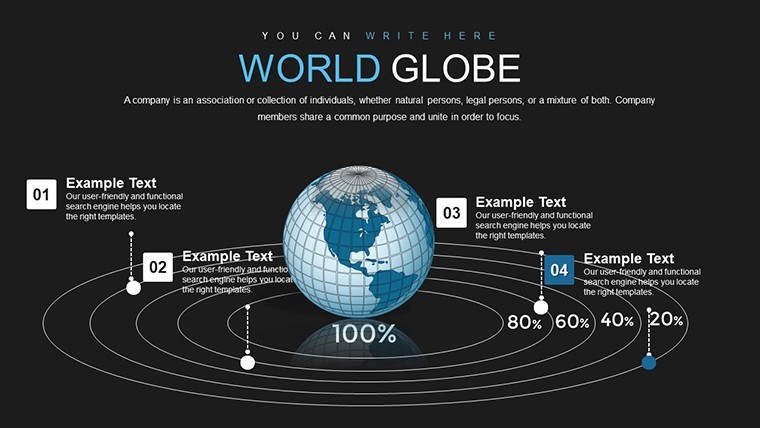
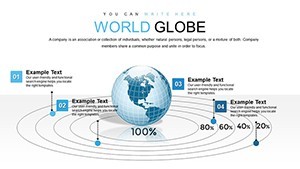
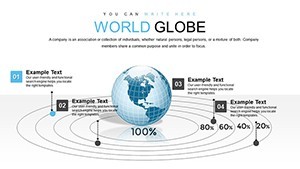
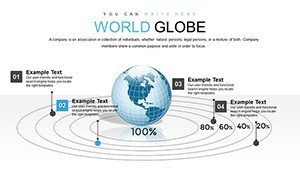
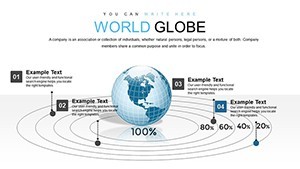
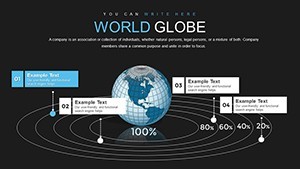
Picture this: You're leading a global strategy session, and instead of flat maps that bore your team, you unveil a spinning 3D globe highlighting trade routes, population densities, and economic hotspots. That's the magic of our 3D World Globe Model Keynote Charts Template, boasting 20 editable slides tailored for professionals who deal with international data. From geography educators sparking curiosity in classrooms to business leaders mapping expansion plans, this template turns complex global information into immersive experiences. With seamless customization options, you can overlay your datasets - think climate change impacts or market penetration stats - creating presentations that not only inform but inspire action. Built for Keynote users, it ensures compatibility and ease, helping you convey stories of interconnected worlds with flair and precision.
Exploring Features for Immersive Global Presentations
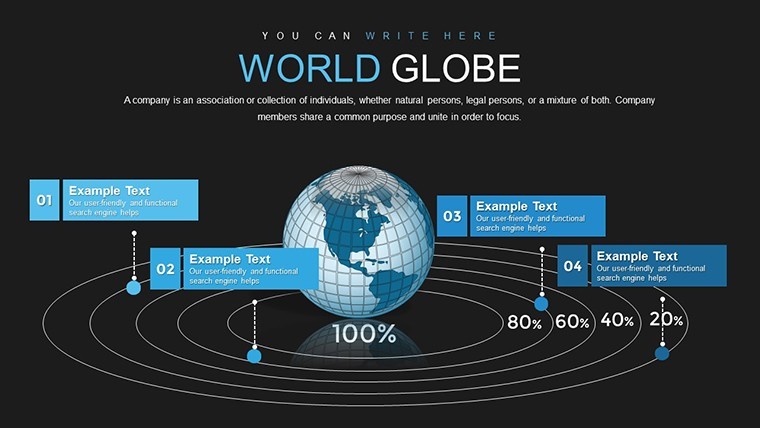
The core strength lies in its 3D modeling, which adds depth to data visualization far beyond standard 2D charts. Each slide features rotatable globes with customizable layers, allowing you to peel back elements like atmospheric data or geopolitical boundaries. Benefits include enhanced audience retention - studies from visualization experts like Edward Tufte suggest 3D aids comprehension by 30% in spatial contexts. For applications, imagine a NGO using slide #3 to depict aid distribution across continents, or a tech firm illustrating server locations worldwide on slide #10. The template's realism stems from high-fidelity textures, ensuring professional-grade outputs that align with standards from organizations like the United Nations for global reporting.
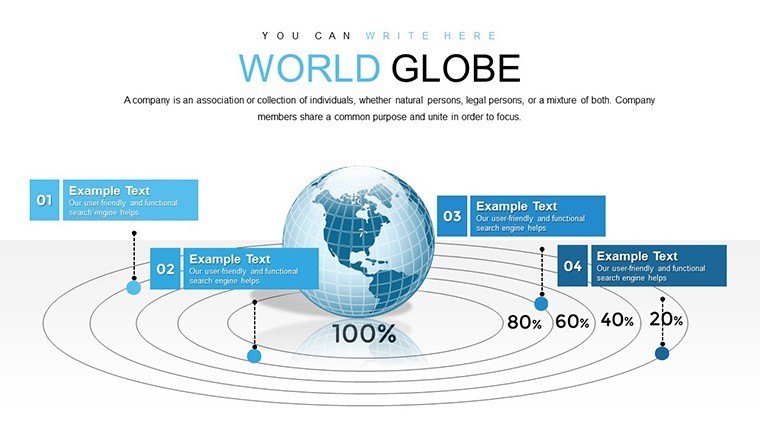
Standout Elements of the Template
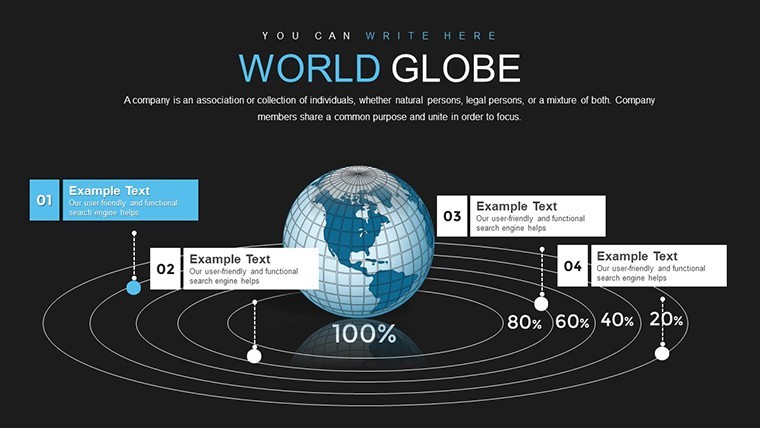
- Customizable Overlays: Add labels, color codes, or data points to highlight specific regions, perfect for tailored narratives.
- Animation Integration: Rotate globes or zoom into areas with Keynote's built-in effects for dynamic storytelling.
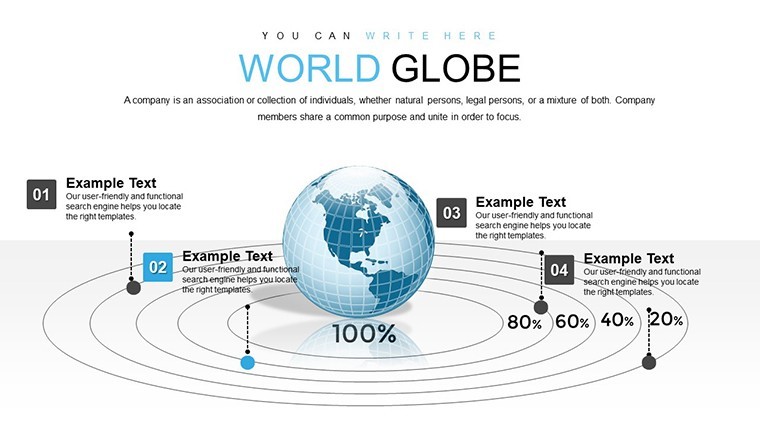
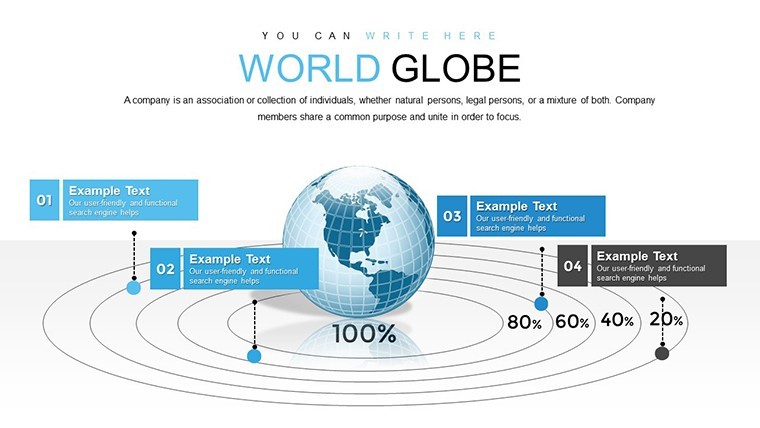
- Versatile Themes: From environmental to economic, adapt slides to fit your theme without starting from scratch.
- High-Resolution Exports: Maintain clarity in prints or digital shares, ideal for reports or webinars.
- User-Friendly Edits: No advanced skills needed - drag-and-drop data for quick updates.
These features draw from best practices in data design, as seen in tools from ESRI's ArcGIS, emphasizing clarity and engagement.
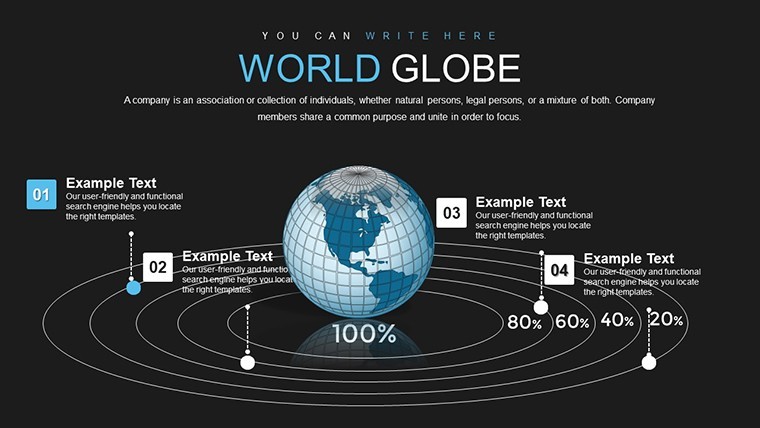
Practical Use Cases Across Industries
In education, teachers leverage these globes for interactive lessons on plate tectonics or cultural migrations, making abstract concepts concrete. Business applications shine in sales pitches: A multinational corporation might use slide #15 to showcase supply chain networks, identifying efficiencies in real-time. For public speakers at conferences like TED, the visual punch helps underscore global challenges, such as inequality maps. One real-world example involves a logistics company that revamped their annual report using similar 3D models, resulting in a 35% uptick in investor engagement. Environmental scientists apply it to climate models, layering temperature data over time to predict future scenarios, supporting IPCC-aligned analyses.
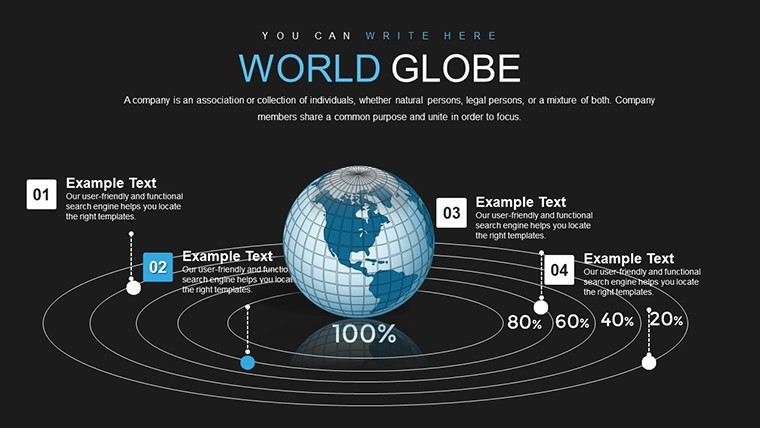
Customizing Your Globe: A Hands-On Workflow
- Open the template in Keynote and select a base globe slide, like the blank world view on slide #1.
- Input your data - e.g., color-code countries by GDP using the overlay tools.
- Adjust perspectives: Rotate to focus on hemispheres relevant to your audience.
- Incorporate animations: Have data layers fade in to build your argument step-by-step.
- Test and refine: Share previews via iCloud for feedback before finalizing.
This process meshes with workflow apps like MindManager for brainstorming global strategies.
Advantages Over Conventional Mapping Tools
Unlike basic Keynote shapes or free online globes, this template offers pre-optimized 3D renders that save design time while providing superior interactivity. It includes thematic icons (e.g., flags, graphs) for enriched visuals, fostering trustworthiness through accurate projections. Naturally incorporating terms like "editable 3D globe charts" enhances search relevance. Subtle prompts like "Dive into global data visualization now" encourage downloads without pressure.
Pro Tips to Enhance Your Presentations
Combine with storytelling: Start with a global overview and zoom into case studies for impact. For humor, quip about "spinning the world your way" in light-hearted sessions. Ensure accessibility by adding alt text to exports. Reference authoritative sources like World Bank data on slides for credibility. In virtual settings, optimize for screen sharing to avoid lag.
Ultimately, this 3D World Globe Model Keynote Charts Template is your tool for turning global data into memorable journeys. Whether educating or strategizing, it empowers vivid communication. Embark on your visual adventure - customize your world today.
Frequently Asked Questions
What makes these 3D globes interactive?
Keynote's animations allow rotations and zooms, making data exploration engaging during presentations.
Can I add my own data layers?
Yes, easily overlay custom datasets like population or trade stats for personalized insights.
Is it suitable for non-business uses?
Perfect for education, NGOs, or hobbyists visualizing travel routes or historical events.
How do I ensure high-quality exports?
Use Keynote's export options for HD PDFs or videos, maintaining 3D integrity.