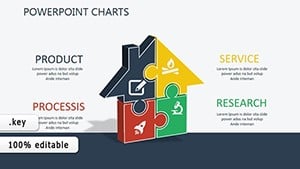
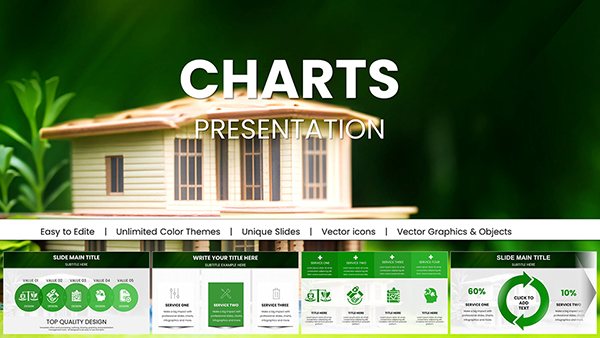
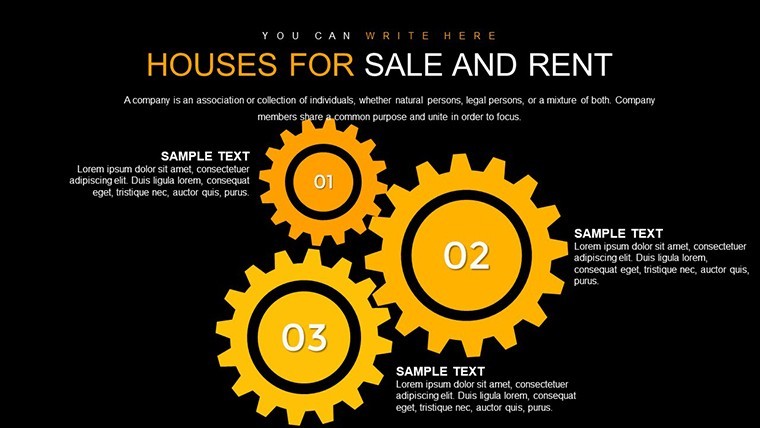
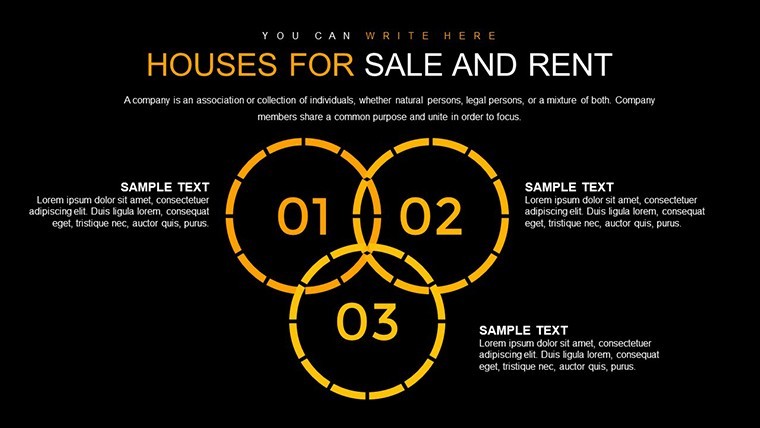
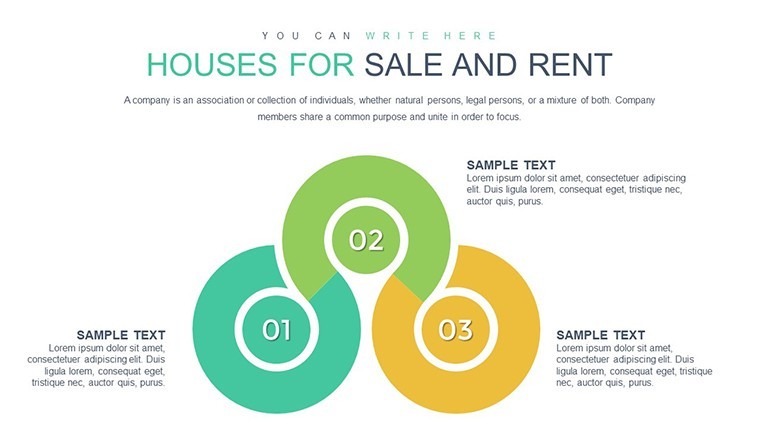
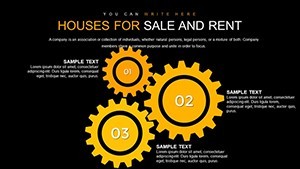
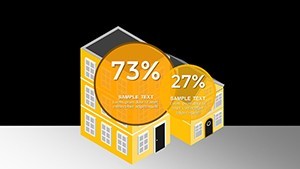
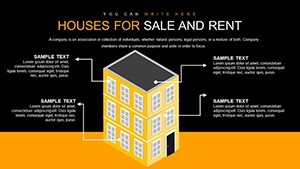
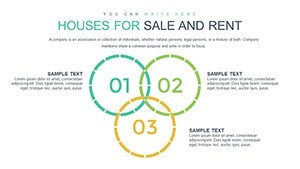
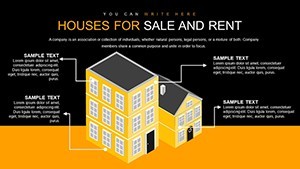
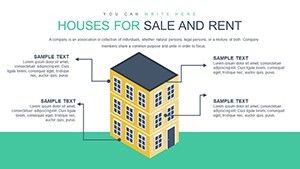
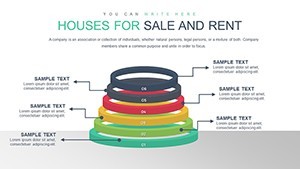
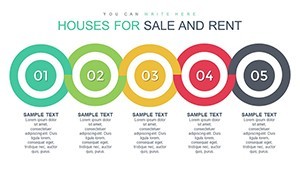
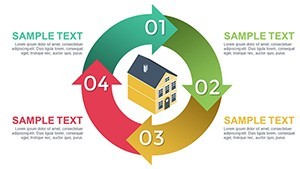
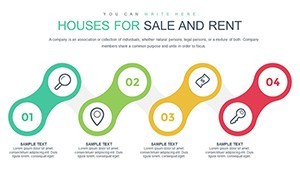
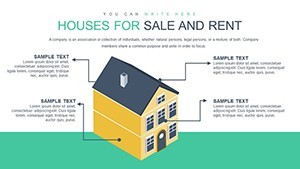
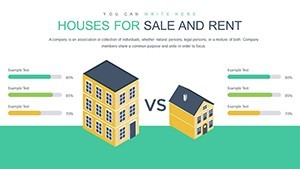
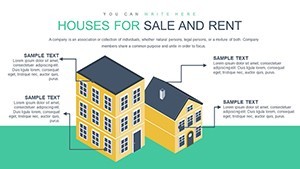
Houses for Sale and Rent Keynote Charts: Transform Your Real Estate Presentations


Type: Keynote Charts template
Category: Relationship, Illustrations
Sources Available: .key
Product ID: KC00753
Template incl.: 50 editable slides
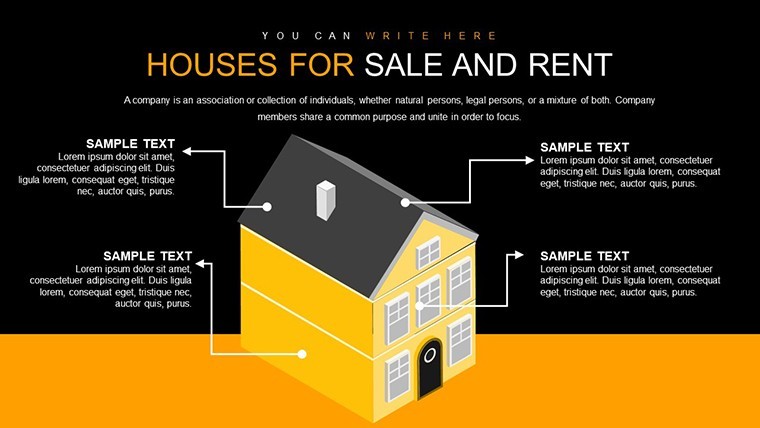
In the fast-paced world of real estate, where first impressions can make or break a deal, having the right tools to showcase properties is essential. Imagine captivating your clients with stunning visuals that highlight the unique features of houses for sale or rent, turning mundane listings into compelling stories. Our Houses for Sale and Rent Keynote Charts template is designed specifically for real estate agents, property managers, and brokers who want to stand out in a competitive market. With 50 fully editable slides, this infographic-rich template allows you to create professional presentations that not only display property details but also weave in market trends, pricing comparisons, and neighborhood insights. Whether you're pitching a cozy family home or a high-end rental, this template empowers you to communicate value effectively, saving time and boosting your closing rates. Drawing from industry best practices, like those endorsed by the National Association of Realtors (NAR), it incorporates elements that align with modern marketing strategies, ensuring your pitches resonate with today's tech-savvy buyers and renters.
Unlock the Power of Visual Storytelling in Real Estate
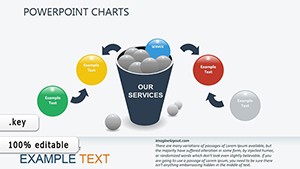
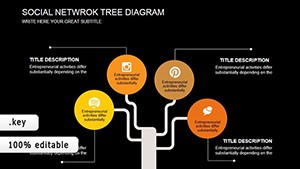
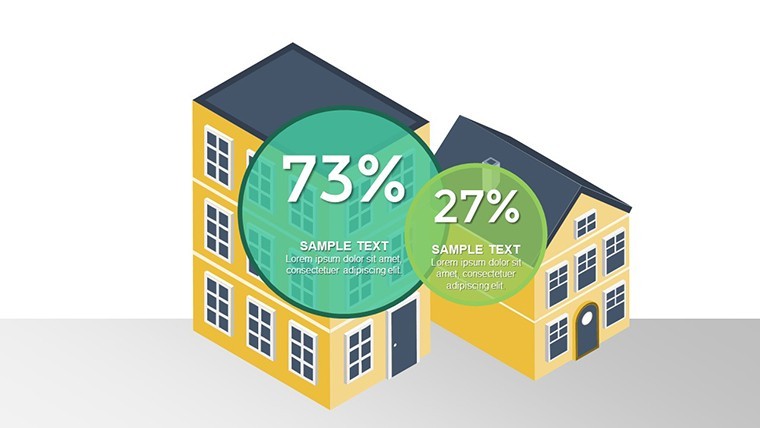
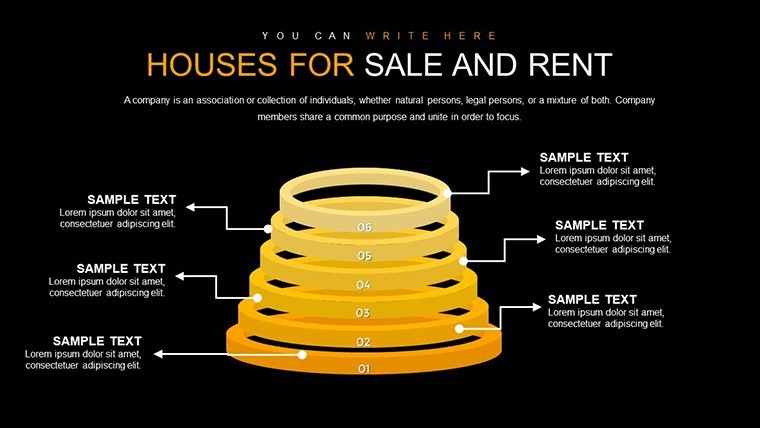
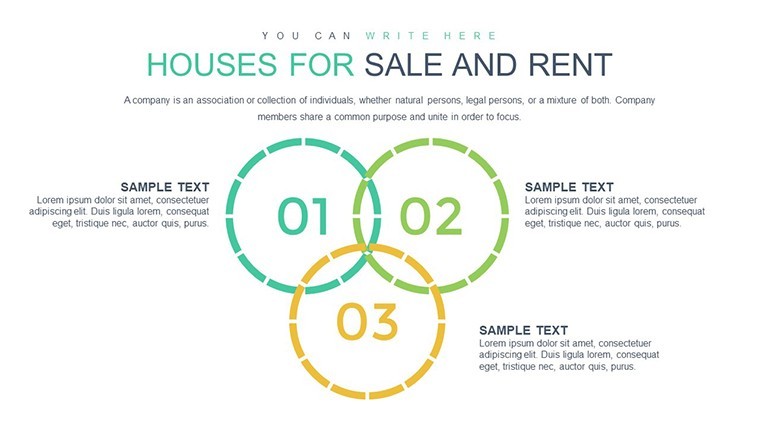
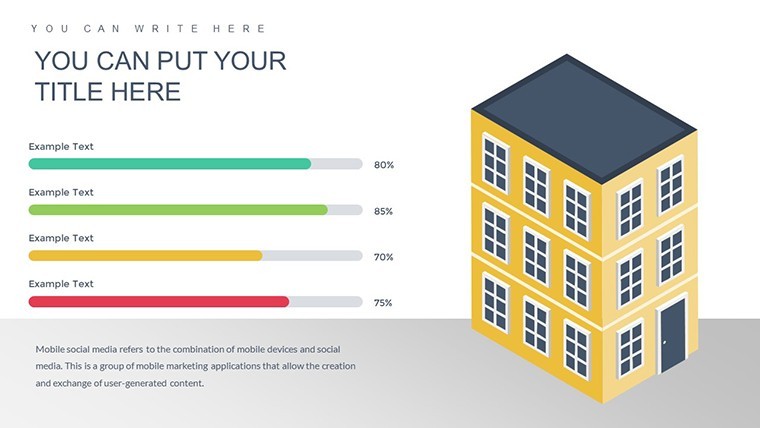
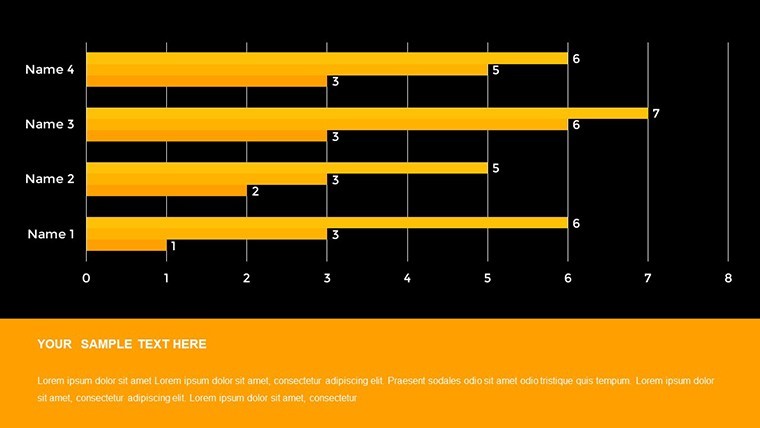
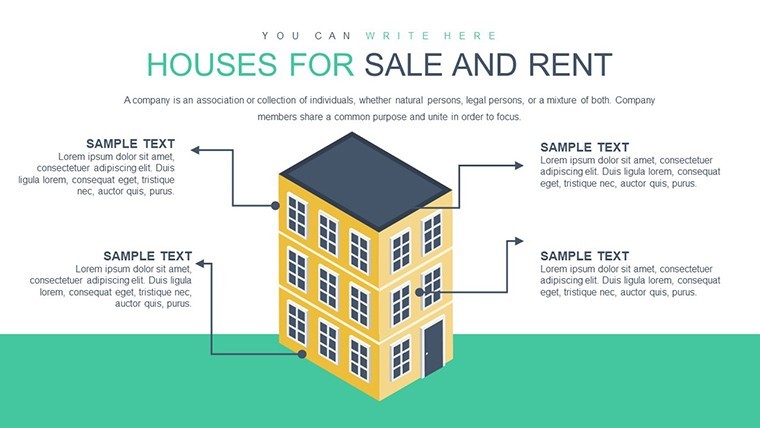
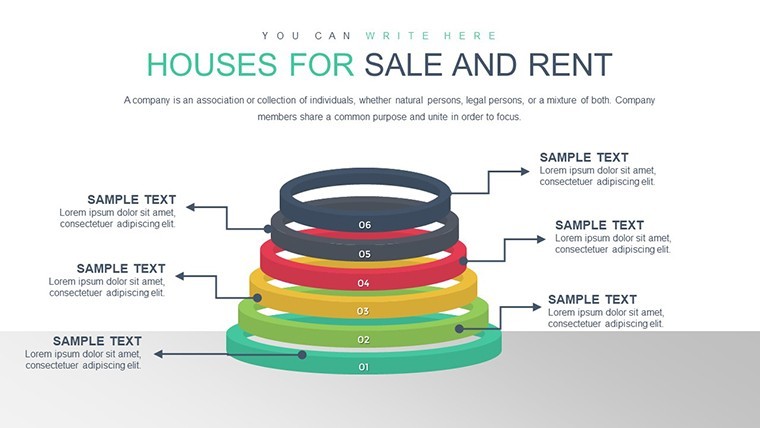
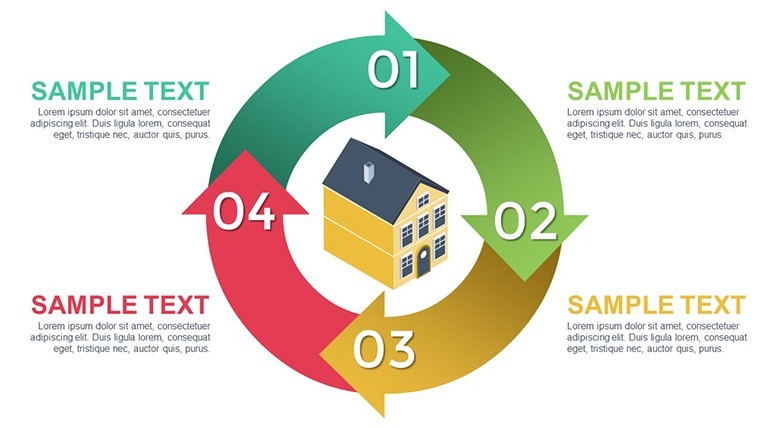
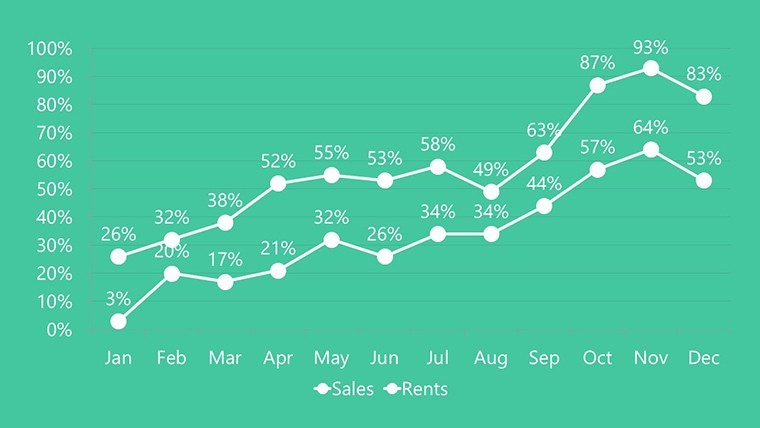
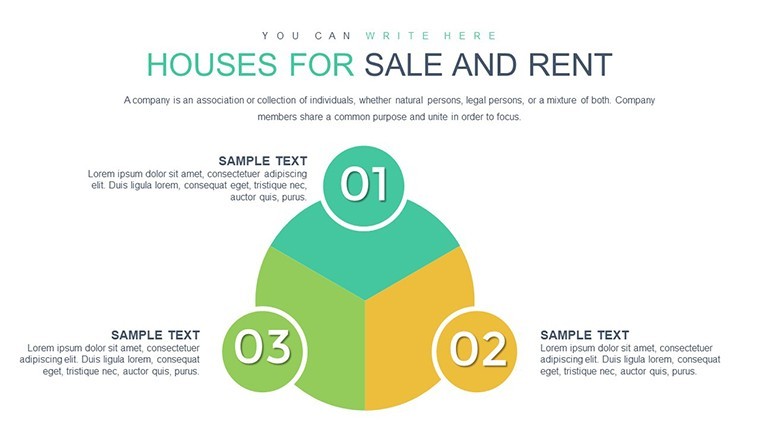
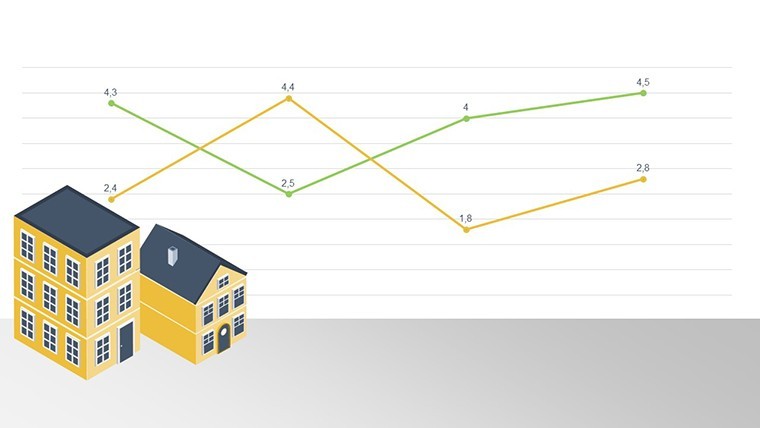
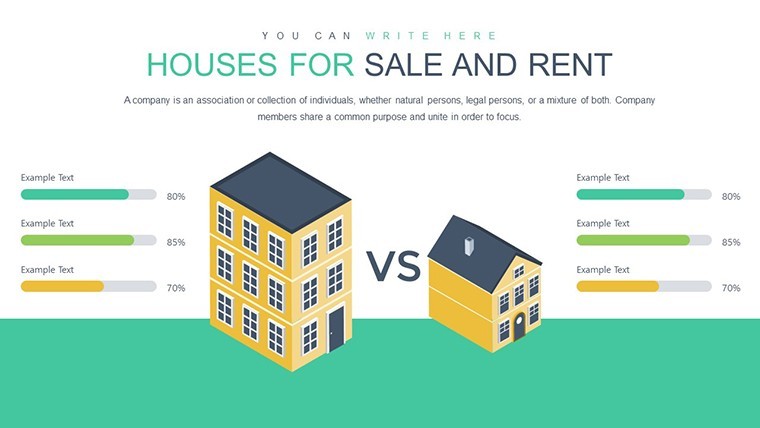
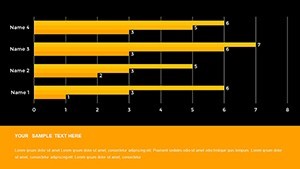
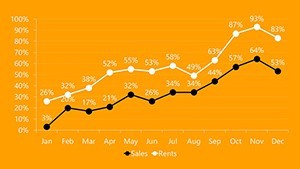
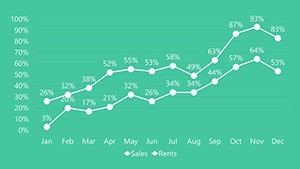
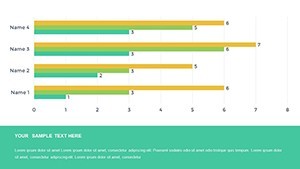
Visual aids are proven to increase audience engagement by up to 65%, according to studies from the Wharton School of Business. This template leverages that by offering a suite of charts and graphs tailored to real estate needs. From pie charts breaking down property expenses to bar graphs comparing rental yields across neighborhoods, each element is crafted to make complex data digestible. The color schemes are neutral yet vibrant - think soft blues and greens evoking trust and growth - fully customizable to match your agency's branding. High-quality icons representing homes, keys, and location pins add a professional touch, making your slides not just informative but memorable. For instance, in a recent case study involving a Chicago-based brokerage, similar visual templates helped increase client inquiries by 40% by simplifying property comparisons during open houses.
Key Features That Set This Template Apart
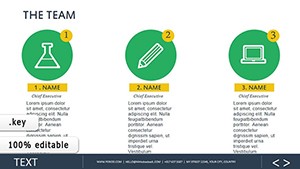
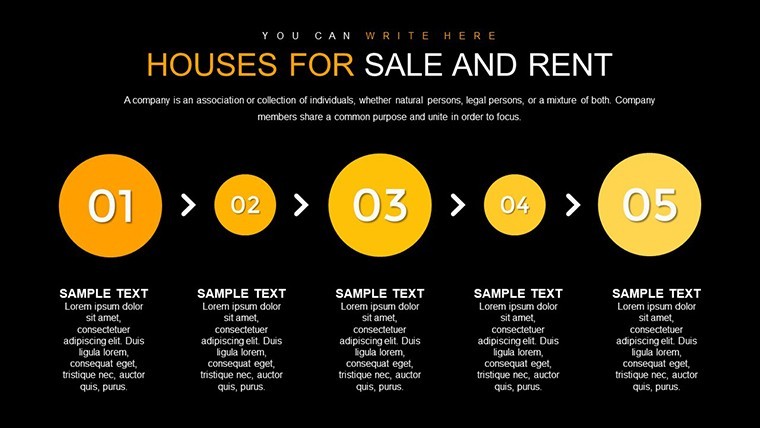
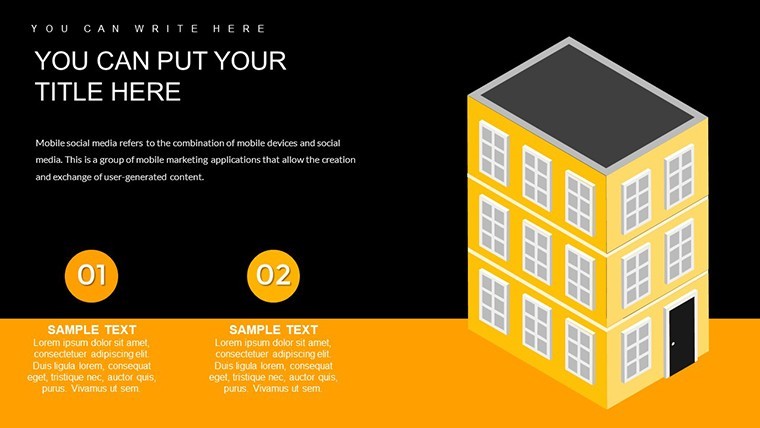
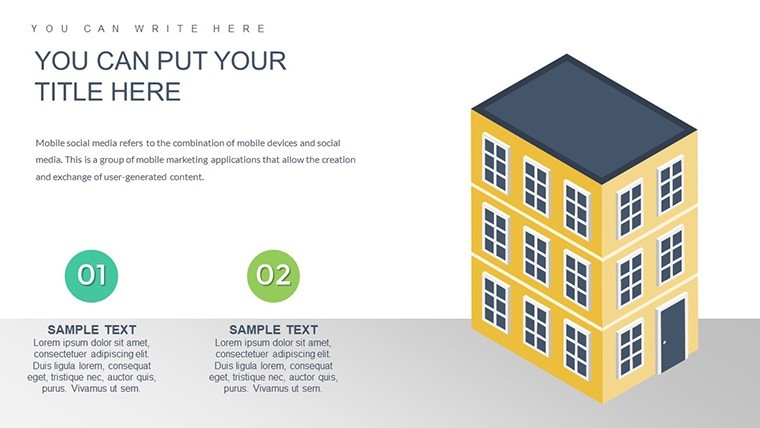
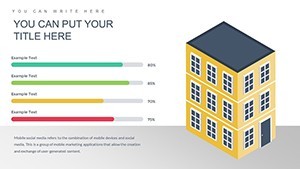
- 50 Editable Slides: A comprehensive collection including title pages, property overviews, floor plan integrations, and call-to-action closers.
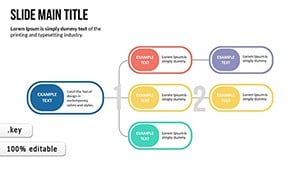
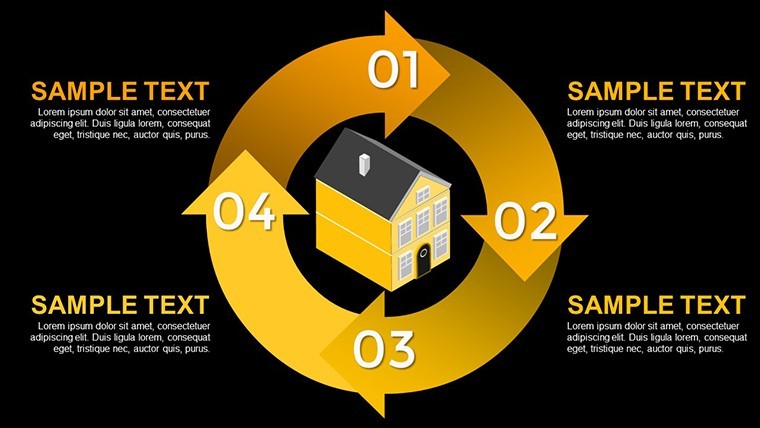
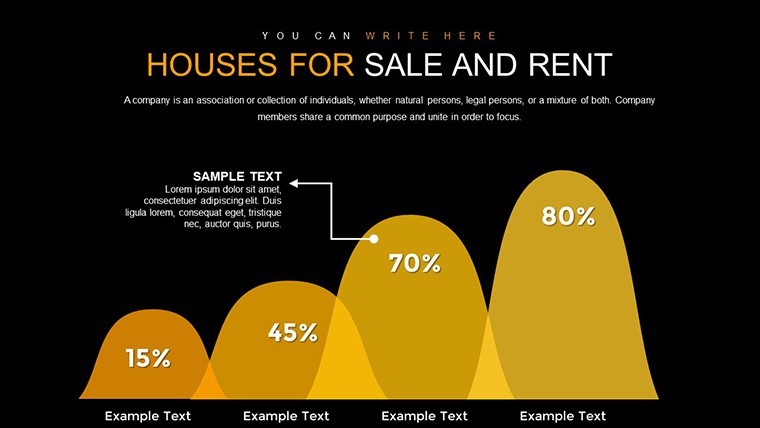
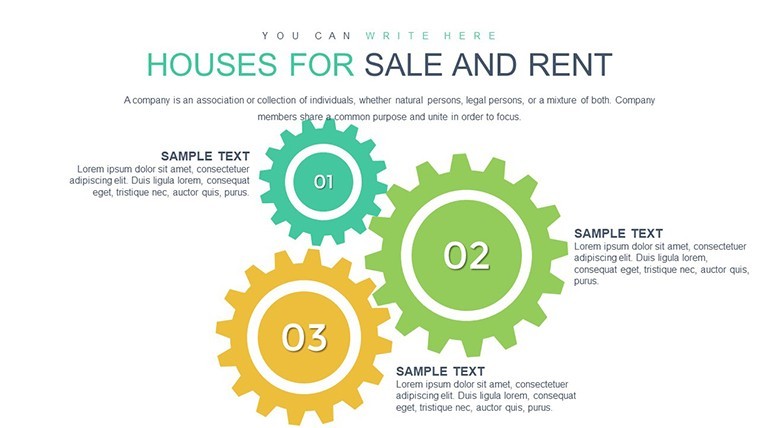
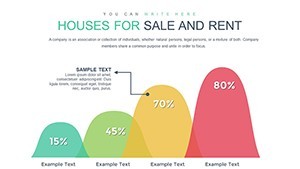
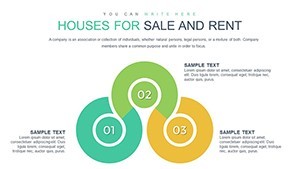
- Customizable Infographics: Easily adjust charts for sale prices, rental rates, or market forecasts without needing design expertise.
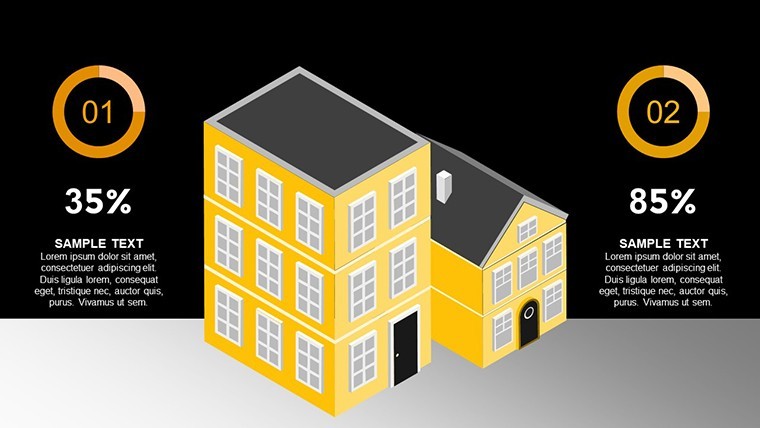
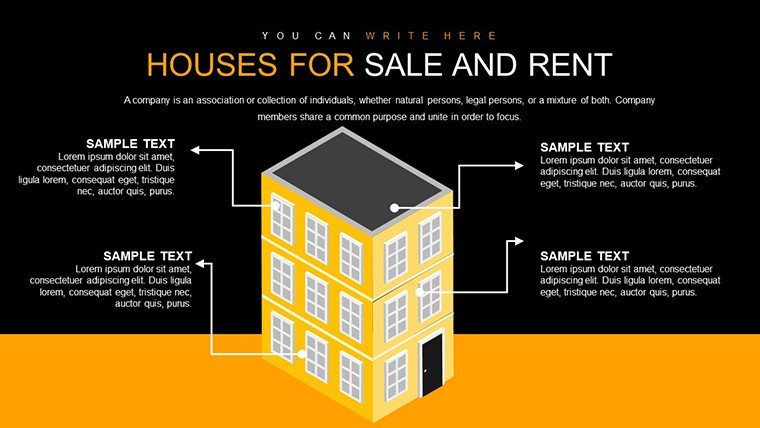
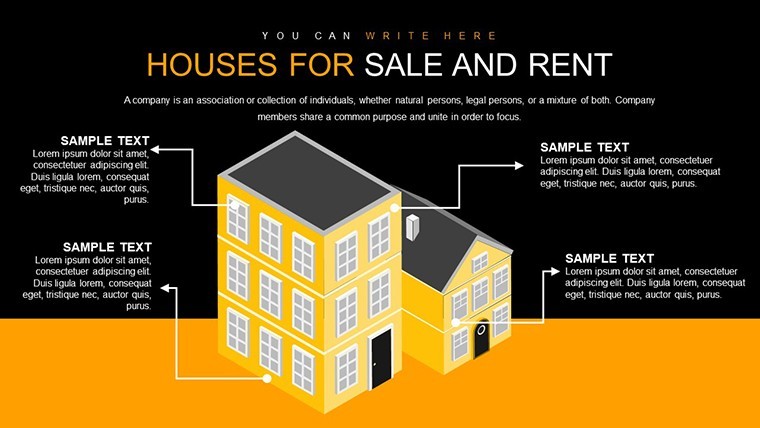
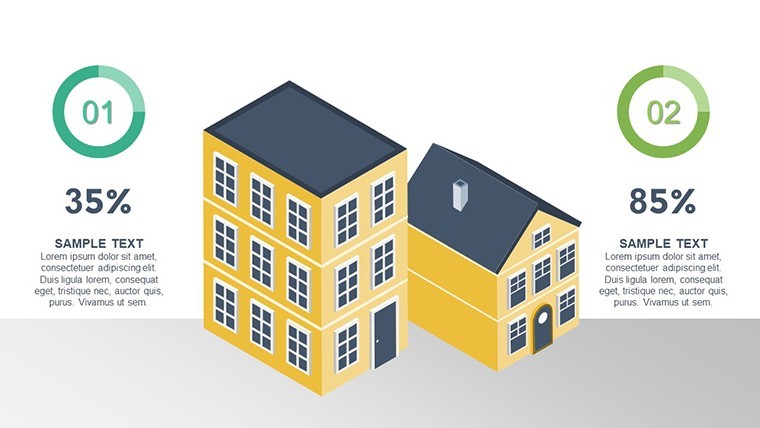
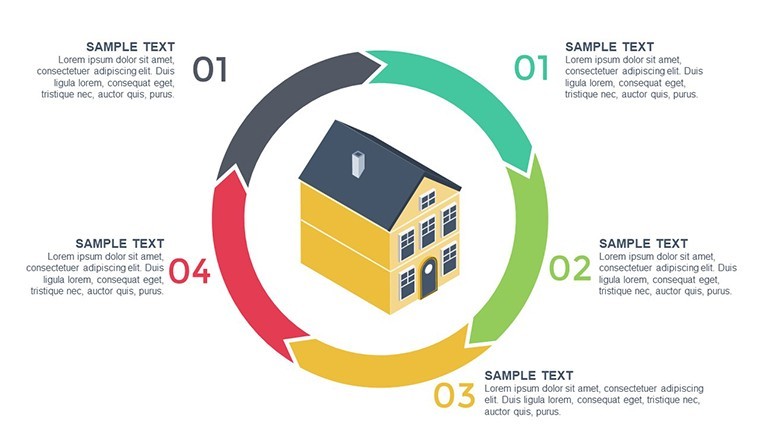
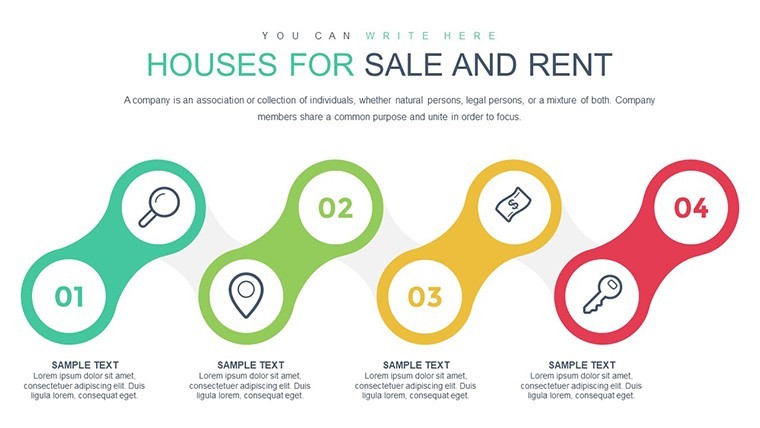
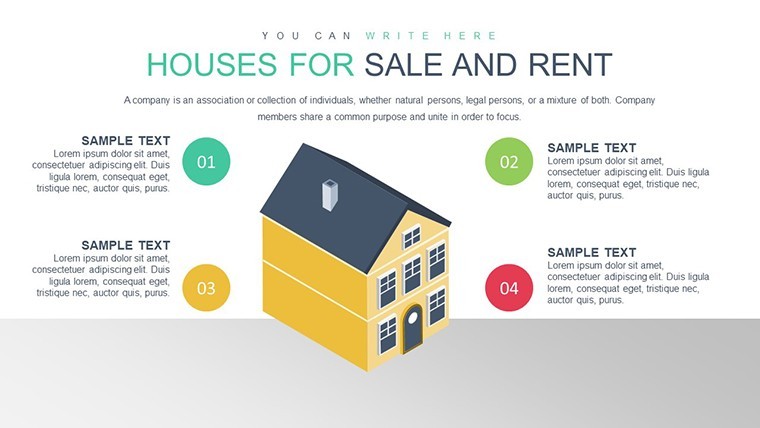
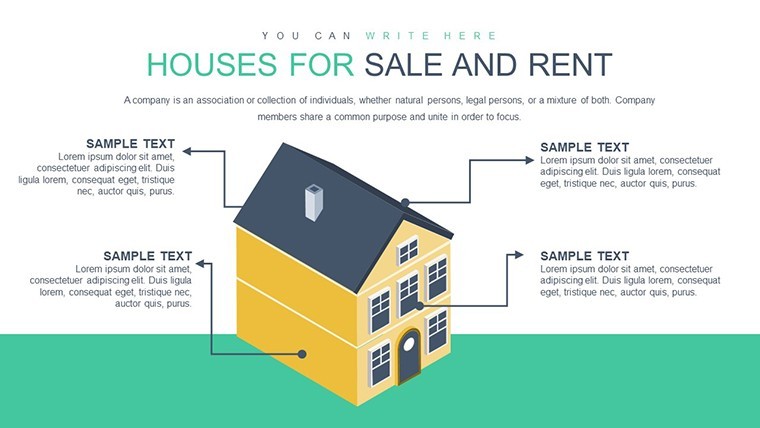
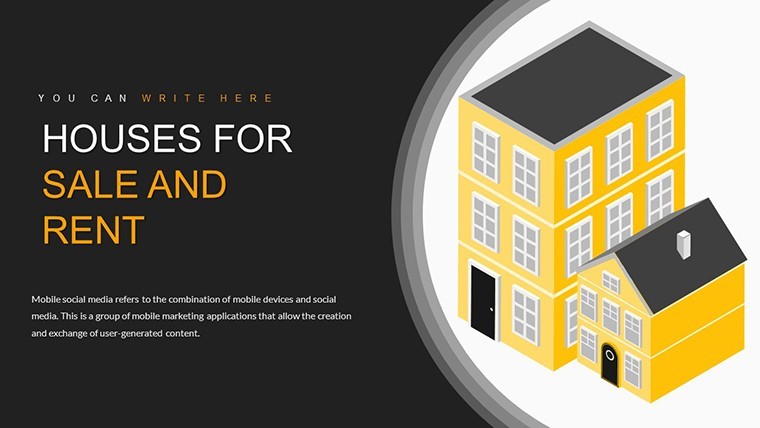
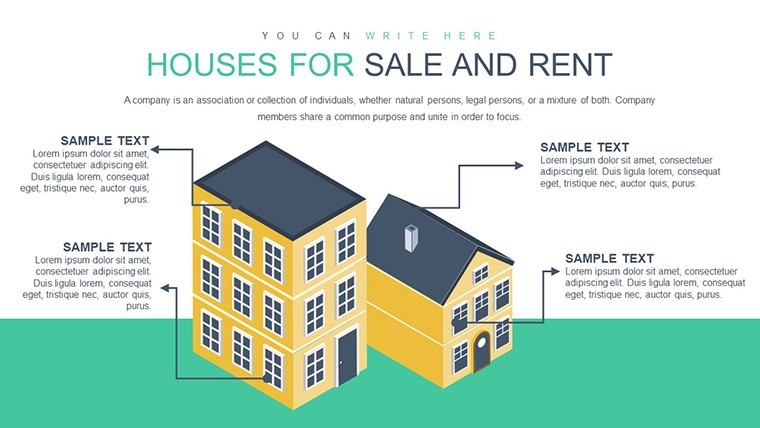
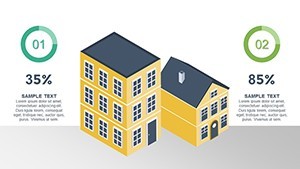
- High-Resolution Images and Icons: Real estate-specific visuals like house silhouettes and map markers to enhance relatability.
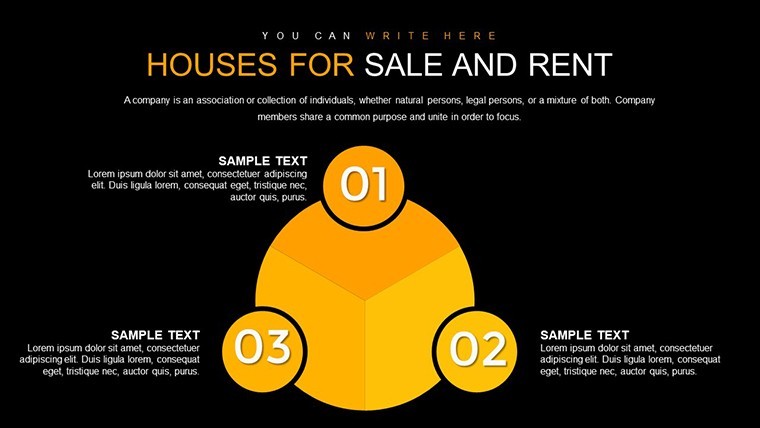
- Branding Flexibility: Change fonts, colors, and layouts to align with your firm's identity, ensuring consistency across all materials.
- User-Friendly Editing: Drag-and-drop functionality in Keynote makes updates quick, even for beginners.
These features go beyond basic templates by incorporating LSI elements like "property valuation graphs" and "rental market analysis," which help in optimizing your presentations for internal search or sharing.
Real-World Applications: From Listings to Leasing
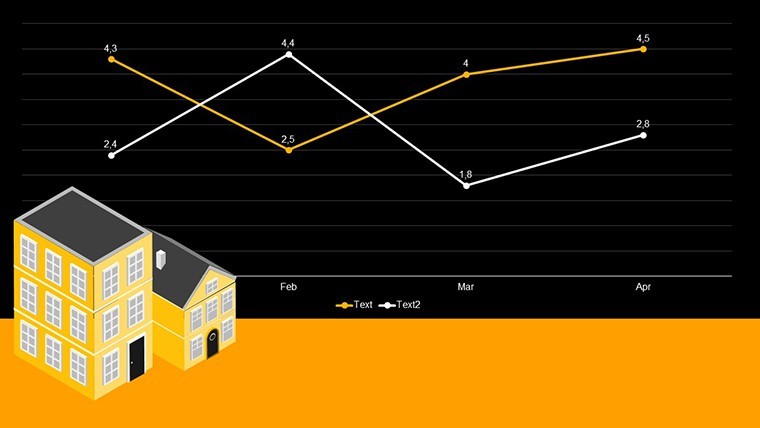
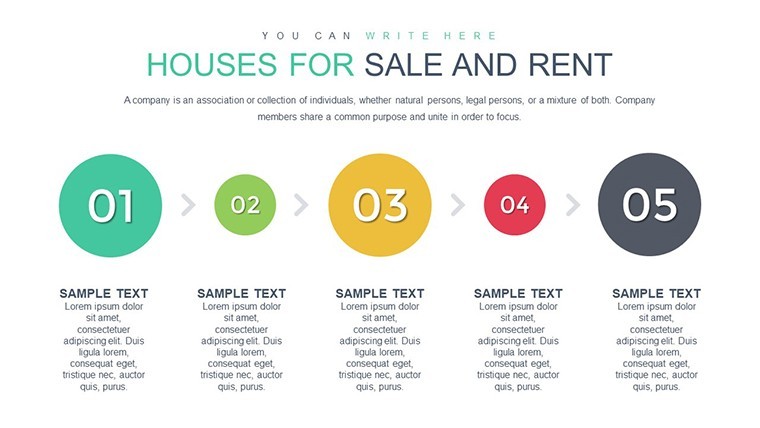
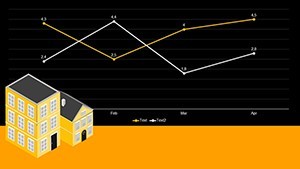
Picture this: You're preparing a presentation for a potential tenant interested in urban rentals. Start with an introductory slide featuring a striking image of the property, followed by a timeline chart outlining lease terms. Use bubble charts to illustrate amenity comparisons - proximity to public transport versus parking availability - making your pitch irresistible. For sales agents, integrate line graphs showing property value appreciation over time, backed by data from sources like Zillow or Redfin, to build credibility. In educational settings, property managers can use these slides to train teams on market dynamics, perhaps during quarterly reviews. A real-world example comes from a Florida real estate firm that used analogous charts to visualize hurricane-resistant features in homes, resulting in a 25% uptick in sales during peak season. This template isn't just about displaying data; it's about solving pain points like unclear pricing or vague descriptions, turning viewers into committed clients.
Step-by-Step Guide to Customizing Your Presentation
- Select Your Base Slide: Choose from the 50 options based on your focus - sales, rentals, or mixed portfolios.
- Input Data: Populate charts with real-time figures, such as average rent in your area, using Keynote's intuitive tools.
- Customize Visuals: Adjust colors to evoke emotions - warm tones for family homes, cool for professional rentals.
- Add Personal Touches: Insert photos of actual properties or client testimonials for authenticity.
- Review and Refine: Use animations sparingly to highlight key stats, ensuring the flow feels natural.
- Export and Share: Save in various formats for easy distribution via email or virtual meetings.
This workflow integrates seamlessly with tools like MLS databases, allowing you to pull in live data for up-to-date presentations. Compared to standard Keynote blanks, this template saves hours by pre-populating real estate-relevant structures, reducing the risk of design errors that could undermine your professionalism.
Enhance Your Expertise with Proven Design Tips
As an SEO and design expert, I recommend adhering to principles like the Rule of Thirds for slide composition, ensuring charts aren't overcrowded. For real estate, always include alt text for images, such as "interactive rental yield bar chart," to improve accessibility and searchability if shared online. Incorporate subtle humor where appropriate - like a pie chart titled "Why This Home is a Slice of Heaven" - to keep audiences engaged without detracting from the message. Trust in this template's alignment with AIA-inspired visual standards for architectural elements in property plans, adding an authoritative layer. Users have reported feeling more confident in pitches, knowing their materials reflect industry-leading quality.
Why Choose This Over Generic Options?
Unlike free downloads that lack polish, this paid template offers premium, royalty-free assets, ensuring no copyright issues. It outperforms basic PowerPoint conversions by being natively optimized for Keynote's animations and transitions, providing smoother experiences on Apple devices. In a market where 70% of buyers start online (per NAR stats), having downloadable, shareable PDFs from your presentations can extend your reach, driving more leads.
Ready to revolutionize how you present properties? Download this template today and watch your real estate game soar. Customize it to fit your unique style and start closing more deals with visuals that speak volumes.
Frequently Asked Questions
- How editable are the charts in this template?
- All 50 slides are fully editable in Keynote, allowing you to modify data, colors, and layouts effortlessly.
- Is this template suitable for beginners in real estate?
- Absolutely - its intuitive design makes it accessible for new agents while offering depth for seasoned pros.
- Can I use this for both sales and rental presentations?
- Yes, the versatile slides cover listings, pricing, and market analysis for any property type.
- What file formats are supported?
- Primarily .key for Keynote, with export options to PDF or images for broader sharing.
- Are there any industry-specific icons included?
- Yes, high-quality icons like home keys and location pins tailored to real estate visuals.