Energy Power Company Keynote Charts: Fuel Your Industry Presentations


Type: Keynote Charts template
Category: Illustrations
Sources Available: .key
Product ID: KC00750
Template incl.: 47 editable slides
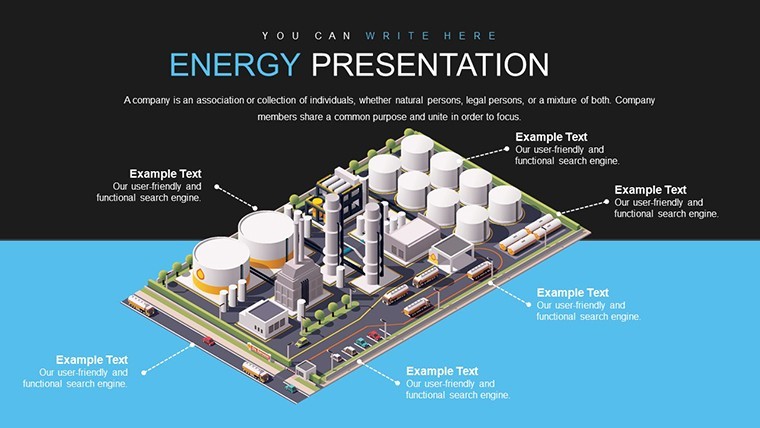
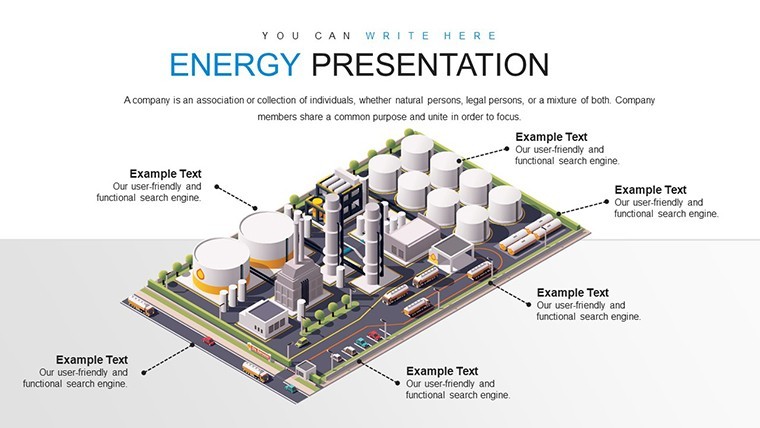
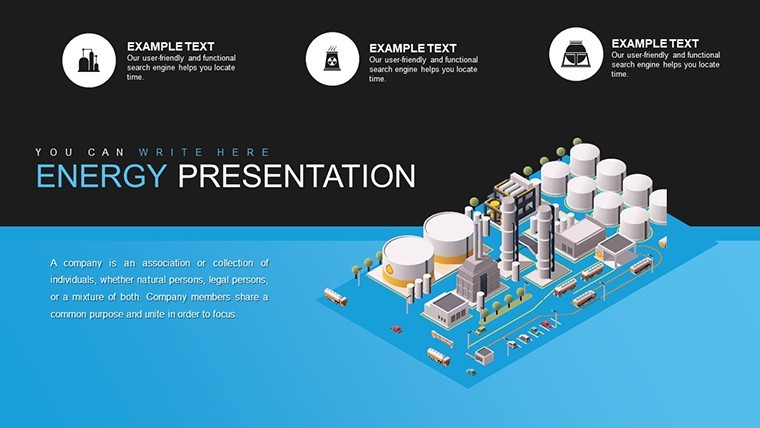
The energy sector thrives on precision and foresight, where data on fuel, oil, and electricity can shape multimillion-dollar decisions. Our Energy Power Company Keynote Charts template, with 47 editable slides, is crafted for economists, financiers, energy managers, and electrical engineers seeking to illustrate complex industrial dynamics. From mapping production workflows to analyzing market fluctuations, this tool draws on standards from the International Energy Agency (IEA), helping you present with authority and clarity. It's more than slides - it's a catalyst for informed strategies in a volatile industry, enabling you to highlight efficiencies and innovations that drive sustainability and profitability.
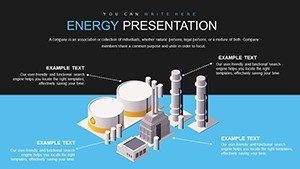
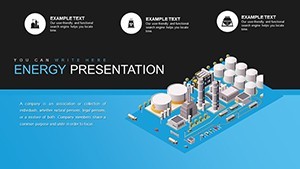
Illuminate Energy Data with Specialized Visuals
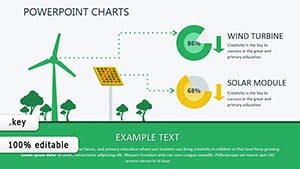
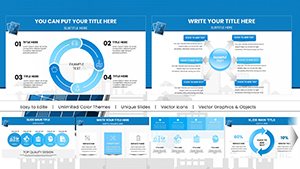
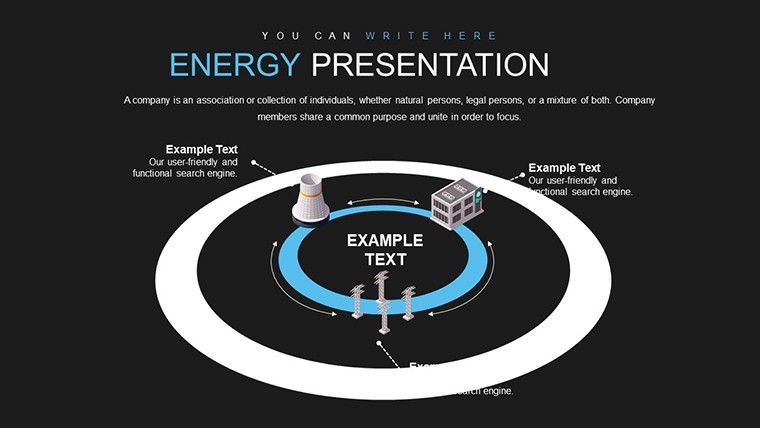
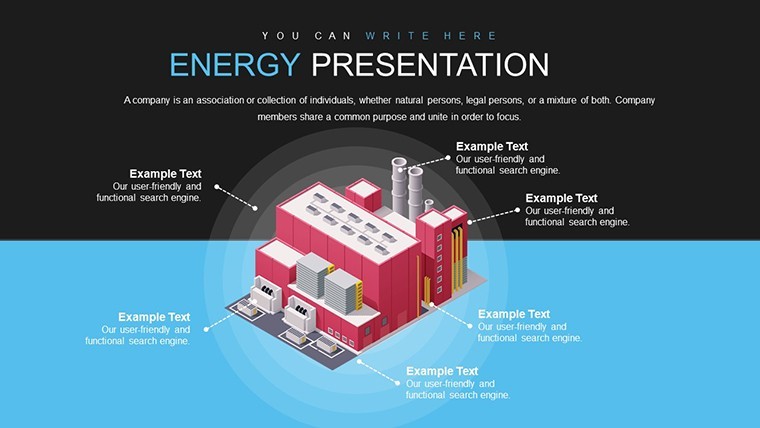
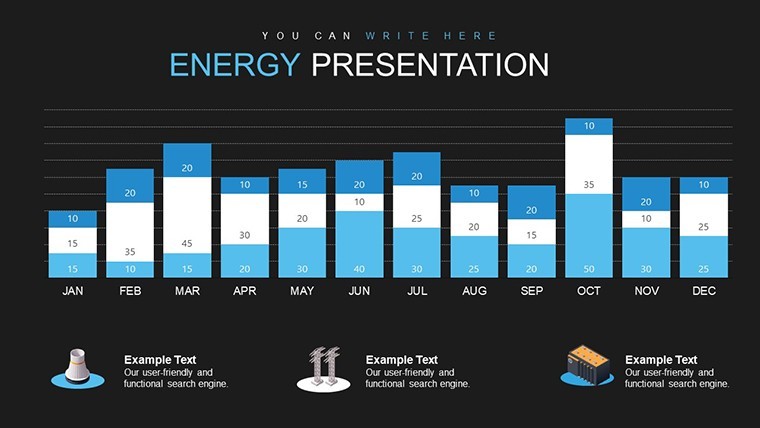
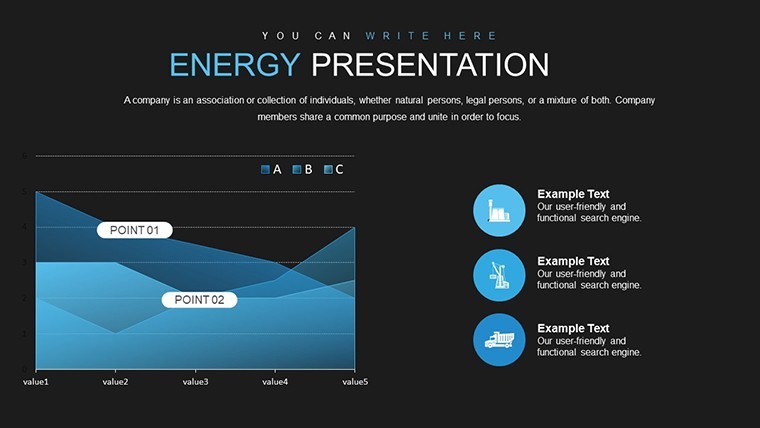
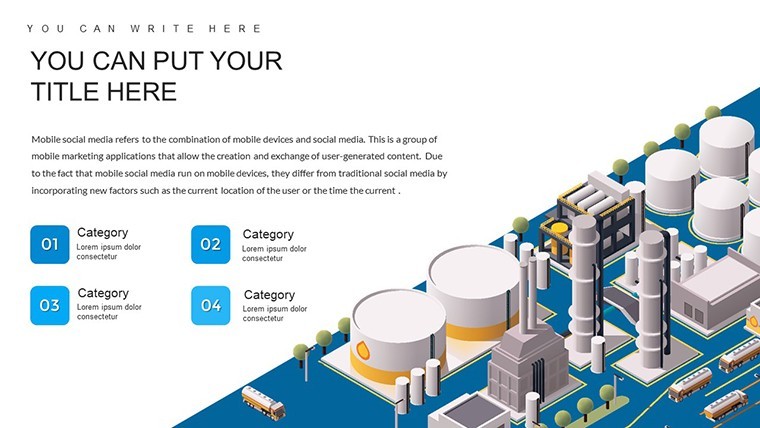
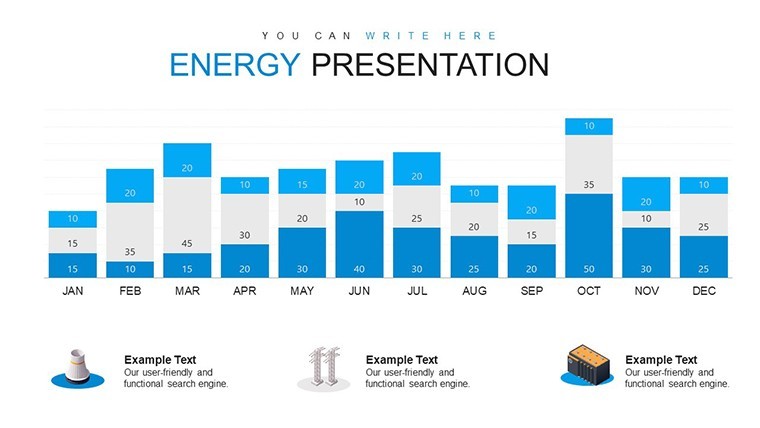
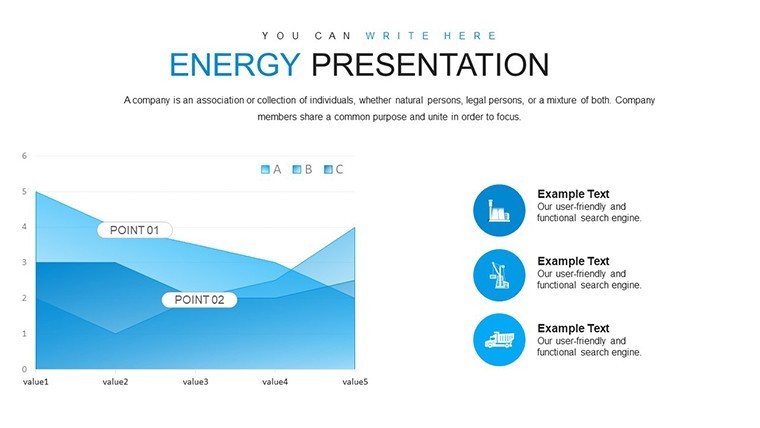
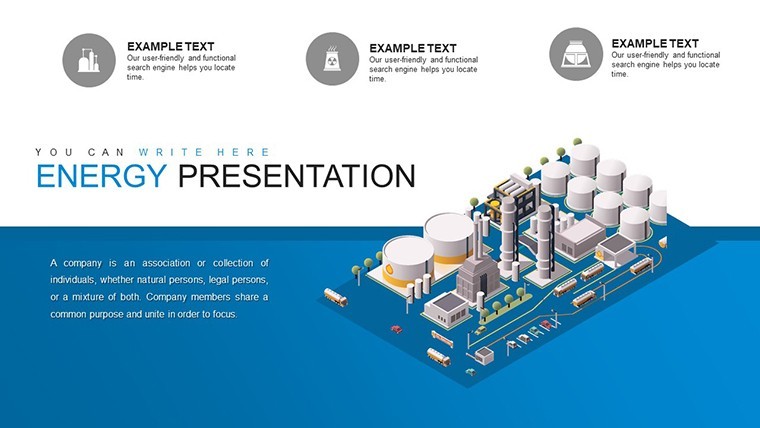
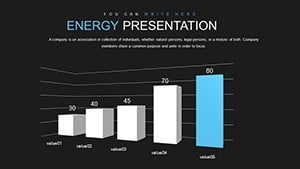
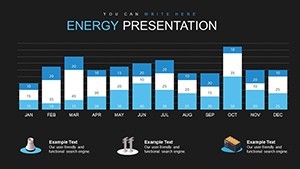
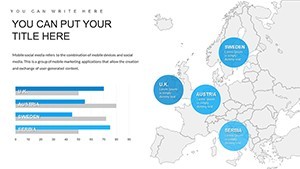
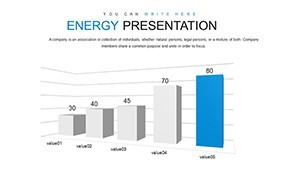
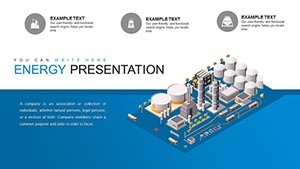
Energy presentations demand robust visuals, and this template provides them with charts optimized for sector-specific metrics like consumption rates and reserve estimates. Earthy tones - deep blues for electricity, warm oranges for oil - offer a thematic base, fully adjustable. Per EIA reports, visual data aids retention by 400%, a boon this template exploits. An oil firm in Texas, using comparable charts, optimized drilling plans, cutting costs by 15%.
Core Features for Energy Expertise
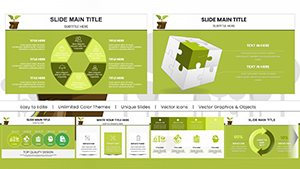
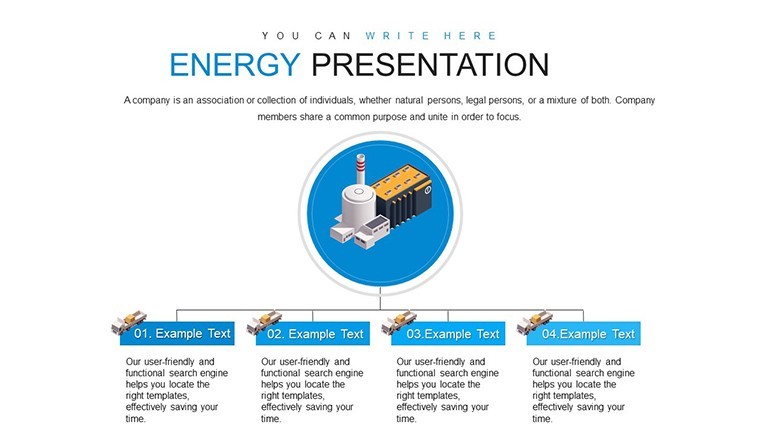
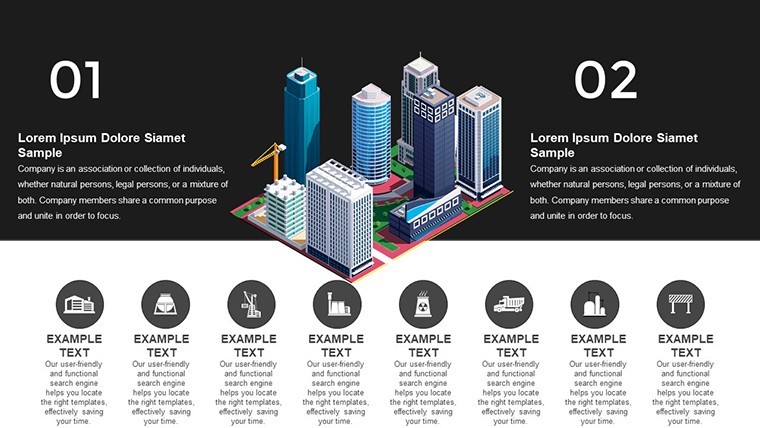
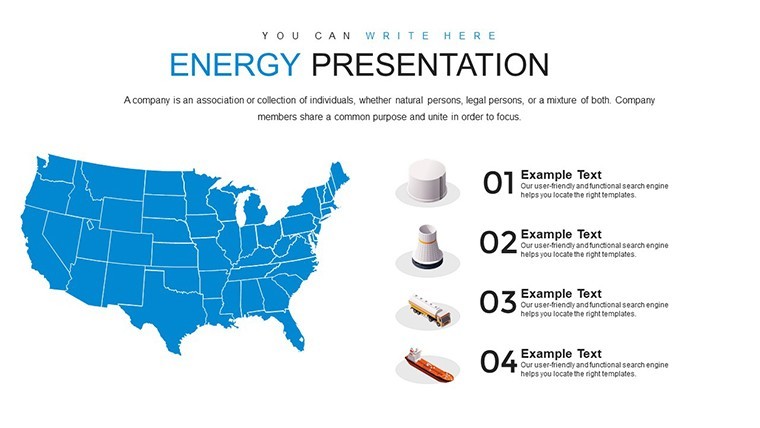
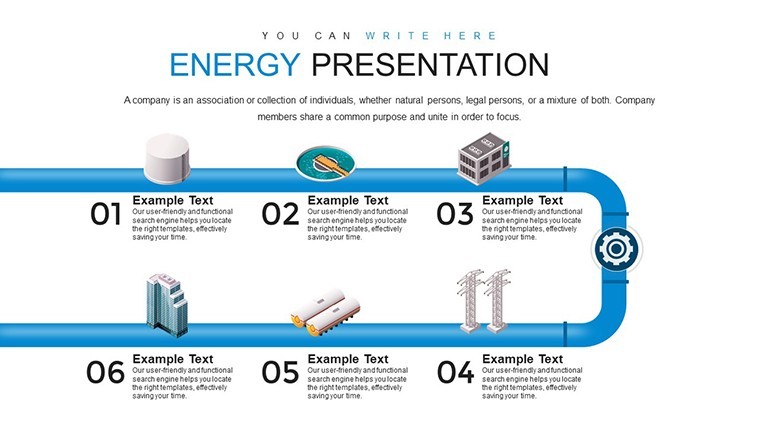
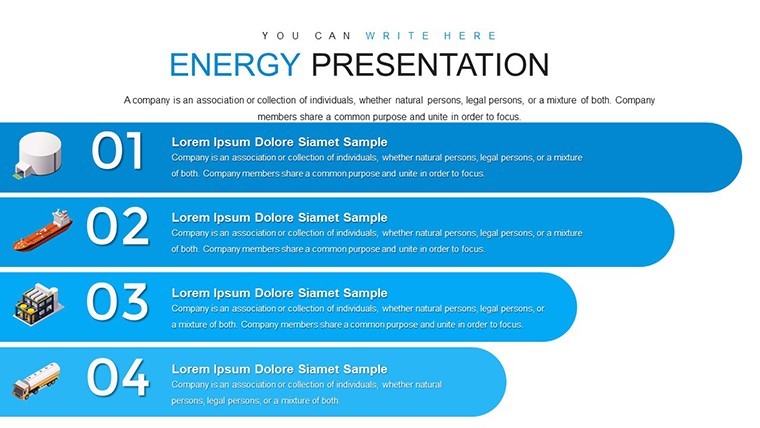
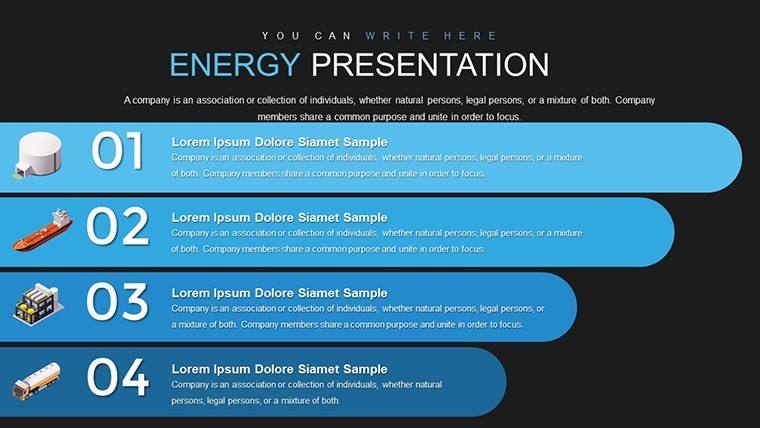
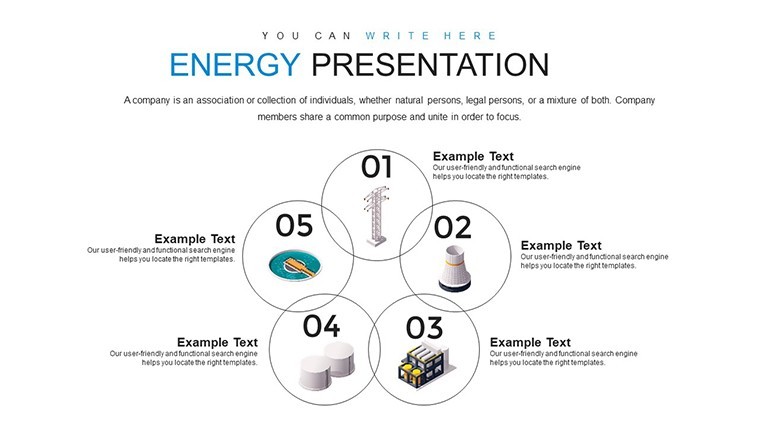
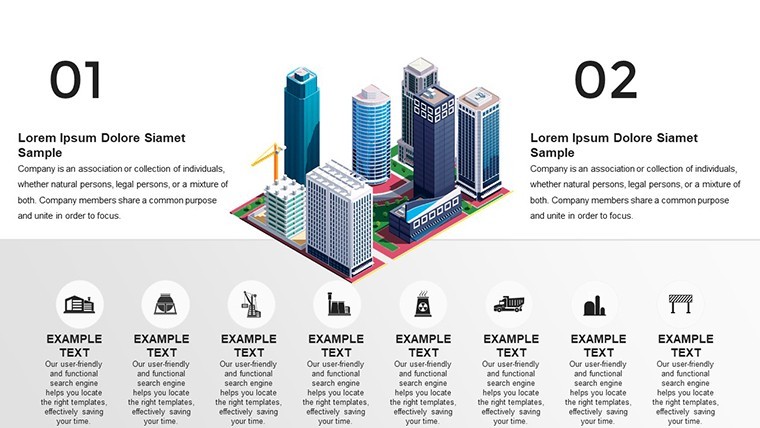
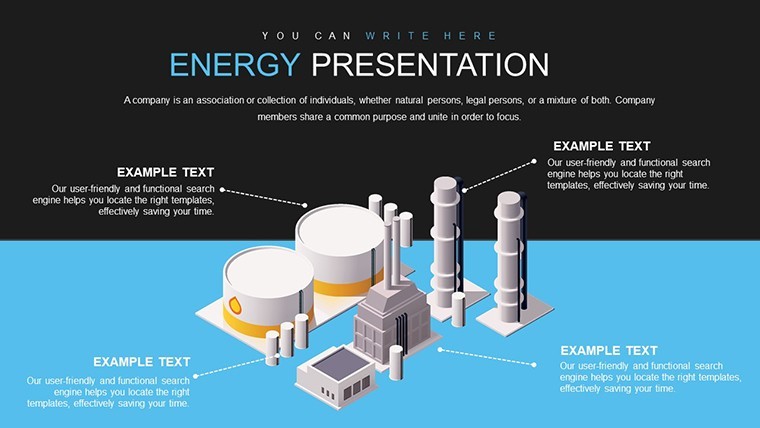
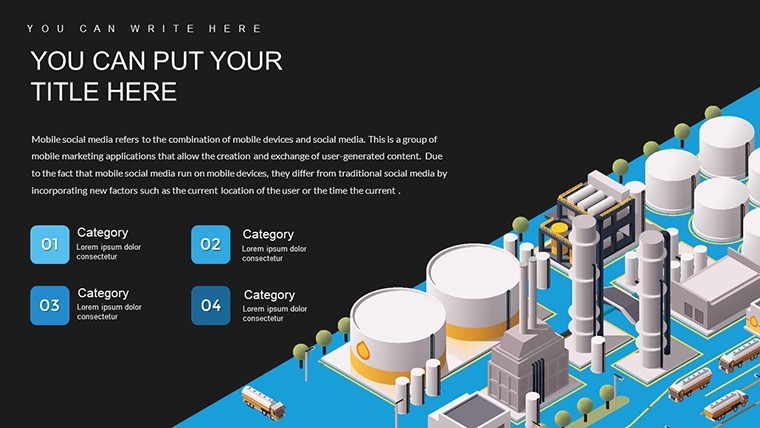
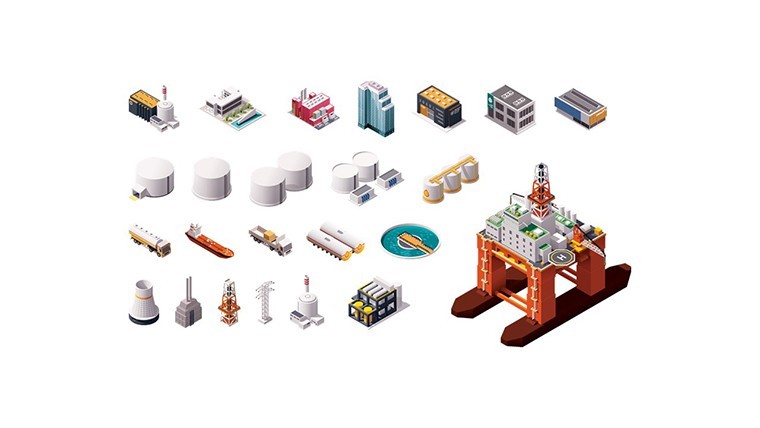
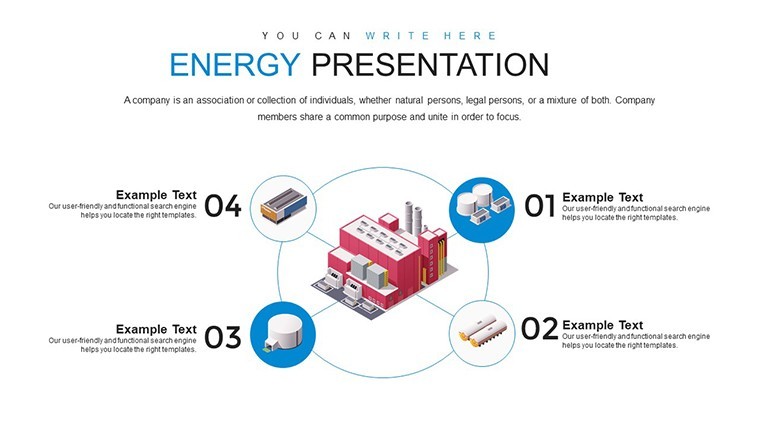
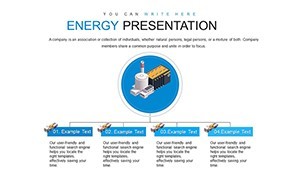
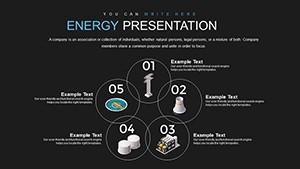
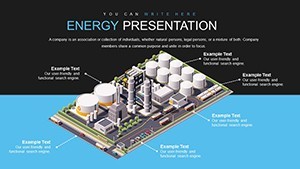
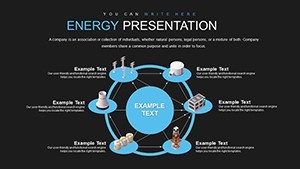
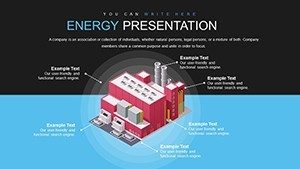
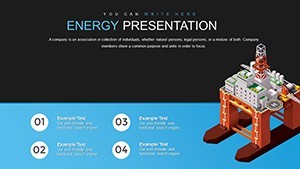
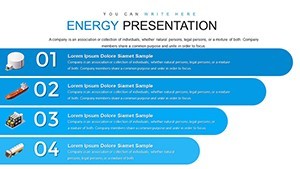
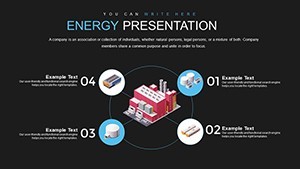
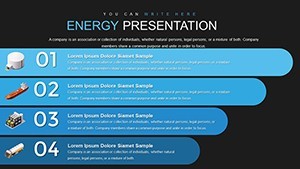
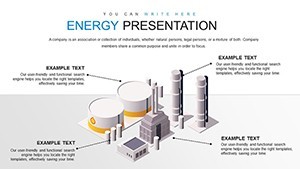
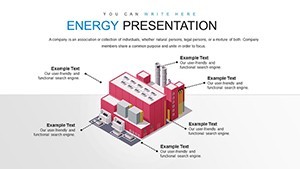
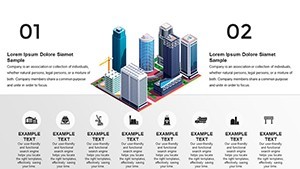
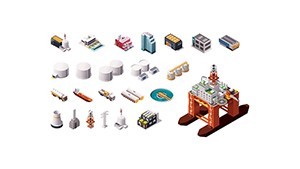
- 47 Editable Slides: Dedicated to industrial objects, fuel charts, and sector overviews.
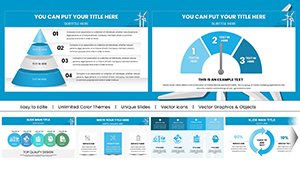
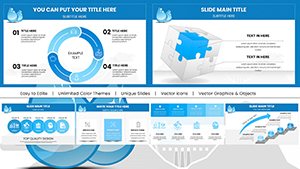
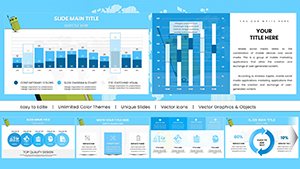
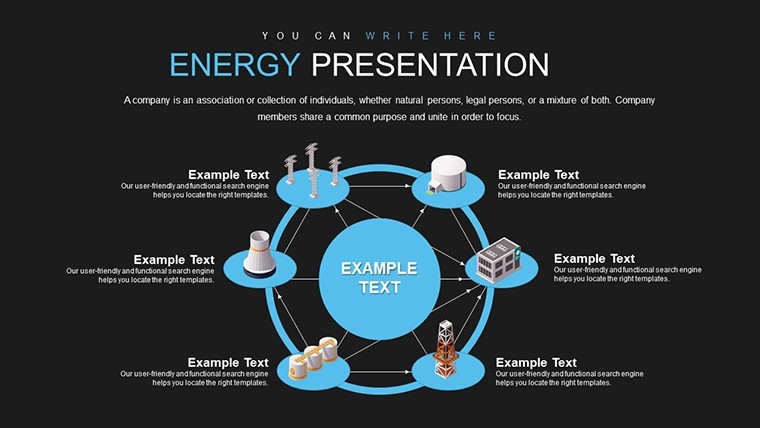
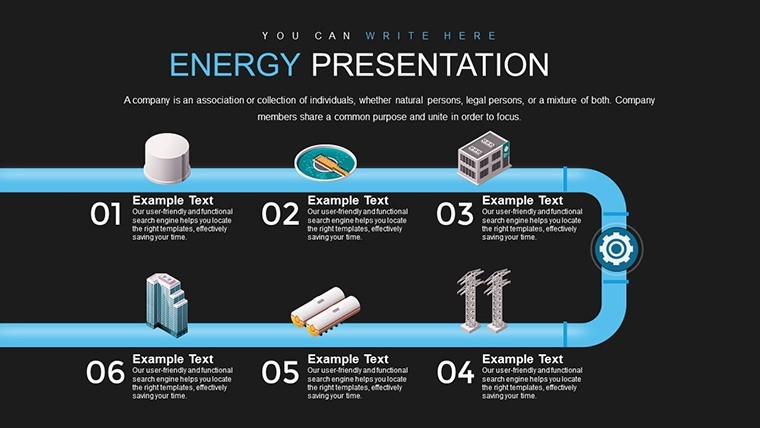
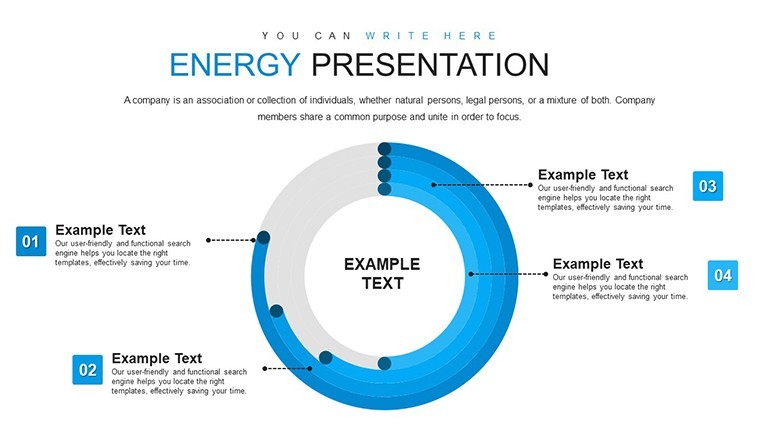
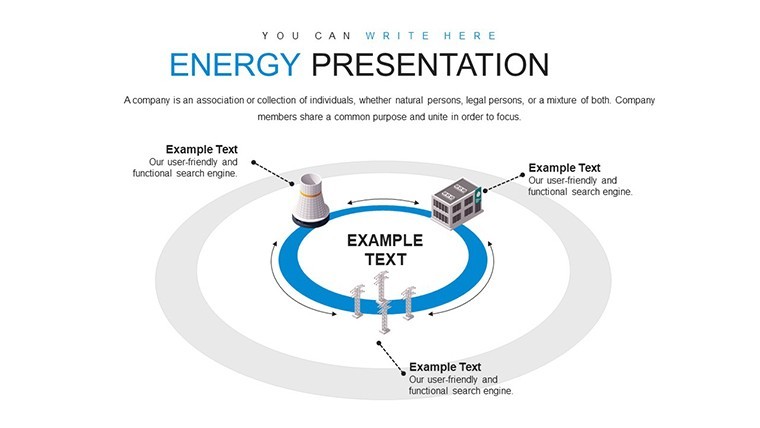
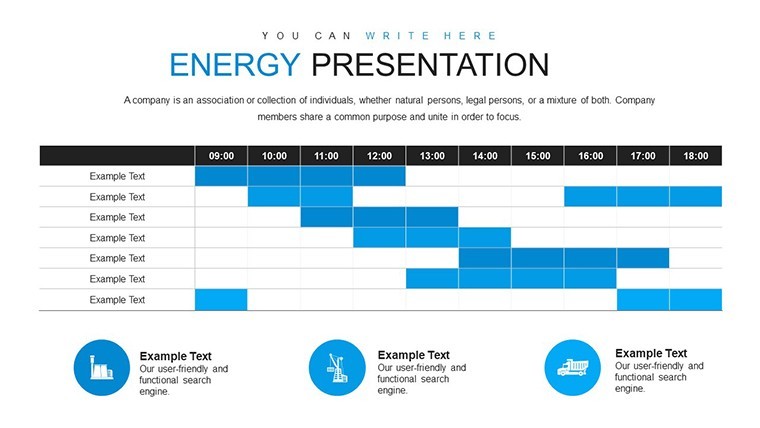
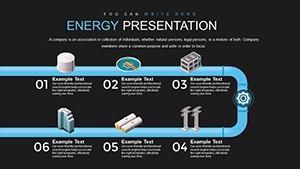
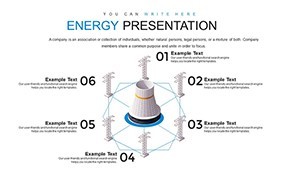
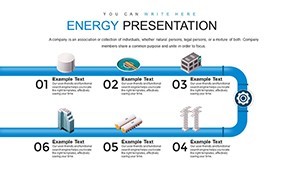
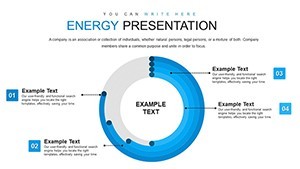
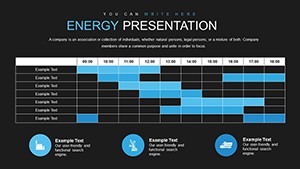
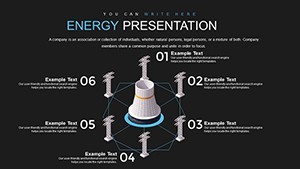
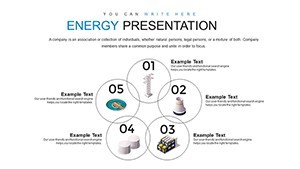
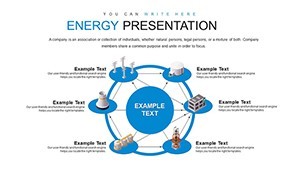
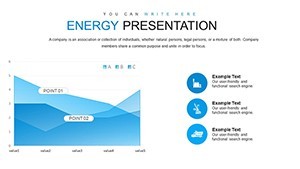
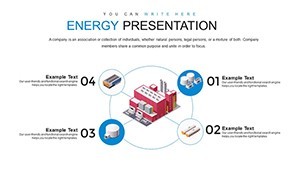
- Industry-Tailored Charts: Flow diagrams for power grids, bar graphs for fuel comparisons.
- Customization Depth: Modify data, icons, and layouts for precise storytelling.
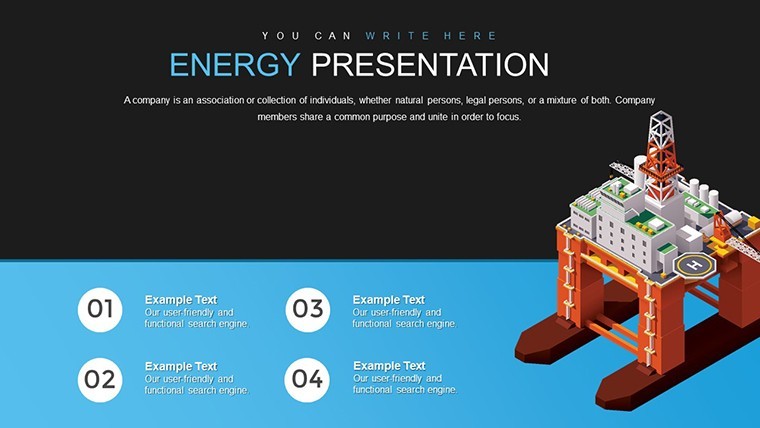
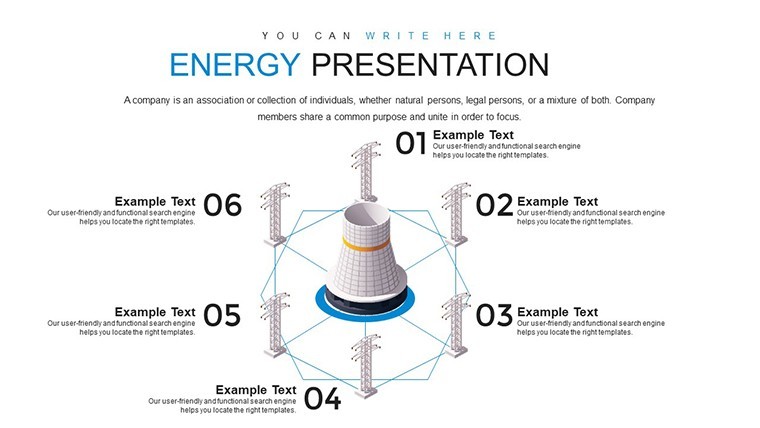
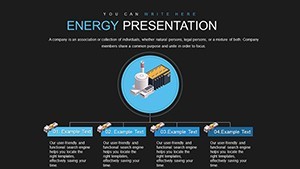
- Professional Icons: Symbols for rigs, turbines, and pipelines.
- Efficient Editing: Keynote-native for quick updates.
LSI integration like "renewable energy visualizations" and "fossil fuel analytics" adds nuanced depth.
Targeted Use Cases in the Energy Field
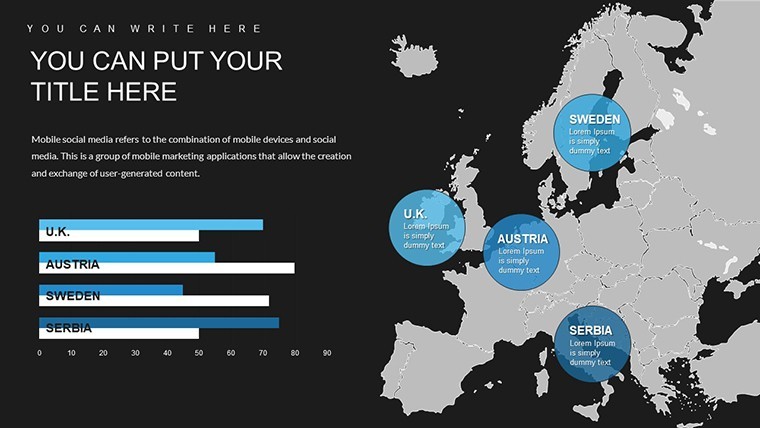
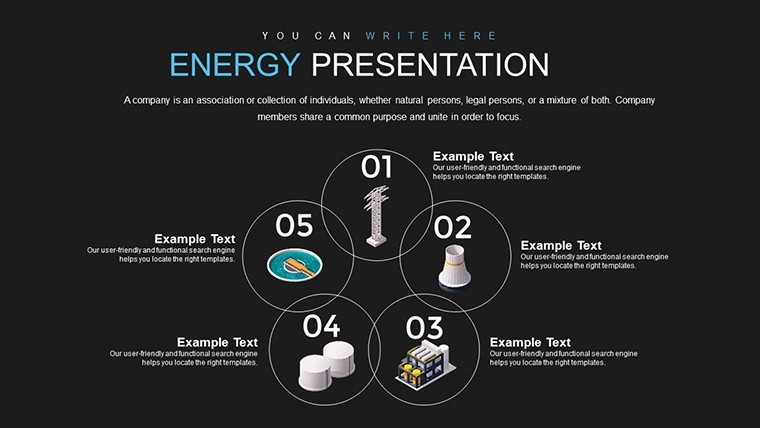
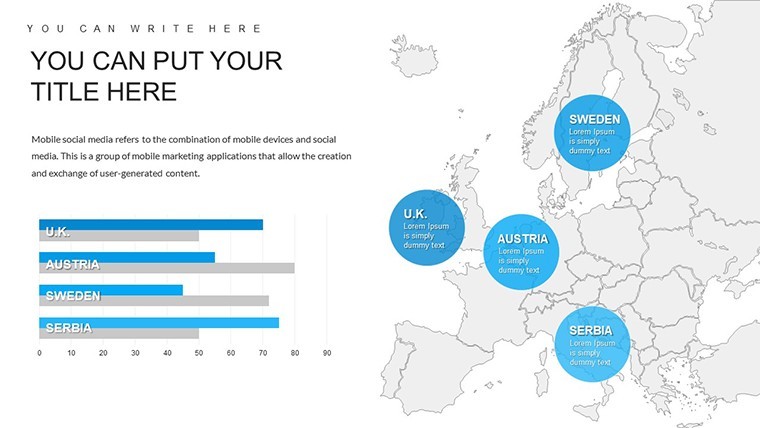
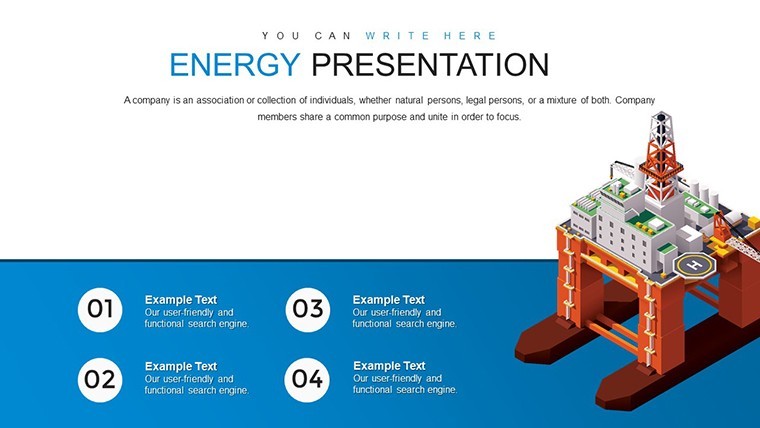
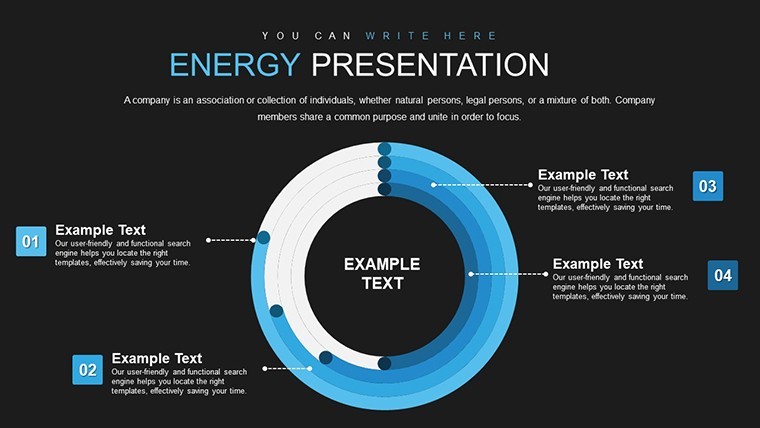
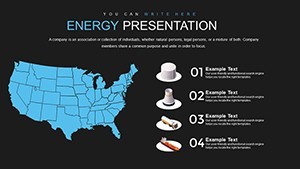
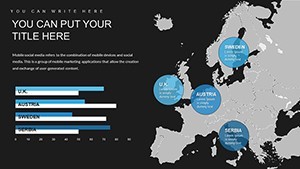
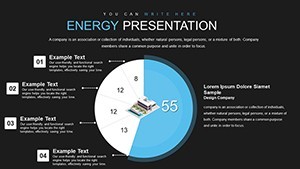
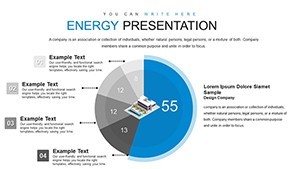
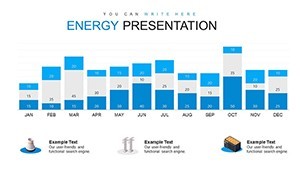
For an energy manager reviewing quarterly outputs, deploy line charts tracking electricity generation versus demand. Financiers can use pie charts to break down investment portfolios in renewables versus fossils, citing BloombergNEF data. Electrical engineers might illustrate grid stability with network diagrams. A European utility company applied similar visuals to advocate for green transitions, securing funding increases of 25%. This template resolves issues like data silos by consolidating insights, promoting collaborative advancements.
Step-by-Step Energy Chart Creation
- Identify Focus Areas: Select slides for oil, electricity, or hybrid topics.
- Enter Sector Data: Input figures from databases like OPEC reports.
- Enhance Visuals: Apply colors reflecting energy types for intuitive understanding.
- Incorporate Details: Add annotations on industrial objects.
- Test and Tweak: Simulate presentations for flow.
- Share Securely: Export for stakeholder reviews.
Outshines basics by offering energy-centric structures, integrating with tools like MATLAB exports.
Insights from an Energy Specialist
Adhere to API standards for oil data accuracy in charts. Infuse inspiration with nods to innovations like solar integrations. Build trust via sourced metrics, aligning with ISO 50001 for energy management. This empowers users to deliver presentations that resonate in boardrooms.
Advantages in a Competitive Arena
Premium over free alternatives with specialized assets; superior Keynote handling for technical details.
Power up your presentations - download this template and energize your career.
Frequently Asked Questions
- What sectors does this cover?
- Oil, electricity, and general fuel industries with 47 slides.
- Is it for technical audiences only?
- No, accessible for financiers and managers too.
- Can I add custom data?
- Yes, fully editable for real-time integrations.
- Are icons energy-specific?
- Absolutely, including turbines and rigs.
- How to handle complex datasets?
- Use built-in charts for simplification.
- Compatible with other software?
- Primarily Keynote, with PDF exports.