Promo code "00LAYOUTS"
Information Technology Keynote Charts Template
Type: Keynote Charts template
Category: Relationship, Analysis
Sources Available: .pptx
Product ID: KC00738
Template incl.: 32 editable slides
In the ever-evolving realm of information technology, where systems and processes underpin innovation, presenting complex ideas effectively can make or break project success. Our Information Technology Keynote Charts Template equips IT professionals, educators, and entrepreneurs with 32 editable slides to visualize technical landscapes, from cloud architectures to cybersecurity frameworks. Inspired by industry standards like those from NIST, this tool turns data-heavy topics into engaging stories, helping audiences grasp intricate relationships without overwhelm.
Perfect for tech mentors explaining agile methodologies or CIOs pitching digital transformations, the template's widescreen format and animations bring life to static concepts. Imagine detailing a network topology in a way that highlights interconnections, fostering better collaboration in hybrid work environments.
Its accessibility shines: vector elements allow modifications without expertise, addressing common pitfalls like pixelation in resized diagrams.
Standout Features for Tech Presentations
With 32 slides, enjoy creative designs, object animations, and integration capabilities. Each chart supports media embeds, enhancing multimedia experiences.
- Animated Objects: Special effects per element for phased reveals in process flows.
- Vector Scalability: Modify without quality dips, ideal for large screens.
- Template-Based Prep: Build on pre-existing slides for efficiency.
- Keynote Harmony: Full features like transitions on Apple platforms.
This edges out vanilla options by offering IT-specific styling, reducing creation time significantly.
Comprehensive Slide Overviews
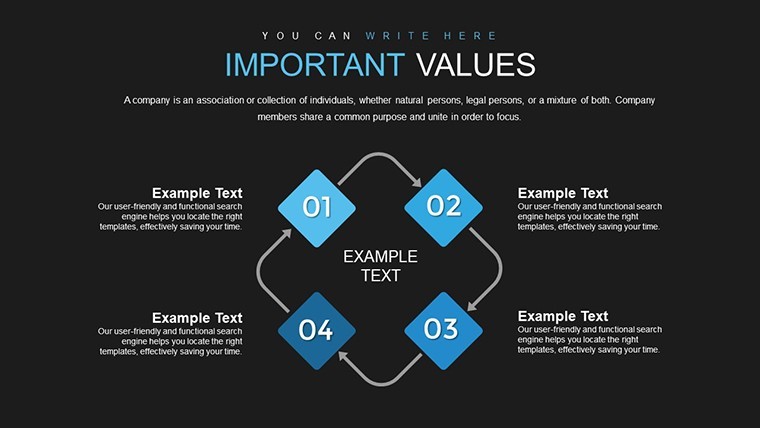
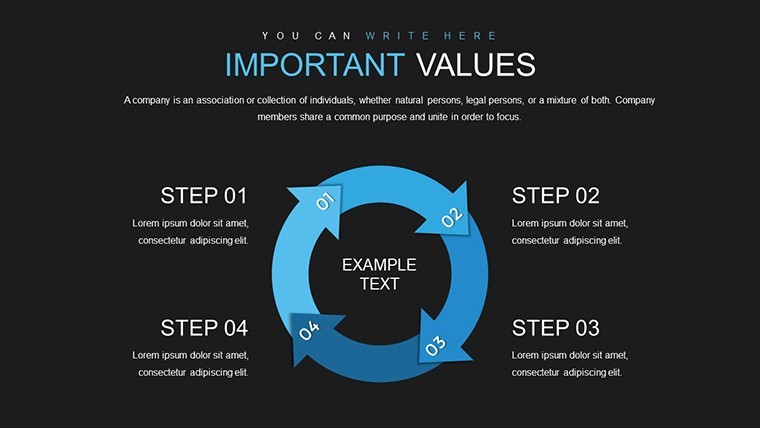
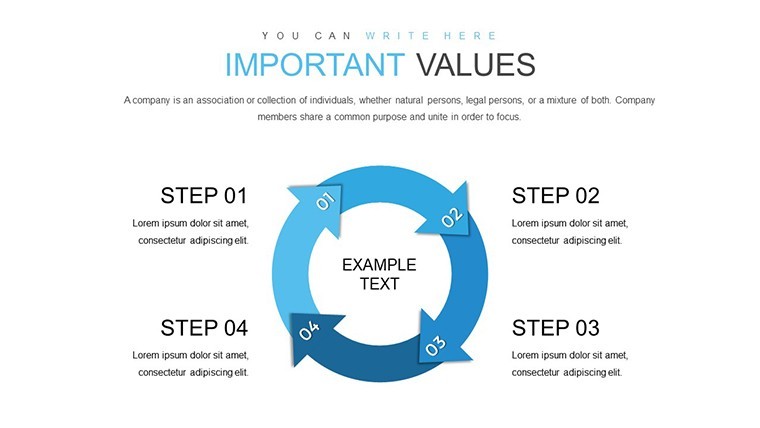
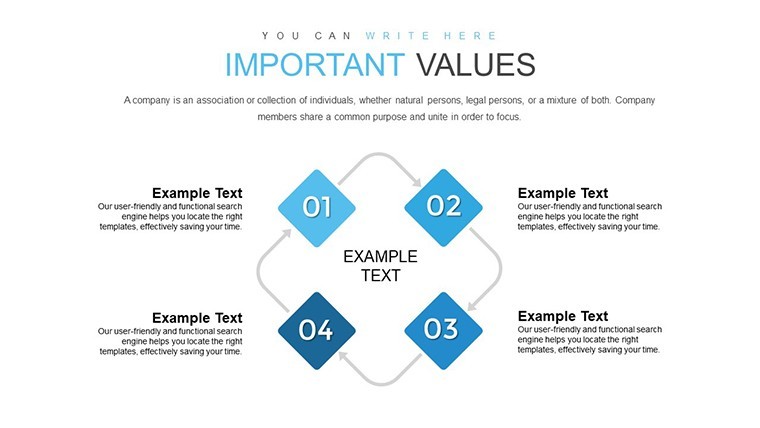
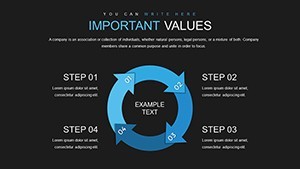
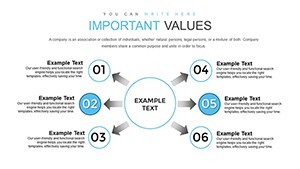
Slide 4 showcases flowchart processes, with arrows animating to trace data flows. Slide 9 integrates databases with ER diagrams, customizable for relational models.
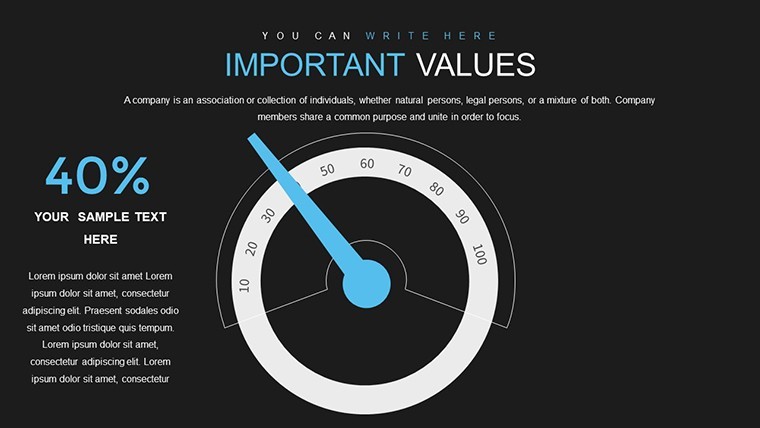
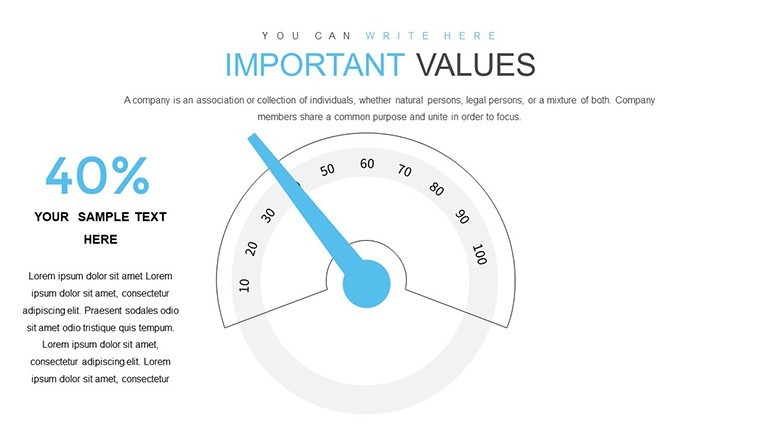
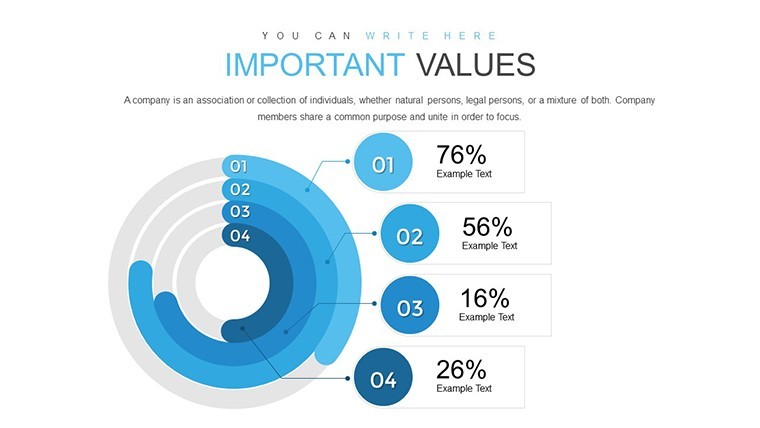
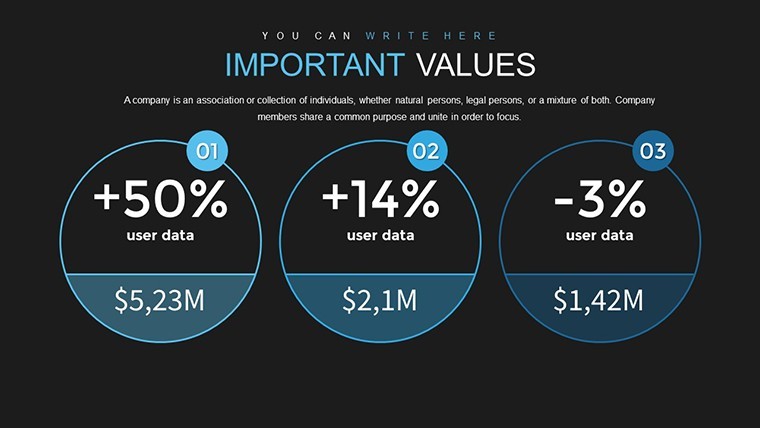
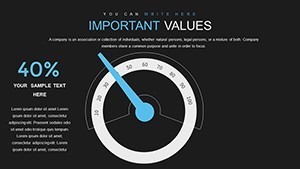
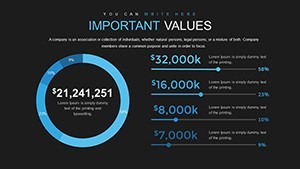
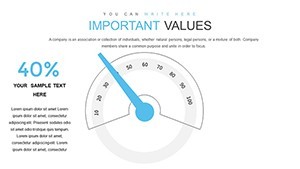
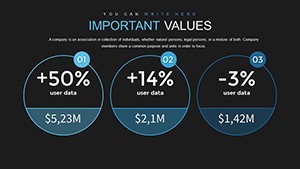
Slides 20-25 feature dashboards with gauges for metrics like uptime, auto-adjusting with inputs. This solves disjointed presentations, as in DevOps reviews where visuals align with CI/CD pipelines.
Versatile Use Cases in IT
From lectures on AI ethics to enterprise audits, adapt for diverse needs. In cybersecurity training, map threat vectors; in software dev, outline SDLC stages.
Implementation guide: Select chart type. Input tech data. Apply animations. Embed videos for demos. Deliver with authority.
Grounded in sources like IEEE standards, it builds credibility, encouraging "Innovate your IT talks today."
Tips for Tech Presentation Excellence
Blend terms like "system architecture diagrams" fluidly. Humor note: "Don't let your charts crash - keep them vector!" Link with Jira for project visuals in Keynote.
Unleash your IT insights - grab this template to propel your presentations forward.
Frequently Asked Questions
- Editing ease for non-designers?
- Highly intuitive, with drag edits and no quality loss.
- Supports multimedia?
- Yes, add photos, videos, music seamlessly.
- Best for which IT areas?
- Systems, processes, analysis, relationships.
- Download format?
- .key for Keynote compatibility.
- Animation tweaks?
- Customizable per object for tailored effects.
- Data table integration?
- Built-in for hybrid chart-table slides.

