Fishbone Diagrams Keynote Charts - Editable | ImagineLayout


Type: Keynote Charts template
Category: Analysis
Sources Available: .key
Product ID: KC00732
Template incl.: 22 editable slides
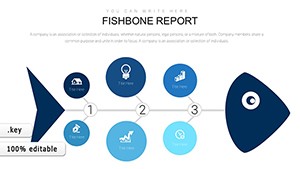
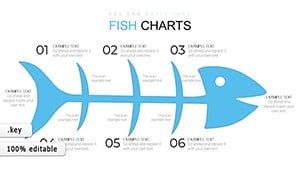
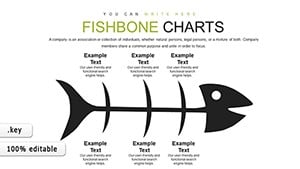
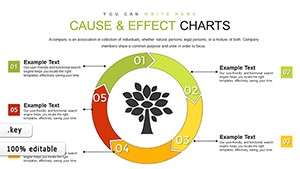
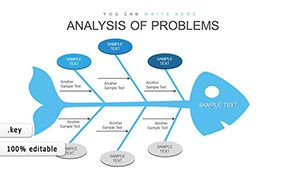
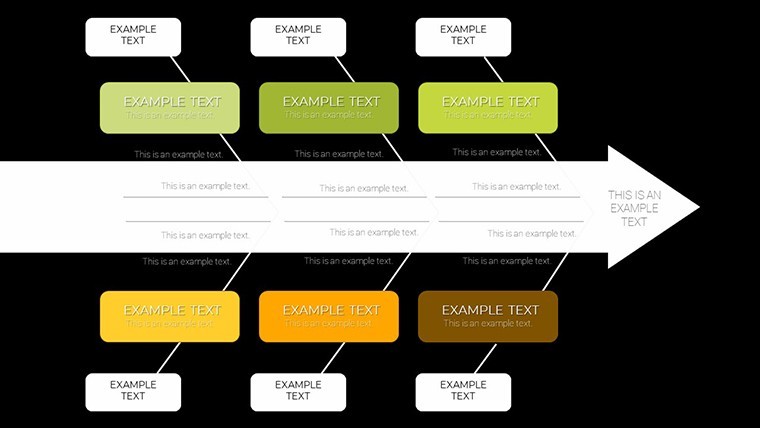
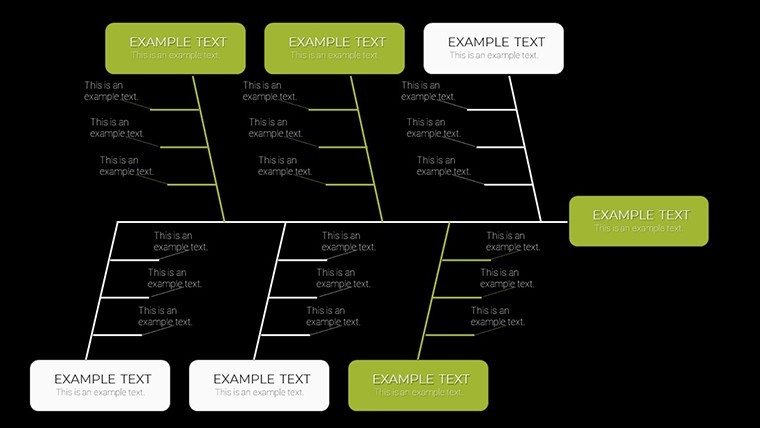
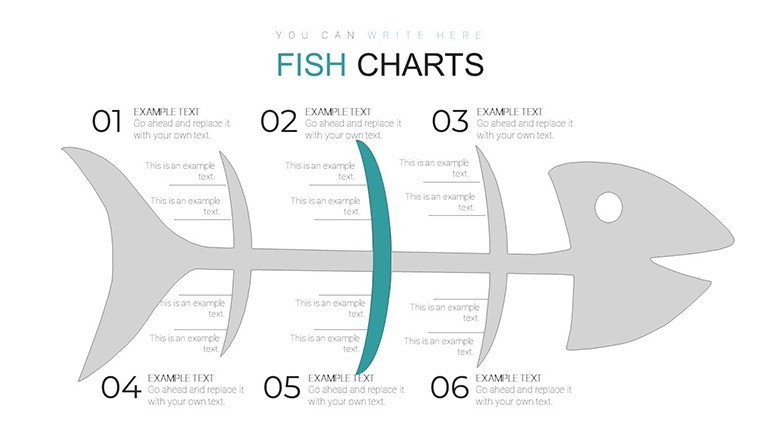
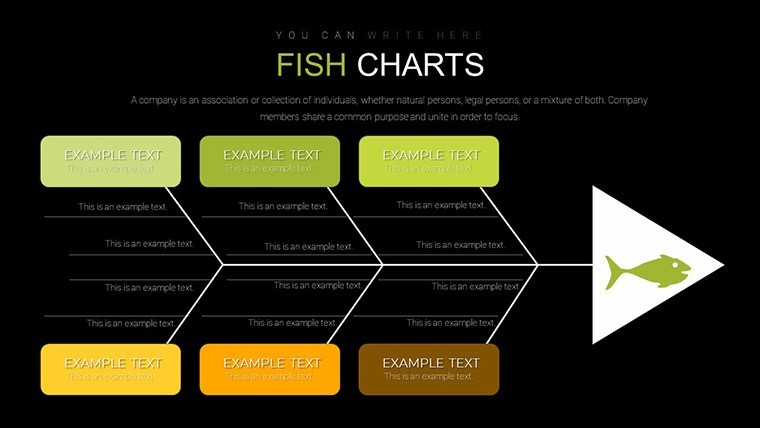
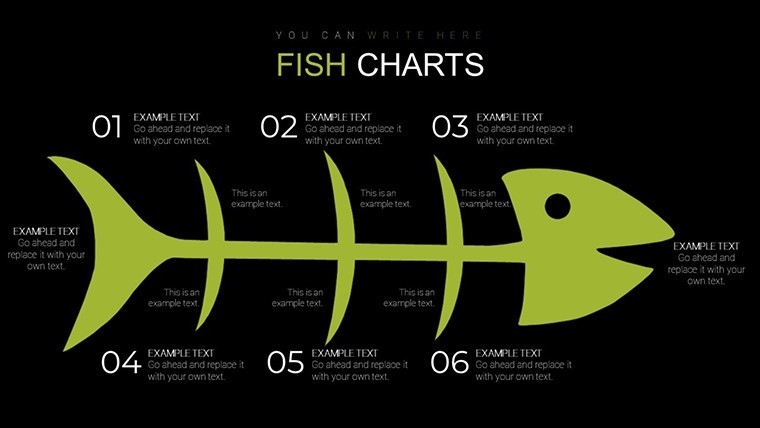
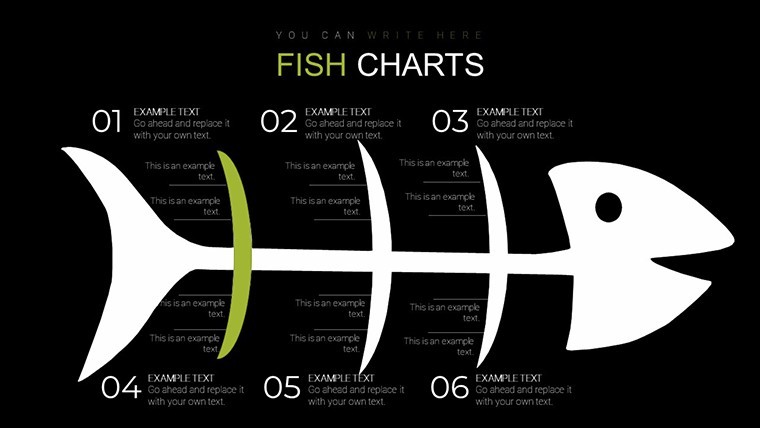
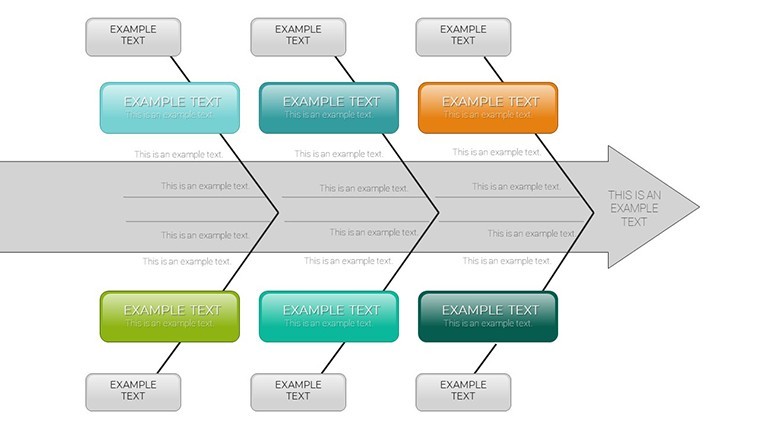
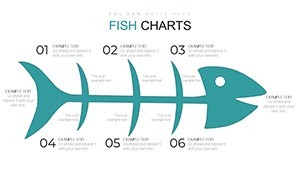
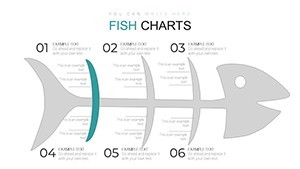
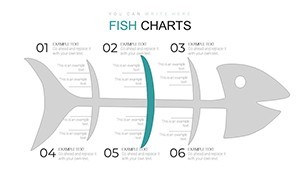
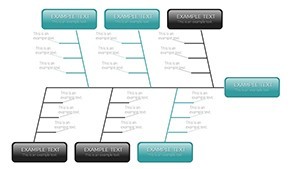
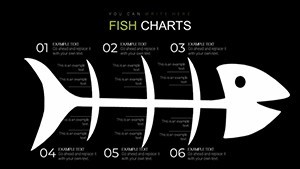
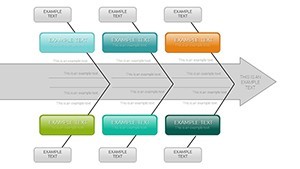
Fishbone Diagrams for Root Cause Analysis in Keynote
22 fishbone diagrams come ready in the KEY file. No setup needed.
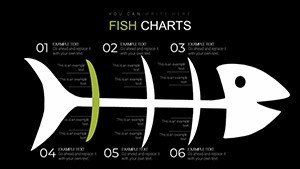
The paid version delivers all 22 editable slides with unlocked branch structures suited for cause and effect mapping during quality reviews or project troubleshooting sessions.
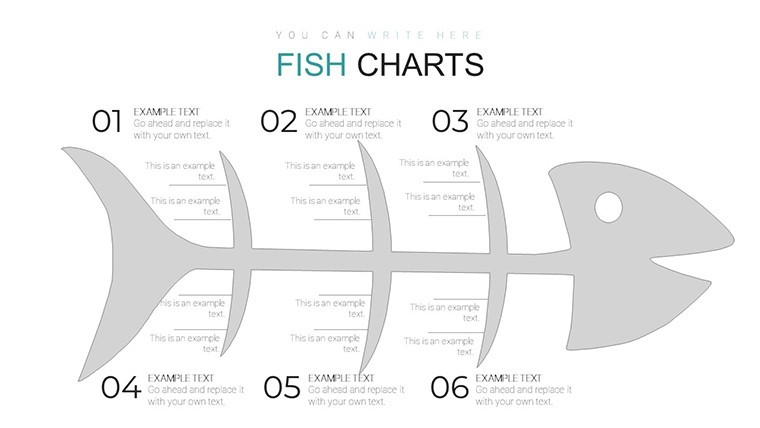
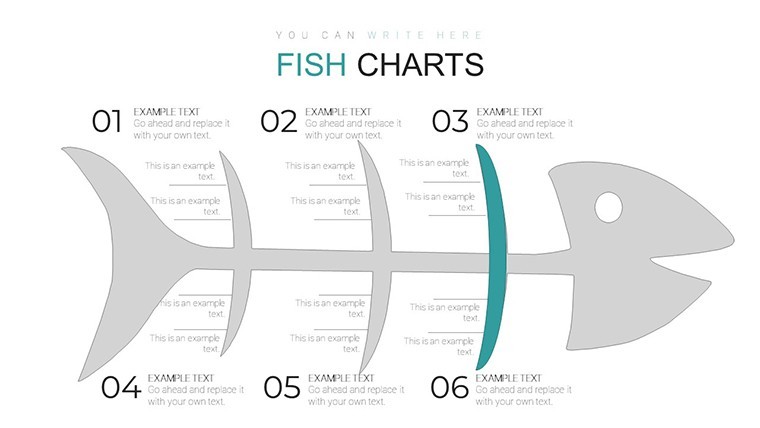
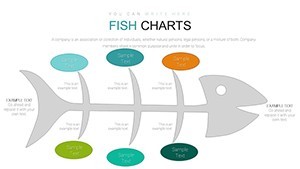
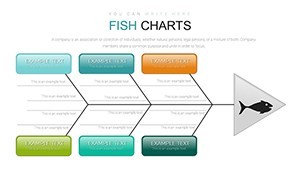
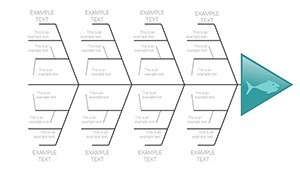
You drop in your data categories like people equipment or methods and the layout stays aligned automatically instead of building the diagrams from scratch in Keynote.
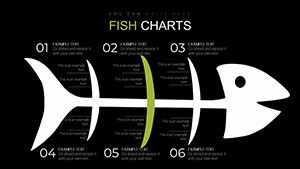
In most cases you only replace text and adjust colors via the slide master.
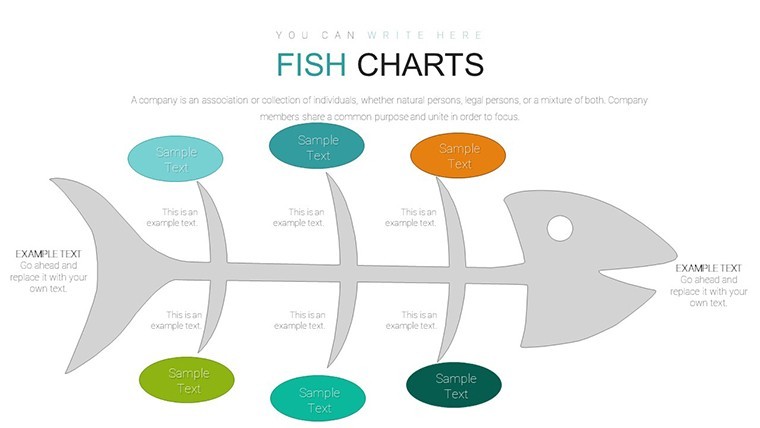
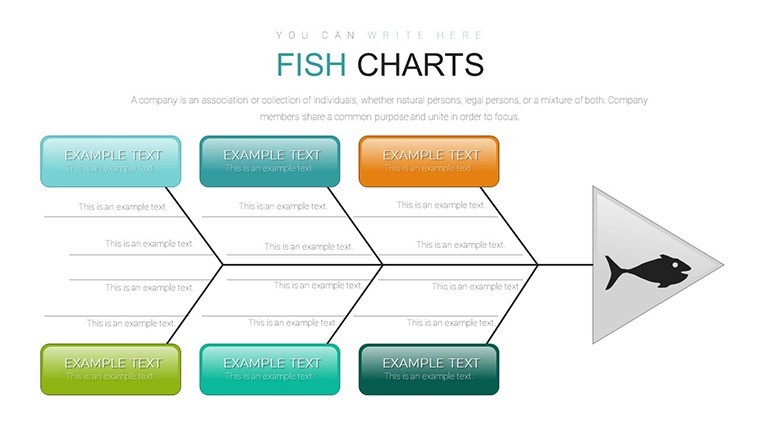
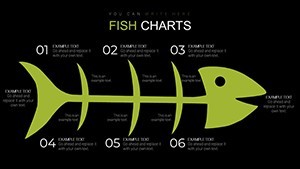
Project managers rely on this when they need to present the hierarchy of causes to stakeholders without any manual shape arrangement.
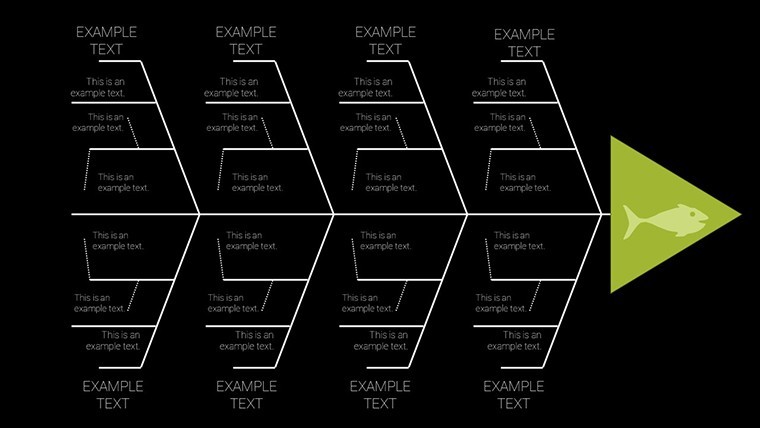
The branching structure supports root cause analysis so the team can decide which factor to address first after reviewing the visual.
This template works best for structured diagrams and is not ideal for data-heavy dashboards with lots of numbers.
It is not designed for creative storytelling slides that require freeform layouts.
Use this instead of redrawing fishbone shapes slide by slide.
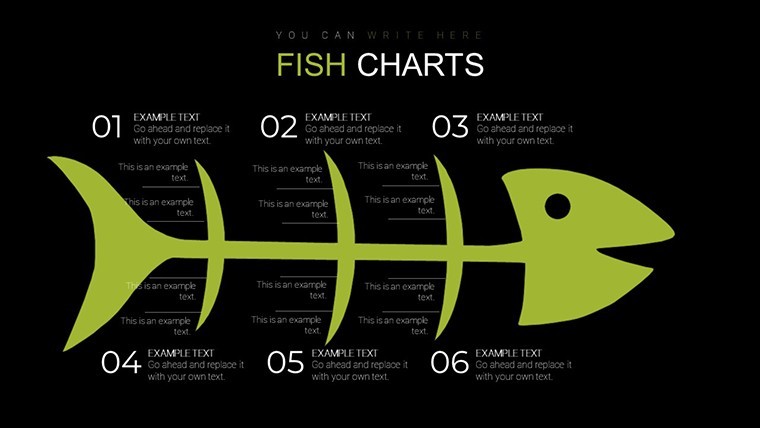
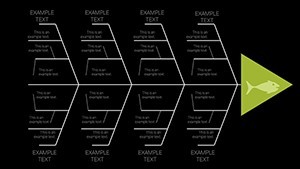
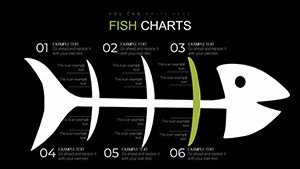
The predefined structures keep everything readable on one slide preventing overcrowded layouts during client presentations.
Typically teams reuse the same file across multiple reports by duplicating slides as needed.
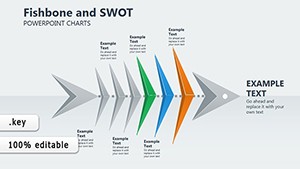
Check out the Fishbone Diagram Keynote Template for additional variety or the Analysis Ishikawa Fishbone Keynote Charts Template or visit the analysis category.
| Feature | Details |
|---|---|
| Slides / diagrams | 22 fishbone diagrams for cause and effect |
| File format | KEY |
| Software version | Keynote 9+ compatible with Mac and iPad |
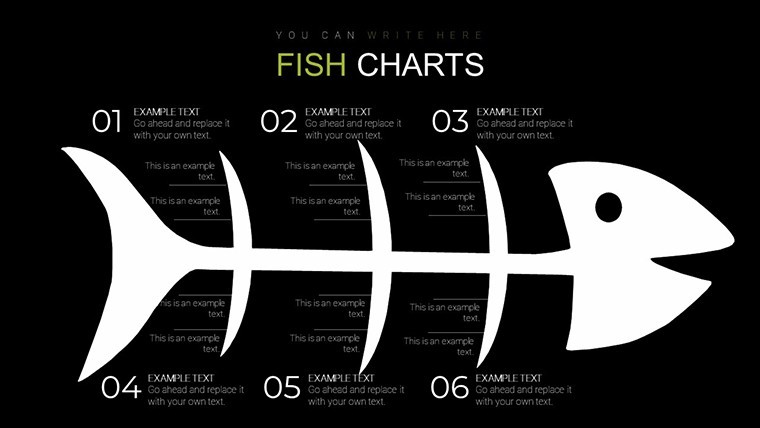
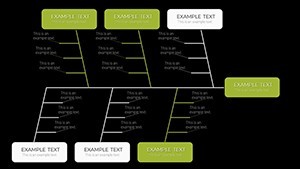
| Color schemes | Themed icons and color schemes updated via slide master |
| Editable elements | Branch structures text and colors resize and recolor independently |
| Aspect ratio | 16:9 widescreen |
| Free vs Paid | Paid version includes the full 22 editable slides |
| Masters / Backgrounds | Slide master for global color and layout updates |
What Keynote versions are supported?
The template works with Keynote '09 and later versions on any macOS installation. It maintains full editability on both desktop and iPad versions of the app. You can open it directly and all animations and transitions remain functional.
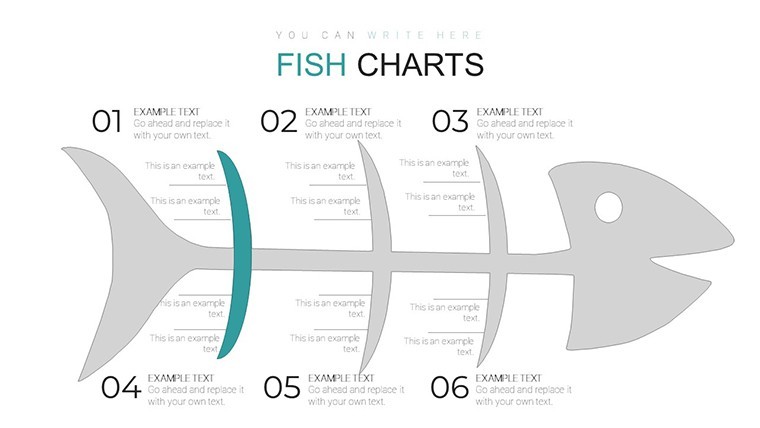
How do I change colors via the slide master?
Open the file in Keynote then select View and choose Edit Master Slides. Select the shapes or text on the master slide and update fill stroke or font color in the format panel. This single change applies across every slide instantly.
Can I use this template for client work?
You can use the template for client work under the standard license terms. Modify the slides and deliver the presentation file to your clients without restriction on the output. The only condition is that you do not resell or redistribute the original template file itself to third parties.
What is the difference between free and paid versions?
The paid version includes the complete set of 22 editable slides with all branch structures and icons unlocked. No free version is listed on the page so the purchase gives you the full file immediately. You receive everything needed for immediate use upon download.
What are the refund conditions?
Refunds are available if the template does not open correctly in your Keynote version within the first 14 days. Contact the support team with your purchase receipt and details of the issue for prompt processing. Note that once the file is downloaded and used the refund window closes per standard digital policy.
You open the file and start editing.
Download and start editing immediately