Manufacturing Process Keynote Charts Template - Editable KEY | ImagineLayout


Type: Keynote Charts template
Category: Business Models
Sources Available: .key
Product ID: KC00725
Template incl.: 35 editable slides
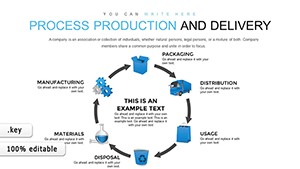
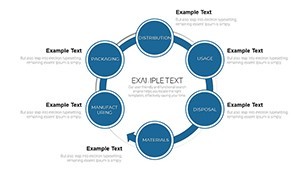
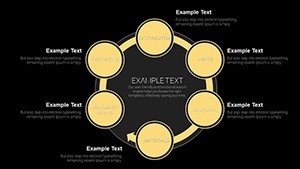
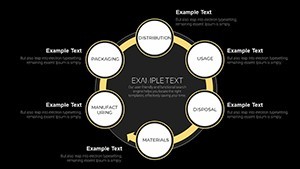
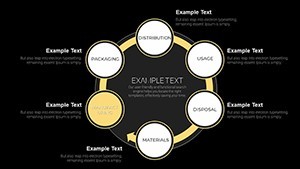
35 slides in a single .key file - process flows, production cycles, and operations layouts for Keynote
This Keynote chart template (product ID: KC00725) includes 35 editable slides priced at $22.00, categorized under Business Models on ImagineLayout. The file is Keynote-native (.key format) and contains a range of diagram structures oriented around sequential process flows, cyclic production stages, and operations breakdowns - covering the kind of content that operations managers and process leads typically need to build from scratch in standard slide tools.
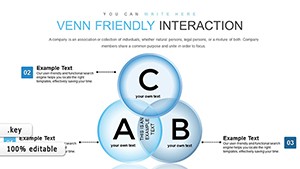
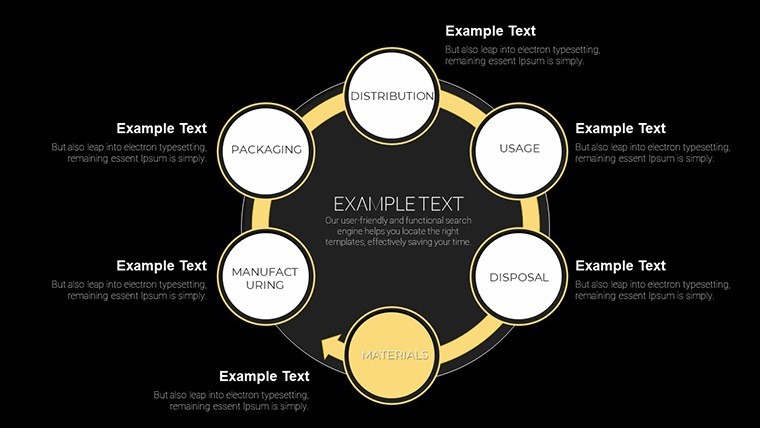
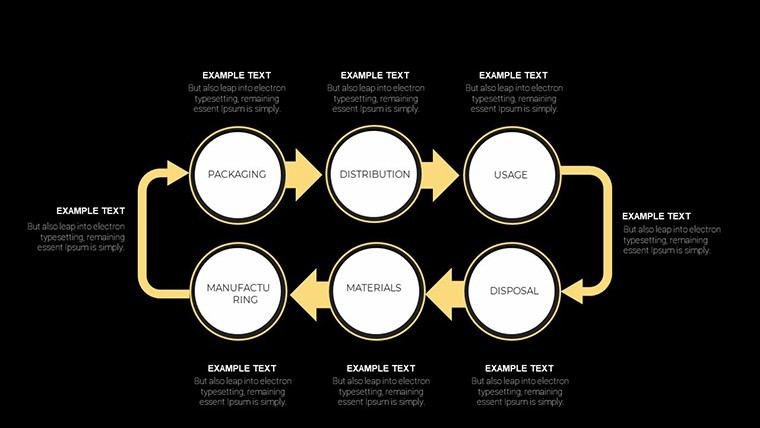
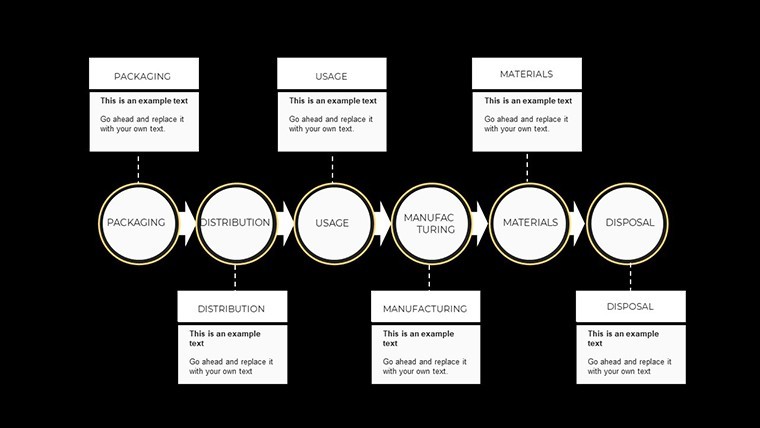
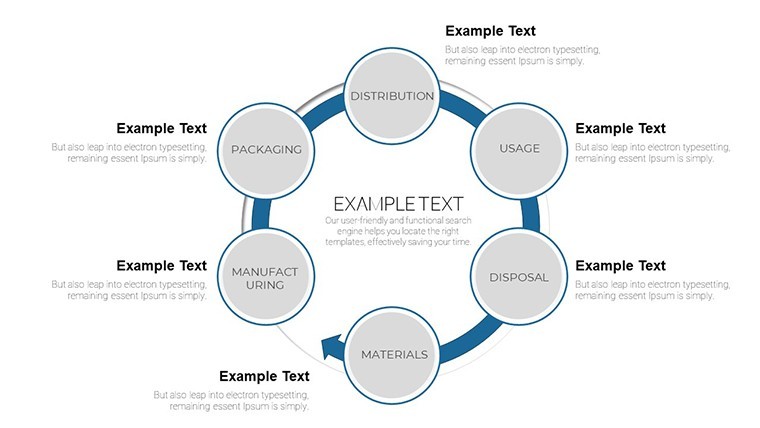
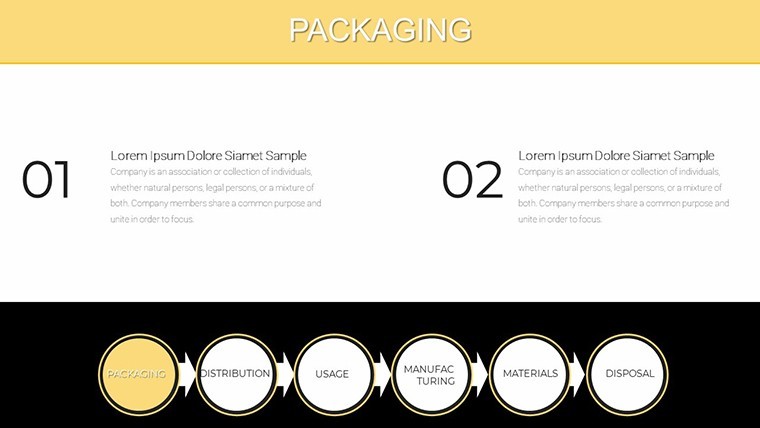
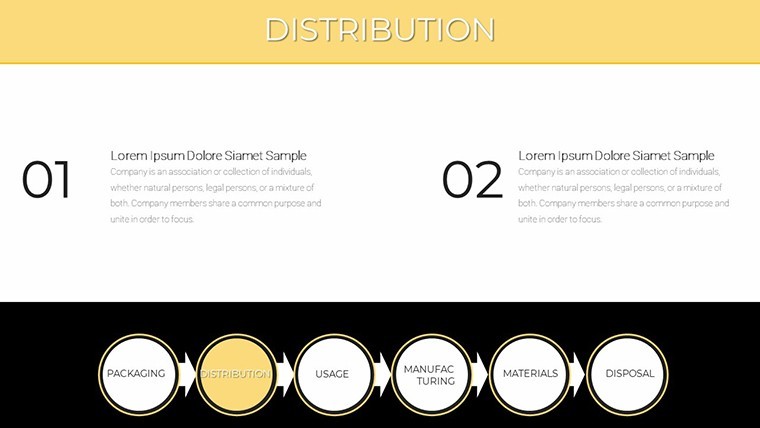
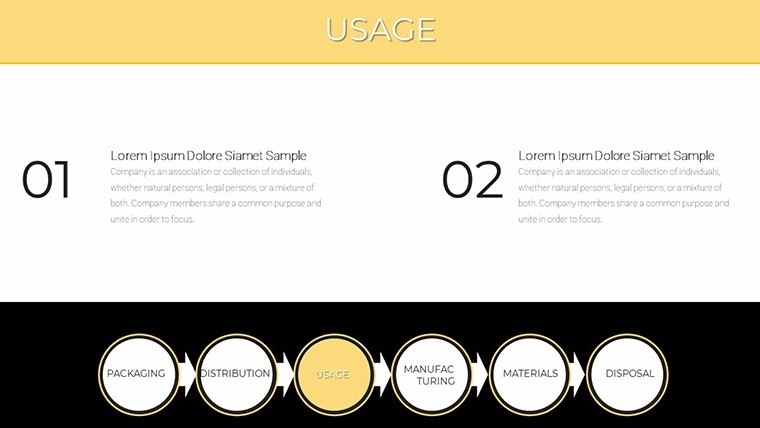
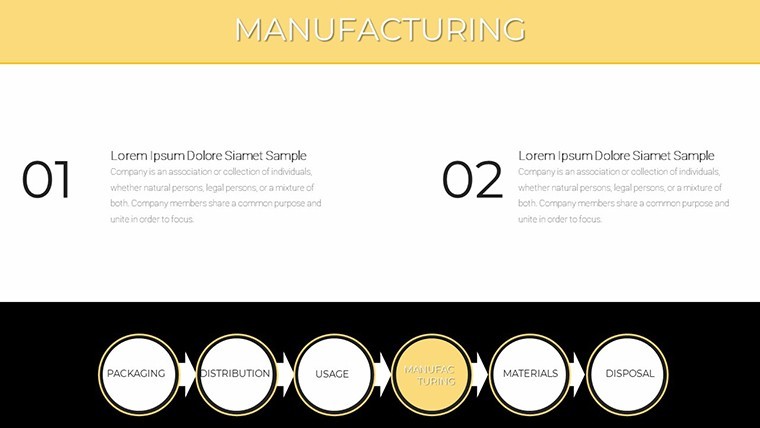
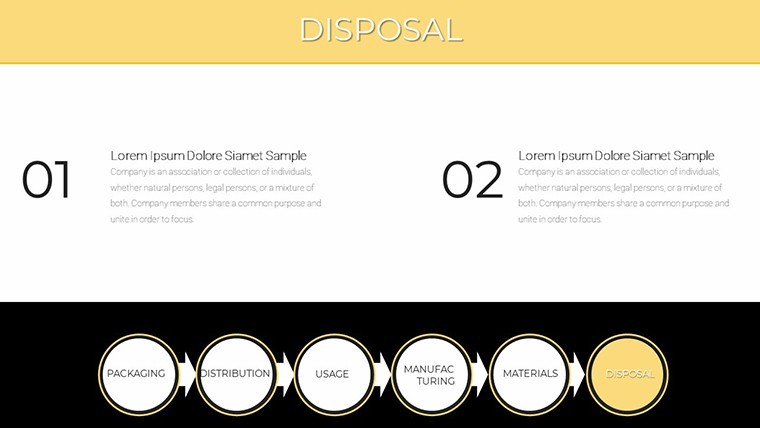
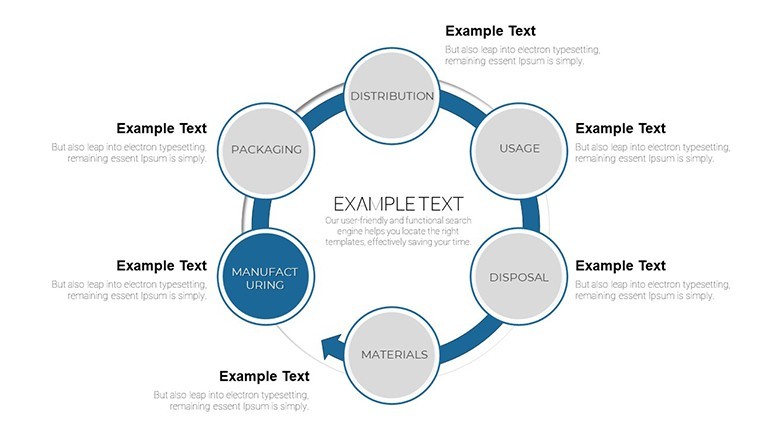
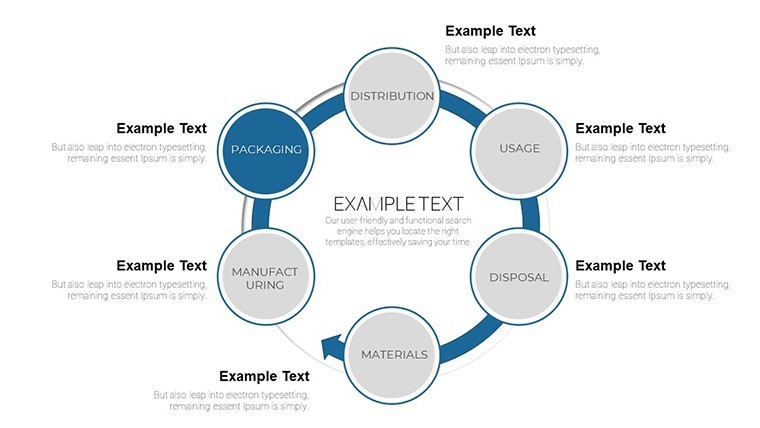
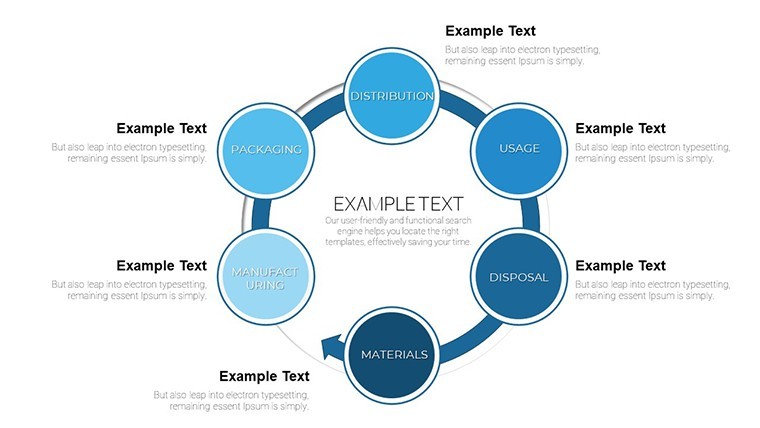
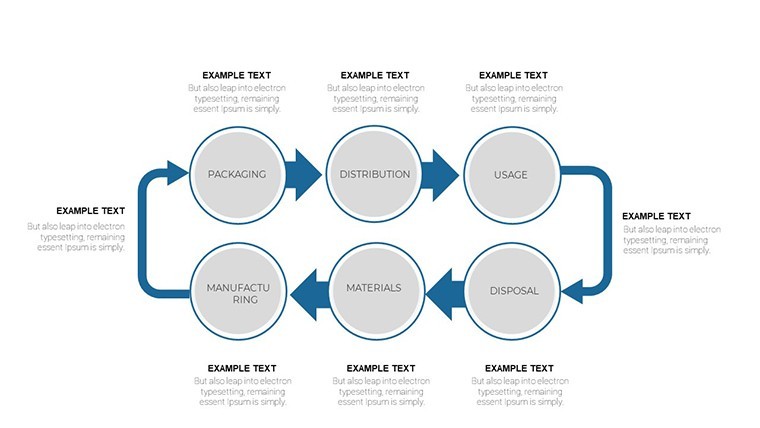
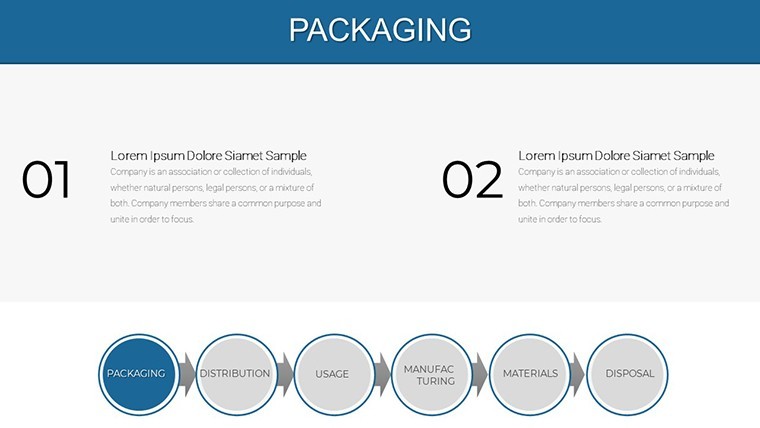
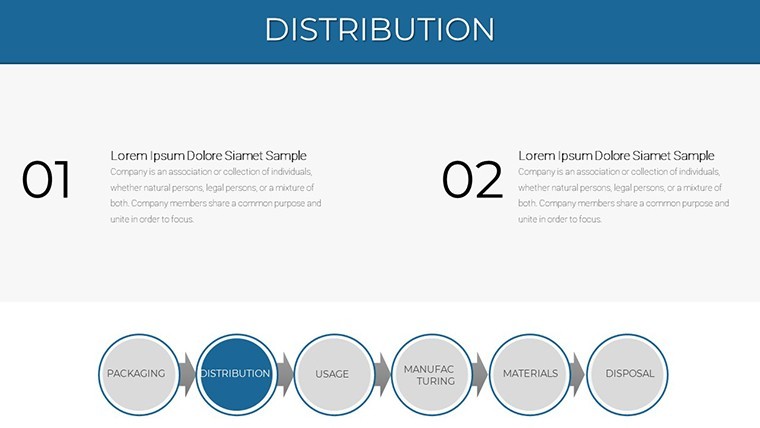
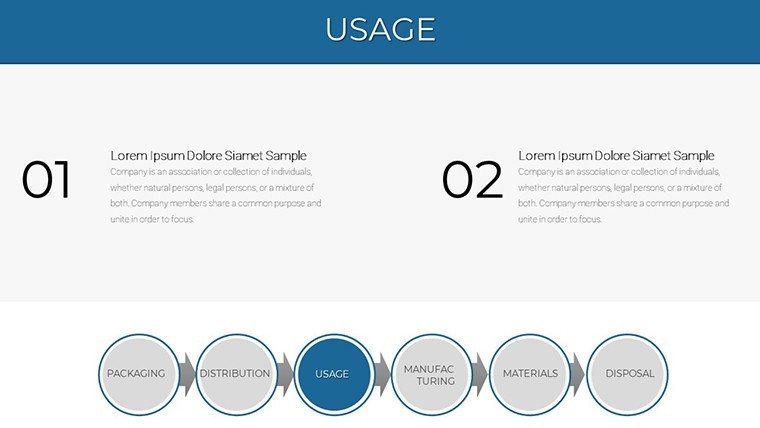
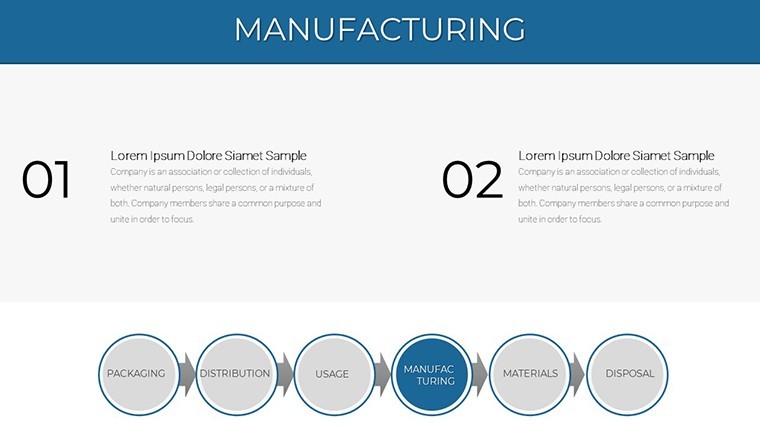
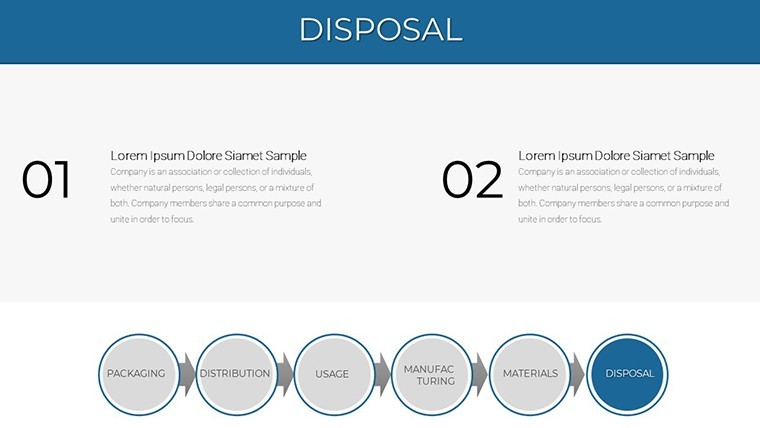
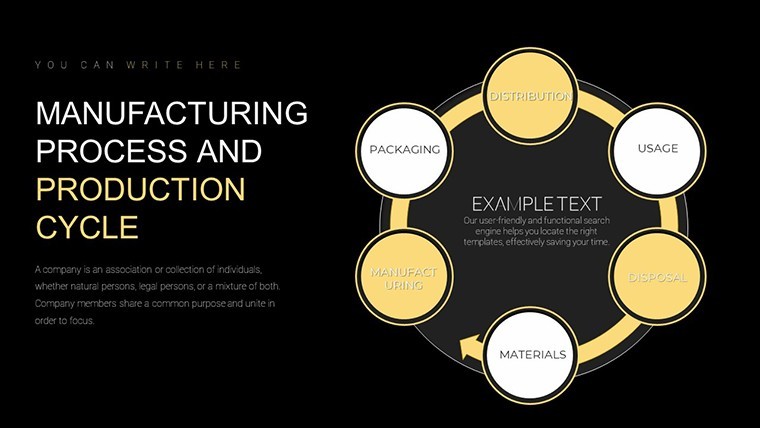
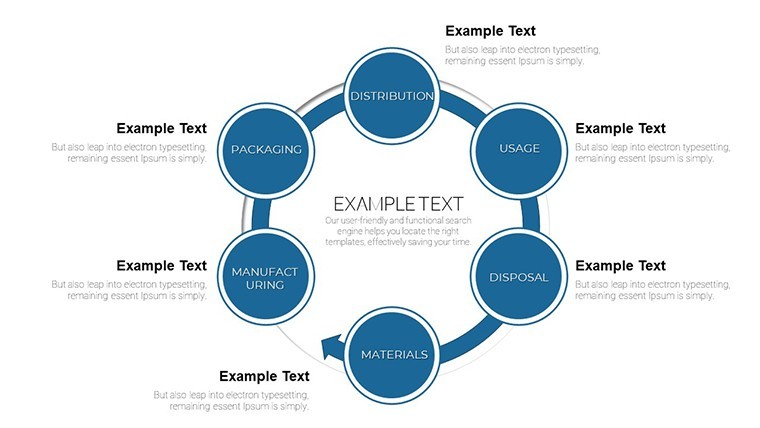
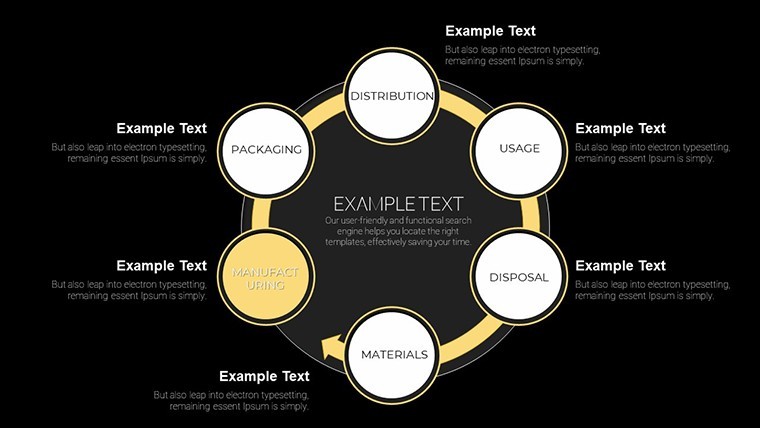
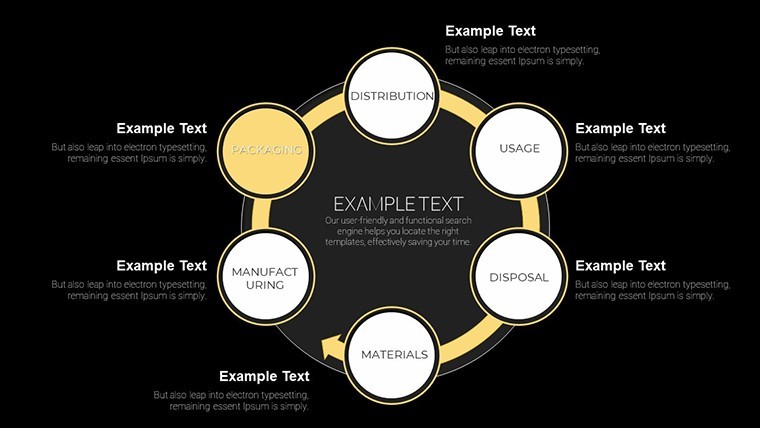
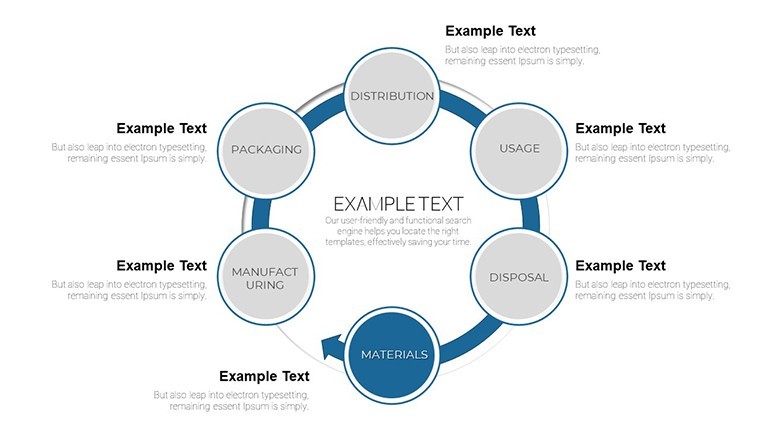
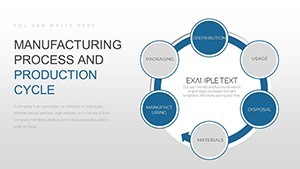
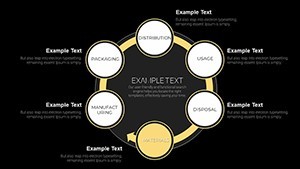
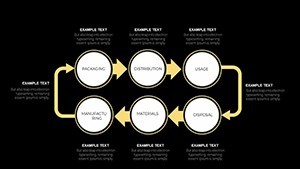
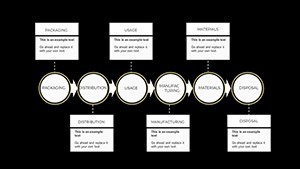
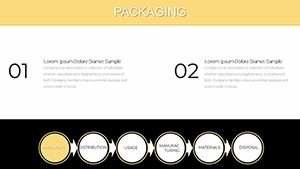
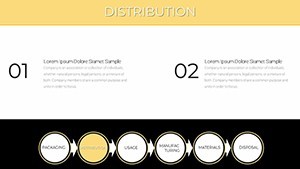
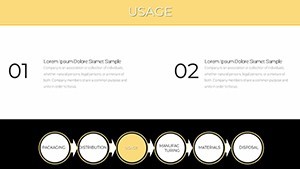
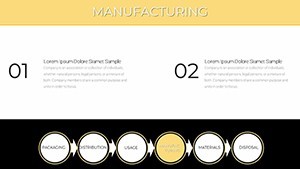
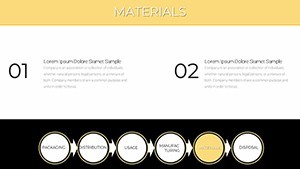
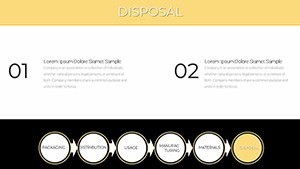
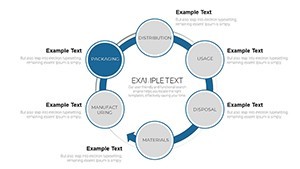
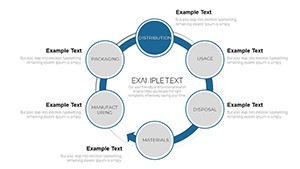
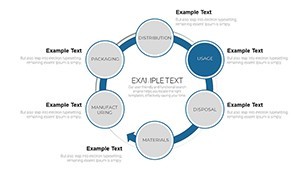
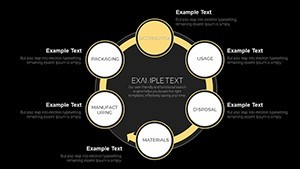
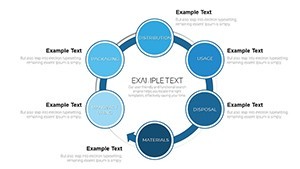
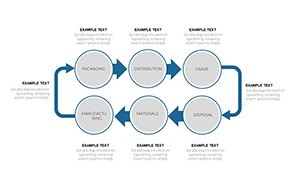
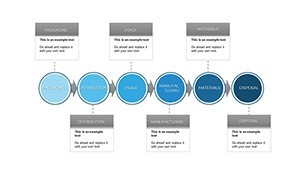
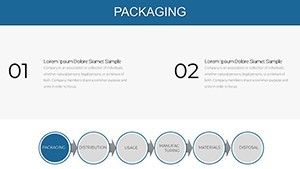
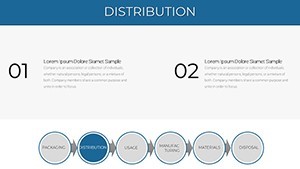
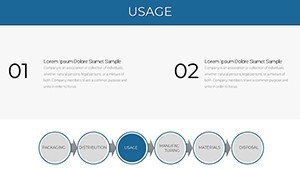
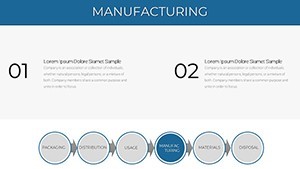
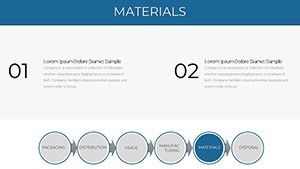
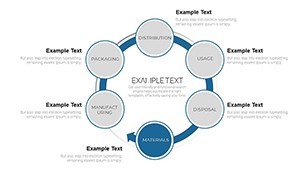
Visually, the layouts use arrow-driven horizontal and cyclic flow structures with labeled step blocks. Based on the tags listed - arrows, action, process, concept, business development - the deck is built around directional diagramming: inputs moving through stages to outputs, or stages looping in a continuous production cycle. Each step block is a separate editable element, so you can relabel stages, reorder sections, or swap color fills per segment without rearranging the underlying layout.
This kind of Keynote diagram template is useful when you need to explain a multi-stage production or operational workflow to stakeholders who are not close to day-to-day operations. Instead of assembling arrows and boxes manually in Keynote, you open the file and drop your stage labels into the predefined structure. The visual output stays readable on one slide even with five or six labeled steps - the layout handles spacing so you do not end up adjusting margins slide by slide.
Works best for structured, sequential content: manufacturing stage breakdowns, supply chain overviews, or quality control process summaries. Not designed for data-heavy dashboards with numeric charts or scatter plots - if your audience needs quantitative output visuals rather than process structure, a different file category would serve better. The arrow-based flow logic also means it is less suited to non-linear or network-style relationship diagrams.
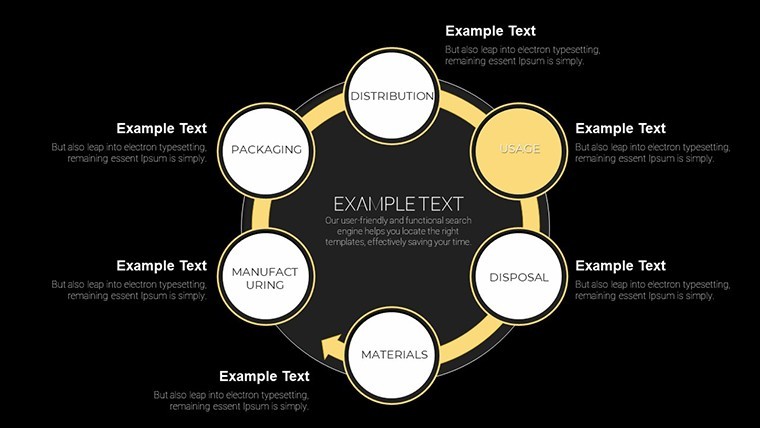
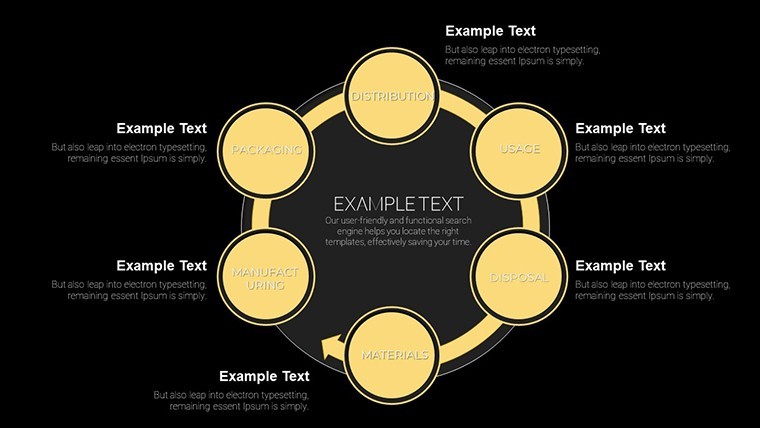
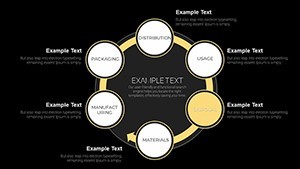
In practice, teams reuse the same flow diagram layout across recurring operational reviews, swapping out stage labels and color fills each quarter. The 35-slide count gives enough layout variation that you can pick the structure that fits your specific cycle length - whether a four-step linear flow or a six-stage closed loop - without duplicating and rebuilding a slide from scratch. Color edits are applied per element in Keynote's inspector; a full palette change across all 35 slides requires working through them individually, since no slide master color system is specified on the page.
Production managers, operations directors, and supply chain leads presenting internal process reviews or improvement plans to leadership are the primary fit for this deck.
Everything is already structured. Open the file and start placing your content.
Download and start editing immediately
Specifications
| Feature | Details |
|---|---|
| Slides | 35 editable slides covering process flows, production cycles, and operations diagrams |
| File format | .key (Keynote native) |
| Software version | Standard .key format compatible with current Keynote installations |
| Color schemes | Not specified on page; colors edited per element via Keynote inspector |
| Editable elements | Step block labels, arrow connectors, segment color fills, text fields |
| Aspect ratio | Not specified on page |
| Price | $22.00 (single paid version; no free tier listed) |
| Product ID | KC00725 |
Frequently Asked Questions
Which Keynote version is required to open this file?
The file is delivered in standard .key format. The page does not specify a minimum Keynote version, but the file follows standard KEY format conventions compatible with current macOS Keynote installations. If you are on an older macOS version, opening the file in the latest available Keynote for your system should work in most cases, though some animation behaviors may vary.
How do I change the color scheme of the process flow diagrams?
Color adjustments are made per element using Keynote's Format inspector panel. Select a step block, arrow, or segment, then change the fill color in the inspector. To apply a consistent color across all slides, you will need to update elements slide by slide - the page does not indicate a global slide master color system for this file. In most cases, users only change the colors of three to five key elements to align with brand guidelines.
Can this template be used for client deliverables or commercial presentations?
The standard license permits use in business presentations, including those prepared for clients. Redistributing the file itself as a template or reselling it as a design asset is not permitted. Check the full Terms of Use at imaginelayout.com/terms/ for the exact conditions before incorporating it into a commercial project.
Is there a free version of this template?
No free version is listed for this product. It is available as a single paid download at $22.00, which includes all 35 editable slides. There is no split between a free preview set and a paid full version for this file.
What is the refund policy?
ImagineLayout's refund policy is available at imaginelayout.com/refund-policy/. If the downloaded file has a technical problem that prevents it from opening or working correctly, contact the support team through the site's contact page. Refund eligibility depends on the nature of the issue, so reviewing the policy before purchase is advised.
See also: Keynote Charts templates and Business Models Keynote Chart templates.