6 Marketing Phases Keynote Charts - Editable Keynote | ImagineLayout


Type: Keynote Charts template
Category: Business Models
Sources Available: .key
Product ID: KC00722
Template incl.: 24 editable slides
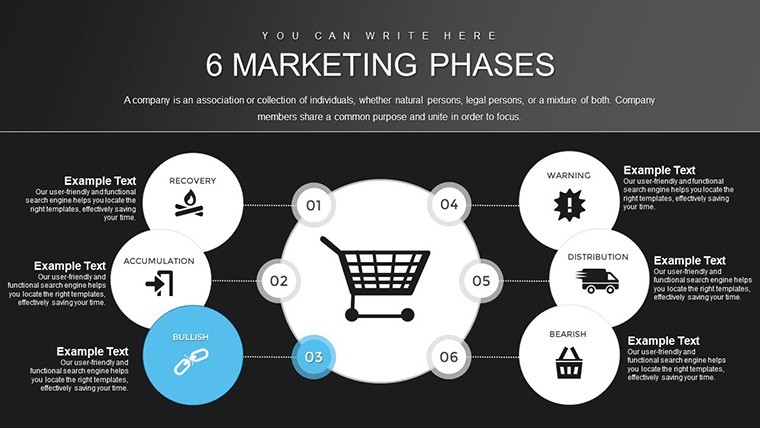
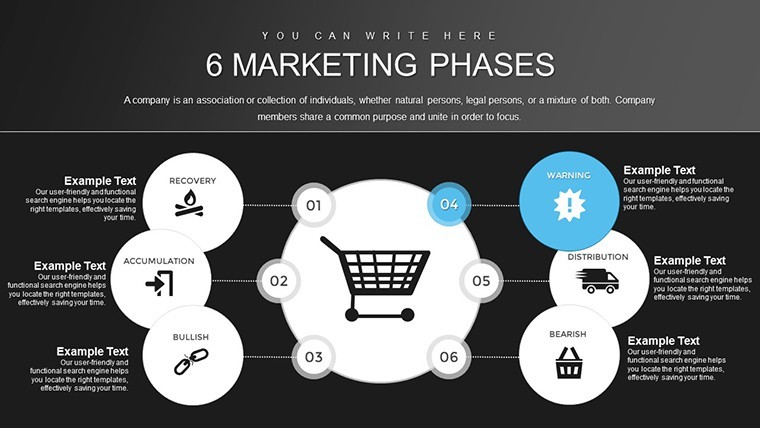
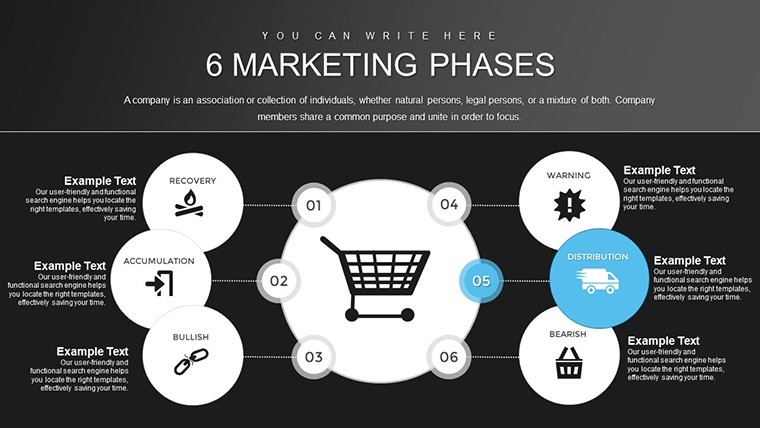
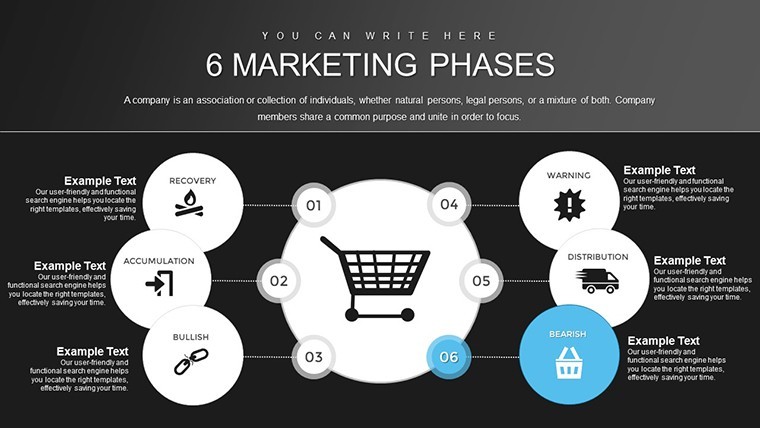
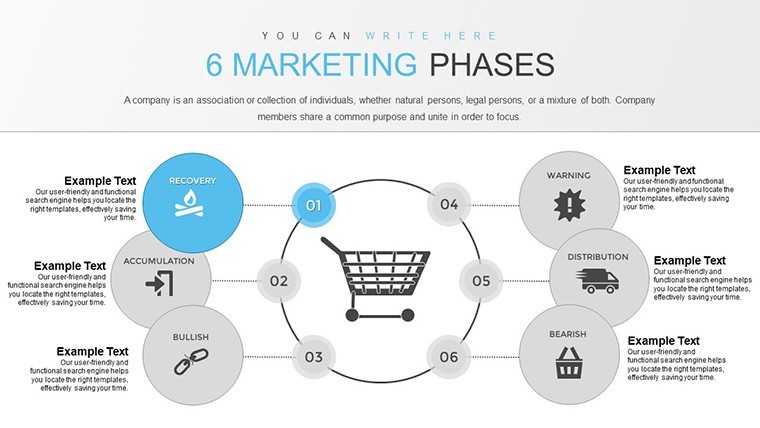
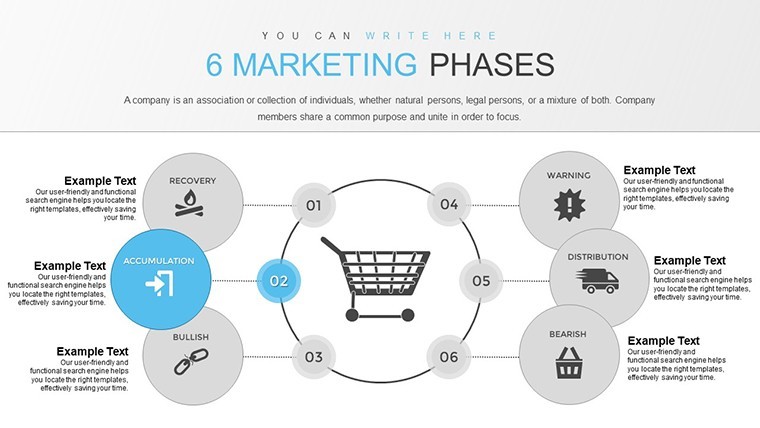
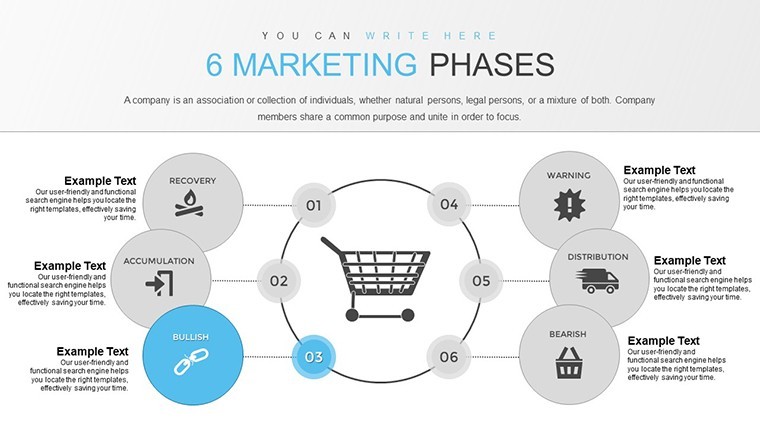
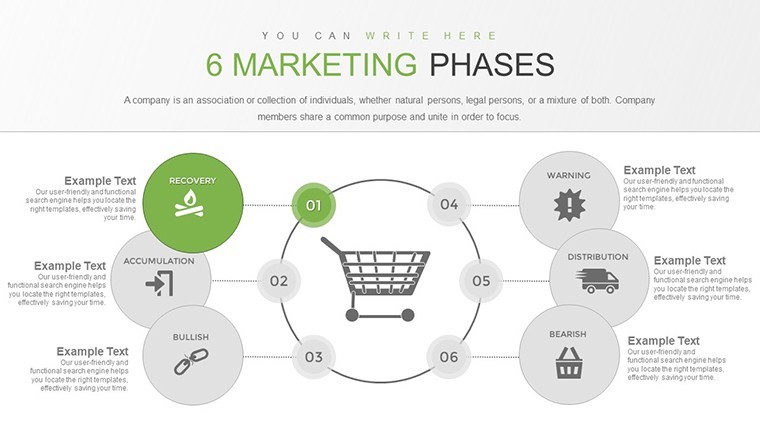
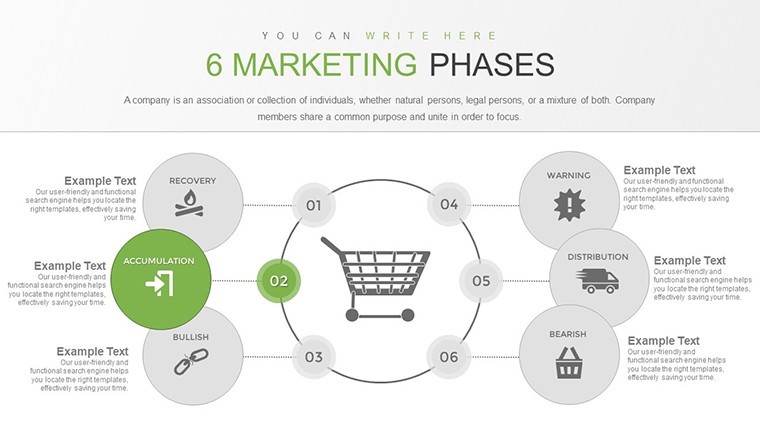
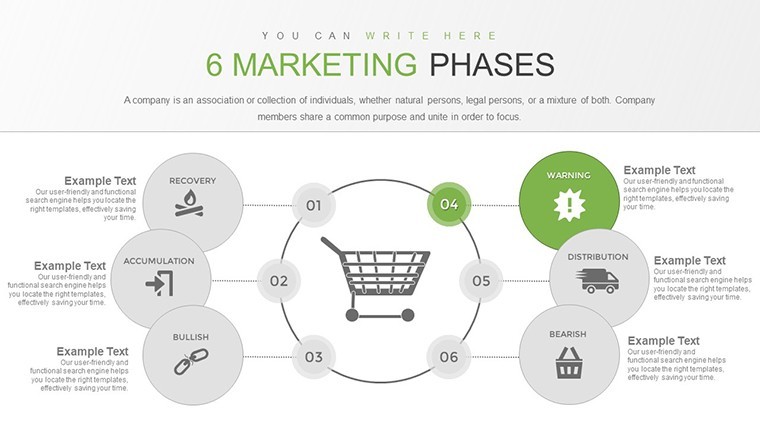
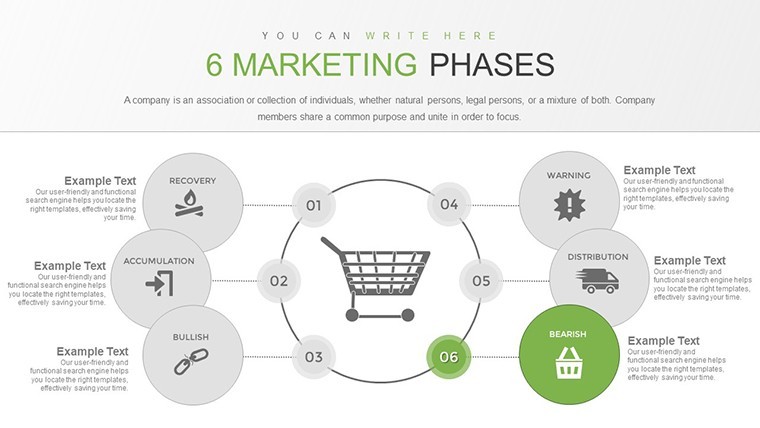
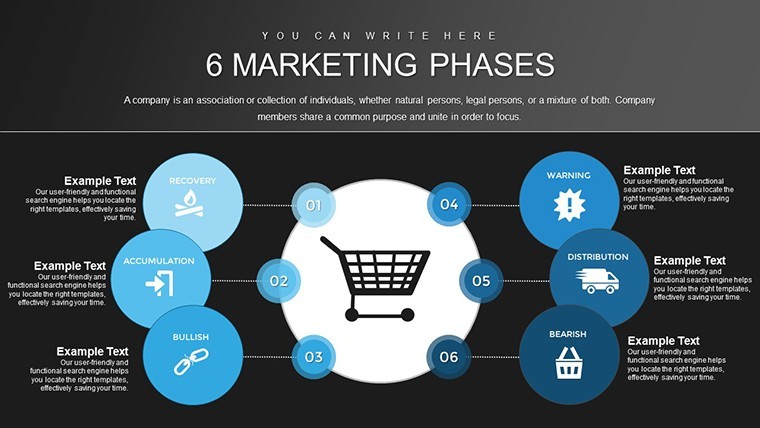
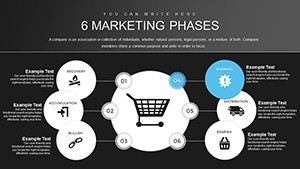
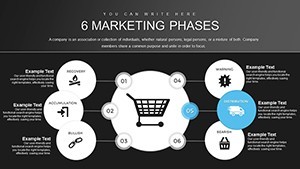
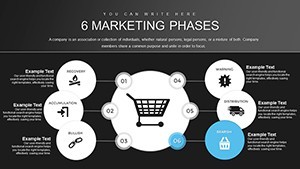
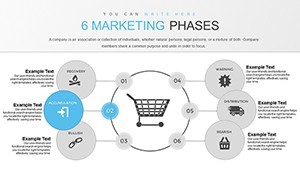
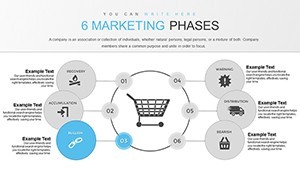
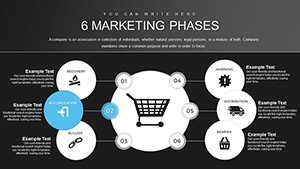
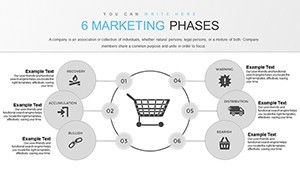
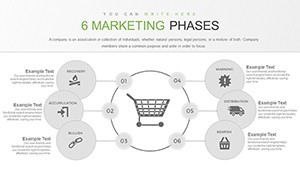
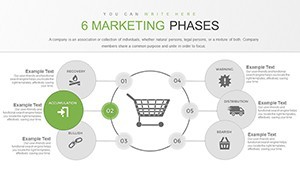
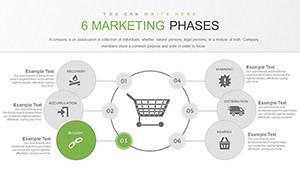
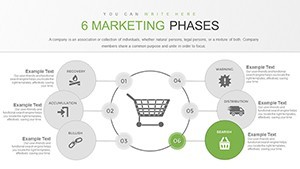
24 Slides, Six Phases - From Market Research to Performance Metrics
This Keynote chart template (KC00722, $12.00) covers the full arc of a marketing strategy in 24 editable slides: market research, segmentation, targeting, positioning, implementation, and evaluation - one dedicated slide group per phase. It's built for marketing managers, business analysts, and consultants who need to present a structured go-to-market plan without redrawing diagrams in Keynote from scratch.
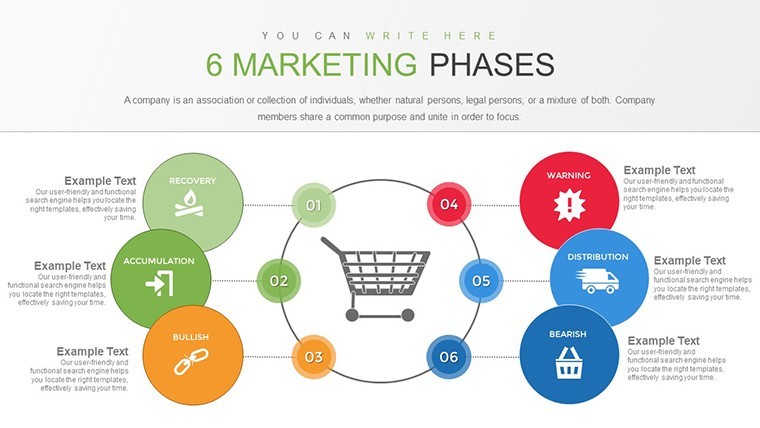
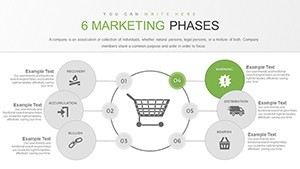
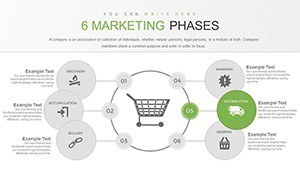
The visual structures across the 24 pages include SWOT matrices arranged in four-quadrant grids, bubble charts and radar diagrams for consumer attribute mapping, geographic segmentation frames, positioning comparison matrices, and ROI timeline slides. The layout follows a grid-based structure with flat icons. Slide density varies by phase - analysis slides are data-forward with multiple chart areas per page, while strategy slides use larger type and fewer elements to support spoken explanation.
The practical use case: you're presenting a new product's go-to-market plan to a leadership team and need to show not just the target segment, but how that segment was identified, what criteria filtered it, and what the positioning looks like against competitors. The file handles that logic sequentially - slides 2-7 give you the analysis layer, slides 8-12 the consumer attribute layer, and slides 13-24 the strategy execution and KPI measurement layer. No need to rearrange blocks manually.
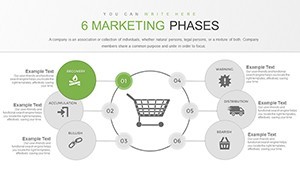
File compatibility is .key only - primarily for Keynote on Mac and iOS, with the page noting compatibility with Keynote version 6 and above. Export to PDF is available for cross-platform sharing. Color adjustments go through the slide master; you update the scheme once and it applies across slides. In most cases, teams customize the file by replacing phase labels, adding their segment data, and swapping competitor names in the positioning matrix.
Best used when the presentation follows a logical, phase-based structure that the audience will be walked through in sequence. Not a fit for creative campaign storytelling decks or presentations that rely on non-linear narratives. Works well for internal strategy reviews, investor briefings on market approach, or structured client pitches.
No separate free version is available - the $12.00 purchase gives access to the full 24-slide .key file. The page does not list slide size explicitly, but widescreen 16:9 is standard for the .key format in this collection.
Specifications
| Feature | Details |
|---|---|
| Slides | 24 editable slides - SWOT matrices, bubble/radar charts, segmentation frames, positioning maps, ROI timelines, KPI dashboards |
| File format | .key (Keynote) |
| Software version | Keynote 6 and above; macOS and iOS compatible |
| Aspect ratio | Standard Keynote widescreen (16:9) |
| Color schemes | Editable via slide master - update once, applies across all pages |
| Editable elements | Chart values, segment labels, positioning variables, icon colors, fonts |
| Export | PDF export available for cross-platform sharing |
| Free vs Paid | Single paid tier at $12.00; no free version listed |
| Product ID | KC00722 |
No extra setup required. Download and start editing immediately
How do I apply my brand colors to all slides at once?
Open the .key file and go to View > Edit Master Slides in Keynote. The color scheme for backgrounds, text, and shape fills is controlled at the master level - update those values once and Keynote applies the change across all slides using that master. For chart-specific colors (bar fills, radar segments), double-click the chart element, select the data series, and adjust the fill color via the Format sidebar. This avoids manual slide-by-slide editing across all 24 pages.
Does the license allow use in client-facing presentations?
The standard ImagineLayout license is for personal and internal business use. Using the template in a presentation delivered to or prepared for an external client - especially as part of a paid consulting project - may require a commercial license. Review the current Terms of Use at imaginelayout.com/terms/ and contact ImagineLayout support to confirm before client delivery.
What's included in the $12.00 purchase - is there a free version?
The $12.00 purchase gives access to the full 24-slide .key file. No free tier or preview-only download is listed for KC00722. The price reflects a one-time payment with no subscription involved - you download once and the file is yours to use and customize.
What is the refund policy for this purchase?
ImagineLayout's refund terms are at imaginelayout.com/refund-policy/. As a digital product, the file is generally non-refundable once downloaded. If the file fails to open, is missing slides, or does not match the listed product description, contact support with your order number - technical issues are typically reviewed case by case.
Which Keynote version do I need to open this file?
The product page specifies compatibility with Keynote version 6 and above, with no additional plugins required. Keynote 6 ships with macOS and is updated through the App Store. For best results - particularly for master slide editing and smooth animation playback - use a current Keynote version. The file also works on iOS devices running the Keynote app.
Compare with related strategy and market analysis files in the Business Models Keynote Charts section or the broader Keynote Charts catalog.